How to monitor IBM MQ instance on Google Cloud with Prometheus metrics
Pushpdeep Gupta
Cloud Engineer
Often, it is challenging to monitor third party applications on Google Cloud that do not have direct support in the cloud Ops agent for collecting telemetry data. As of April, 2023 here is a list of third-party supported applications. IBM MQ (messaging and queuing middleware) is one of the non-supported products by Ops agent that involves not only a hefty cost but also an overhead for Google Cloud customers to maintain and secure their telemetry data in other operations suites like Dyantrace, IBM monitoring service etc. In this article, I’m going to help you create your own monitoring flow that not only extracts metrics from your IBM MQ instance but also exports them into the native Cloud Monitoring for generating charts, dashboarding and alerting.
Prerequisites:
The flow we describe here has two major steps:
MQ Metrics Exporter:
MQ metrics exporter step can be understood as an abstraction layer between MQ server and Prometheus that transforms MQ metrics into Prometheus metrics for easy consumption. The MQ exporter exposes an endpoint where the Prometheus metrics can be scraped. To implement this exporter we need the below components:
IBM MQ Client: MQ client is part of IBM MQ product that can be installed on its own, on a separate machine from the base product and server. It is available free of cost. You must install this client on a host where you’re planning to run the MQ exporter. The exporter will use the MQ client to interact with one or more IBM MQ servers and connect to their queue managers to fetch useful metrics.
pymqi Python library: The exporter we plan to build is written in Python and it leverages various built-in methods from pymqi library to execute IBM MQ PCF commands. It launches PCF commands to get metrics from MQ servers. Make sure, you've Python 3.6.8 and pip3 installed on the host along with the below dependencies:
- Prometheus client: Prometheus client is required to represent MQ metrics as Prometheus metrics. It exposes an http endpoint to make these metrics available for data collectors. Since we’re writing our exporter in Python, we’ll be using the Python client for Prometheus. Ensure the below dependency is installed:
MQ Metrics data collector:
The data collector collects metrics from the MQ exporter and lets you store data in Cloud Monitoring for querying and dashboarding. Since the data can be queried globally using PromQL, you can keep using any existing Grafana dashboards, PromQL-based alerts, and workflows. The data collector we will be using in this solution is Ops agent as it is the easiest way to scrape our MQ exporter running on Compute Engines. However, you can containerize the exporter and run it in Google Kubernetes Engine containers. The Kubernetes environment you can leverage Google Cloud Managed Service for Prometheus with self-managed or managed data collector options to store metrics in Cloud Monitoring. Please see:
- Google Cloud Managed Service for Prometheus with managed collection
- Google Cloud Managed Service for Prometheus with self-deployed collection
- Google Cloud Managed Service for Prometheus with OpenTelemetry collector
Solution:
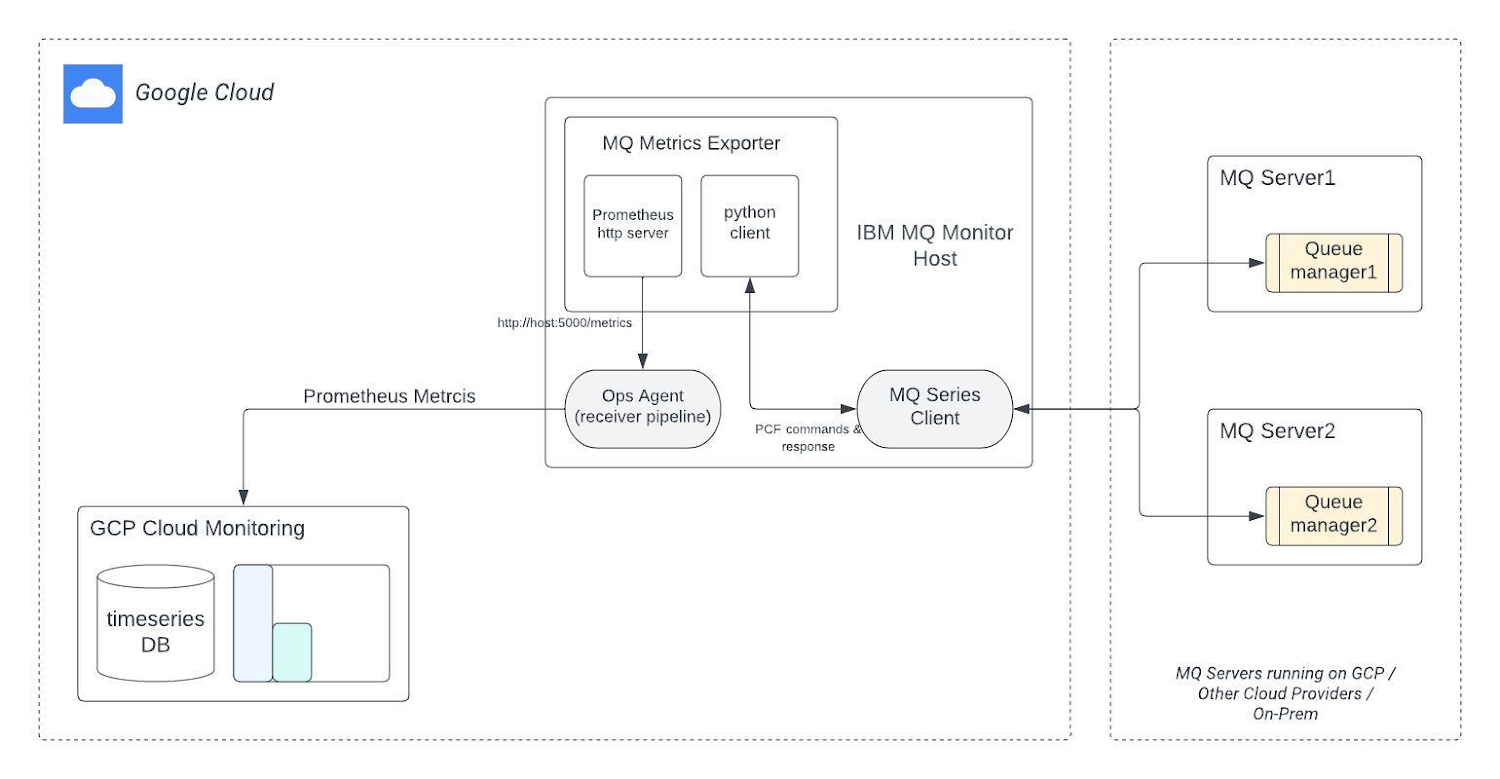
The Python client you run in the IBM MQ client environment issues PCF commands and then the request is redirected to a queue manager, where it is processed and from where a reply is sent back to the client.The link between the Python client and MQ client is established dynamically at run time. Ops Agent has a prometheus receiver that keeps polling http server (/metrics path) to collect and forward data to Cloud Monitoring.
Code Example:
Now we’ve all our dependencies addressed it’s time to look into the implementation of MQ Exporter with a few examples of IBM MQ metrics. Below sample code lets you capture three important metrics:
Current connection count
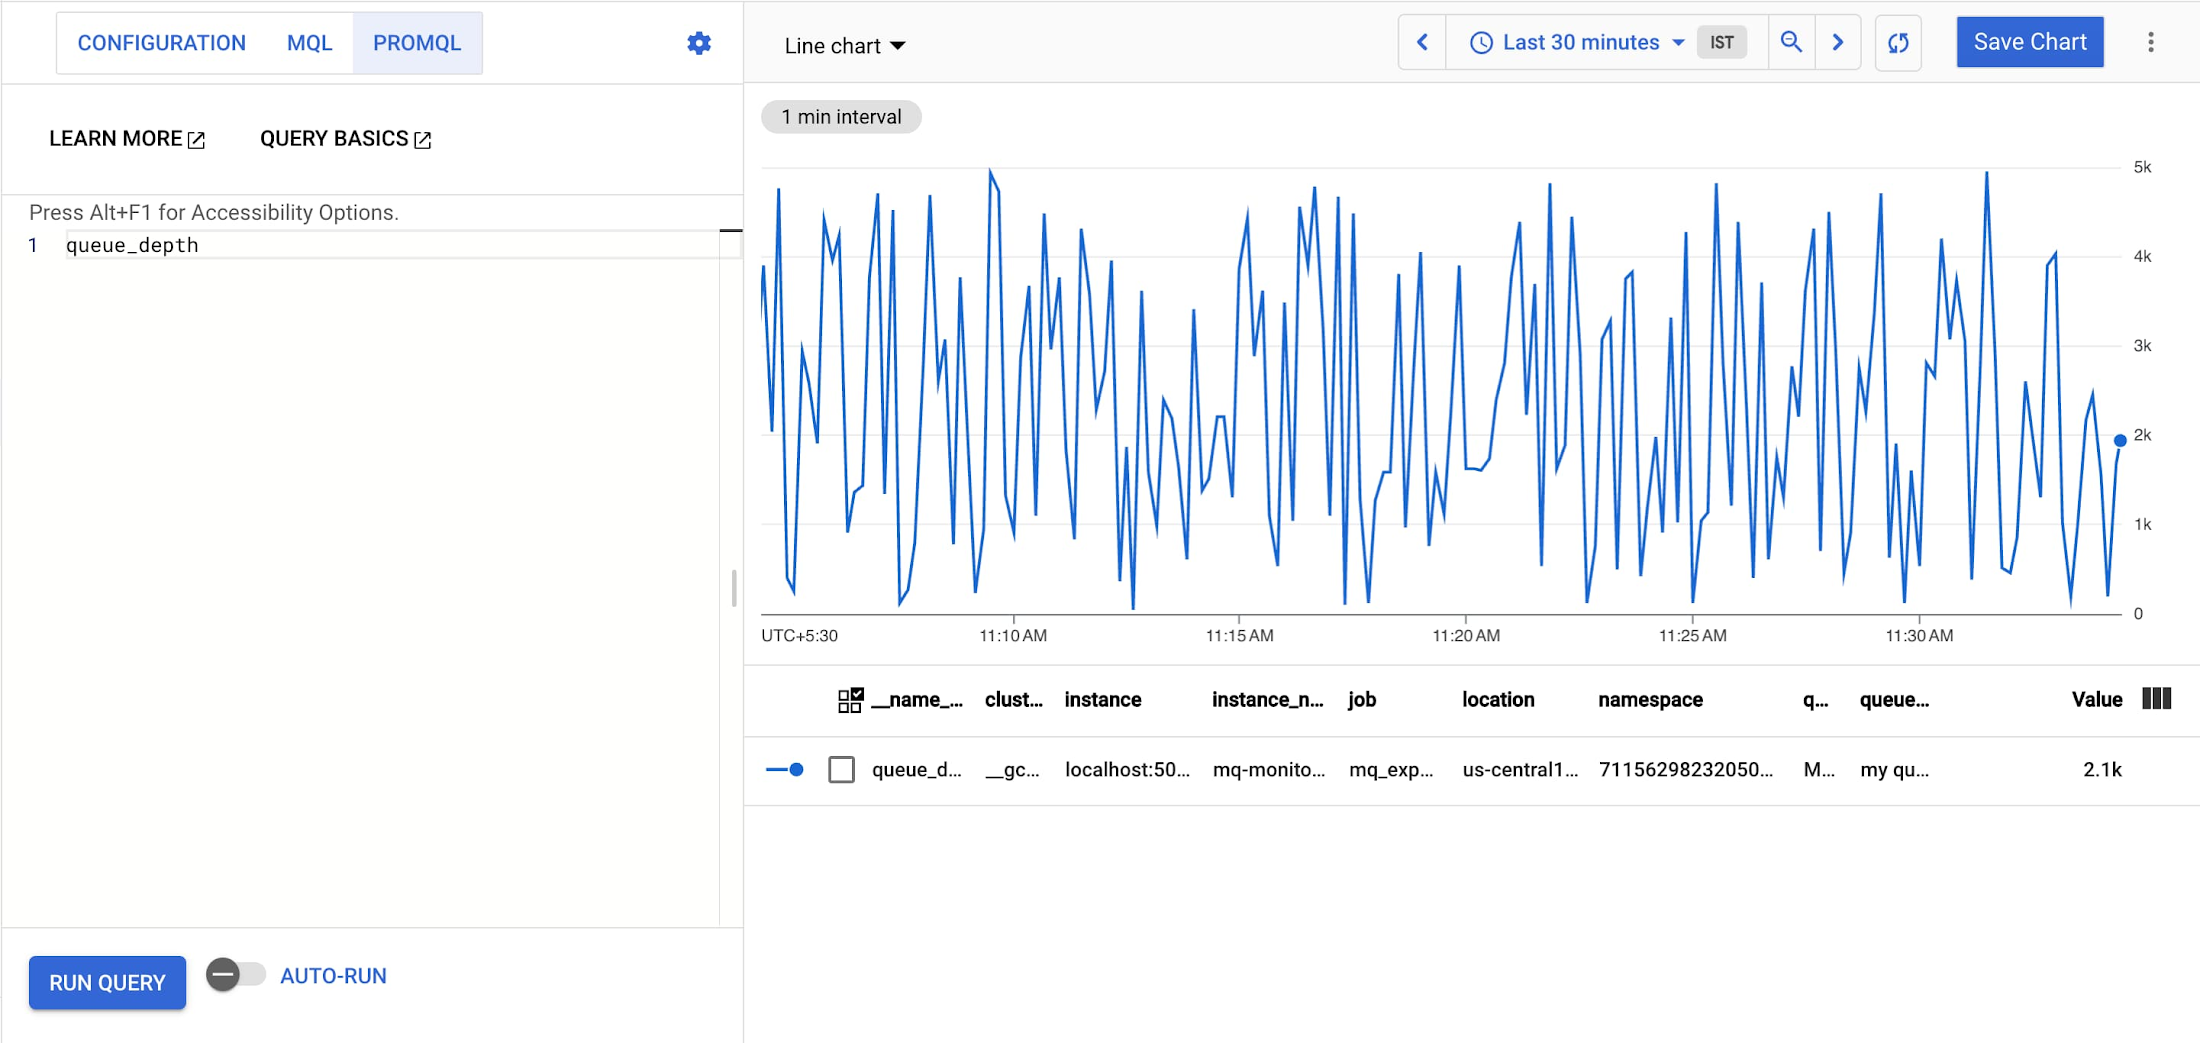
Queue depth.
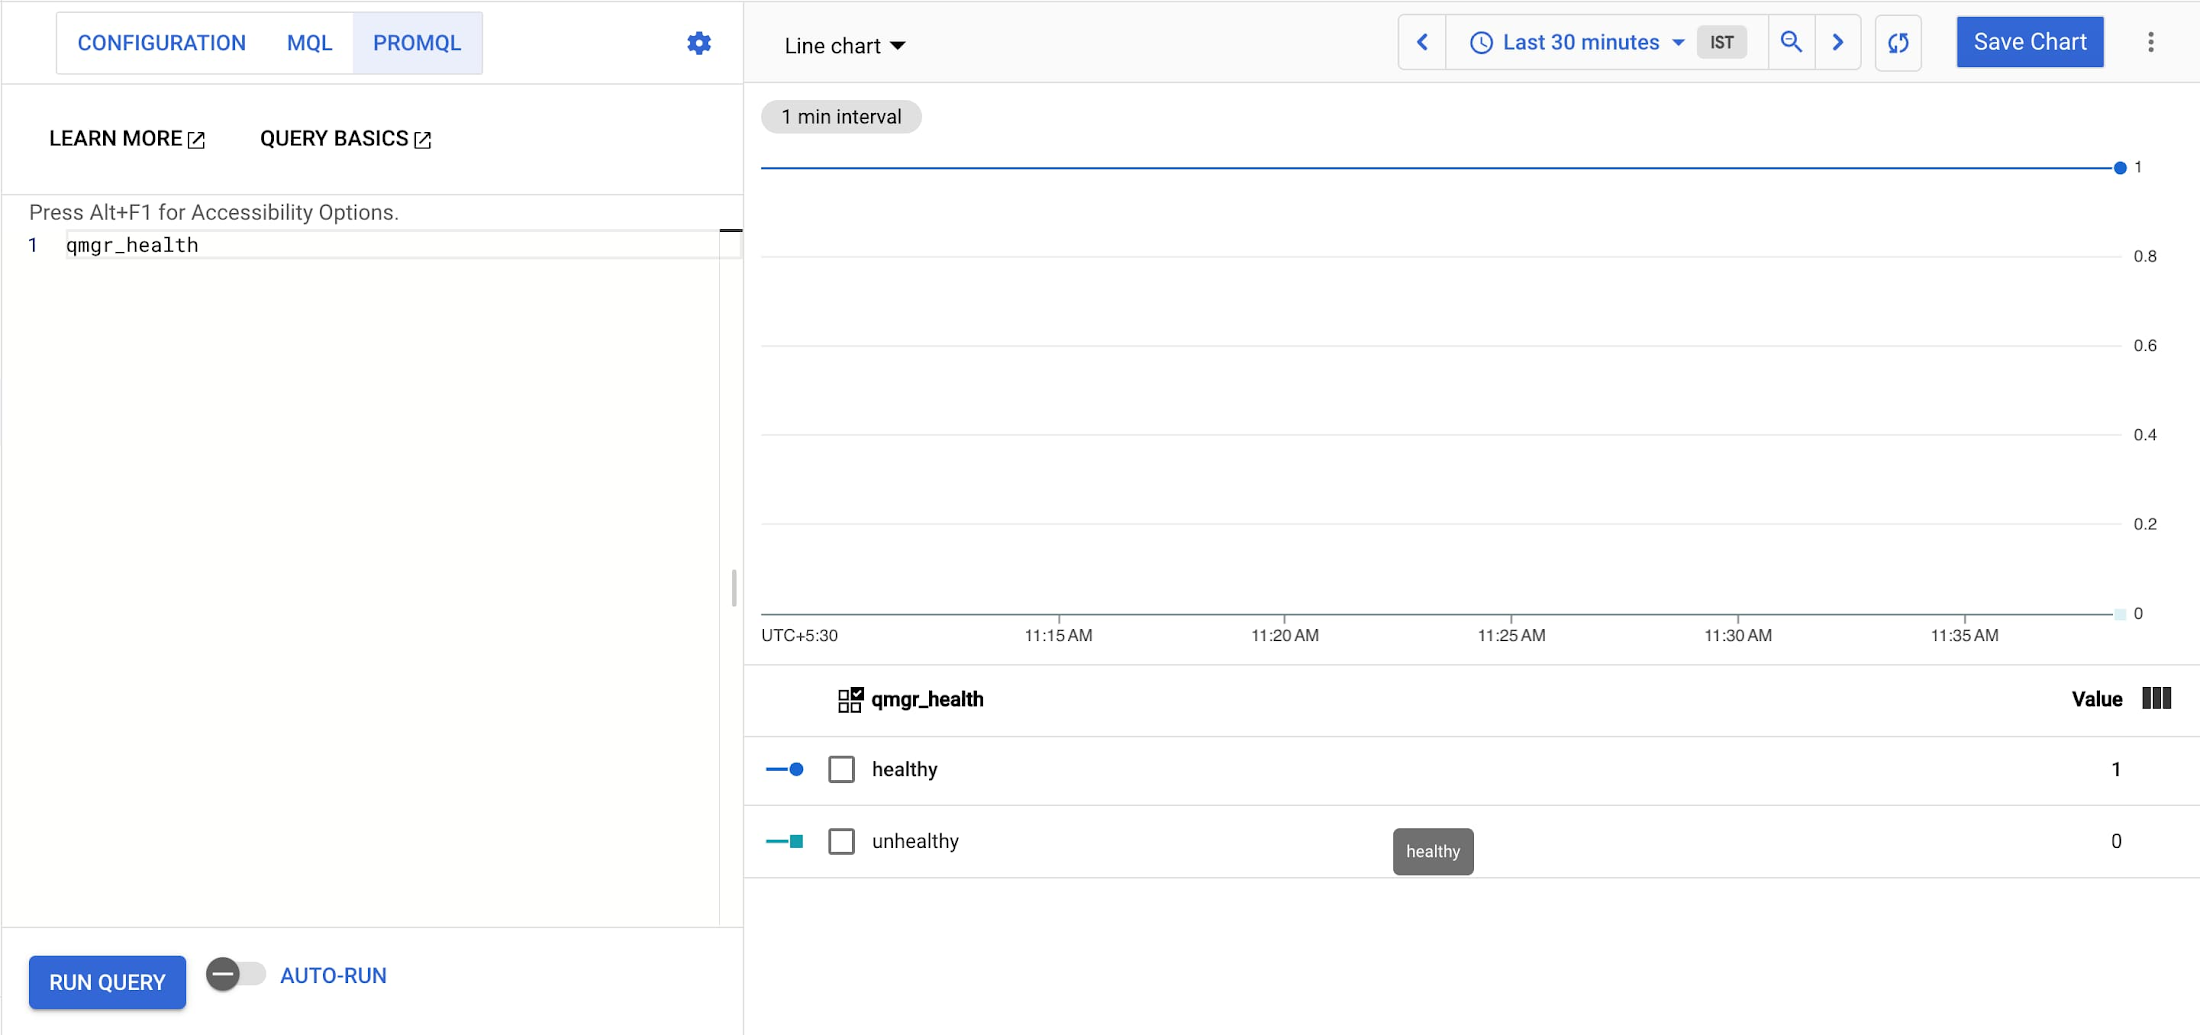
Queue manager health state
You can extend this code to capture as many metrics as required.
Metric Collection:
We need to collect the exported metrics with a data collector. Follow the steps below to setup Ops Agent on your host:
Install the Ops Agent. You must install the version 2.25.0 or higher.
Edit the Ops Agent configuration file, /etc/google-cloud-ops-agent/config.yaml and add Prometheus receiver and pipeline:
Note: Change the target host to point collector to your machine where the MQ exporter is running.
Restart the Ops Agent
Viewing Prometheus metrics with Cloud Monitoring
After running the MQ exporter and Ops Agent as mentioned above, you can visualize metric data with the help of below options available in Cloud Monitoring:
You can also view your metrics in other interfaces, like Prometheus UI and Grafana.
To verify that our 3 MQ metrics are being ingested, we’ll use PromQL:
In the Google Cloud Console, go to Monitoring.
In the Monitoring navigation pane, click Metrics Explorer.
Select the PromQL tab.
Execute the following queries one by one to see data and chart:
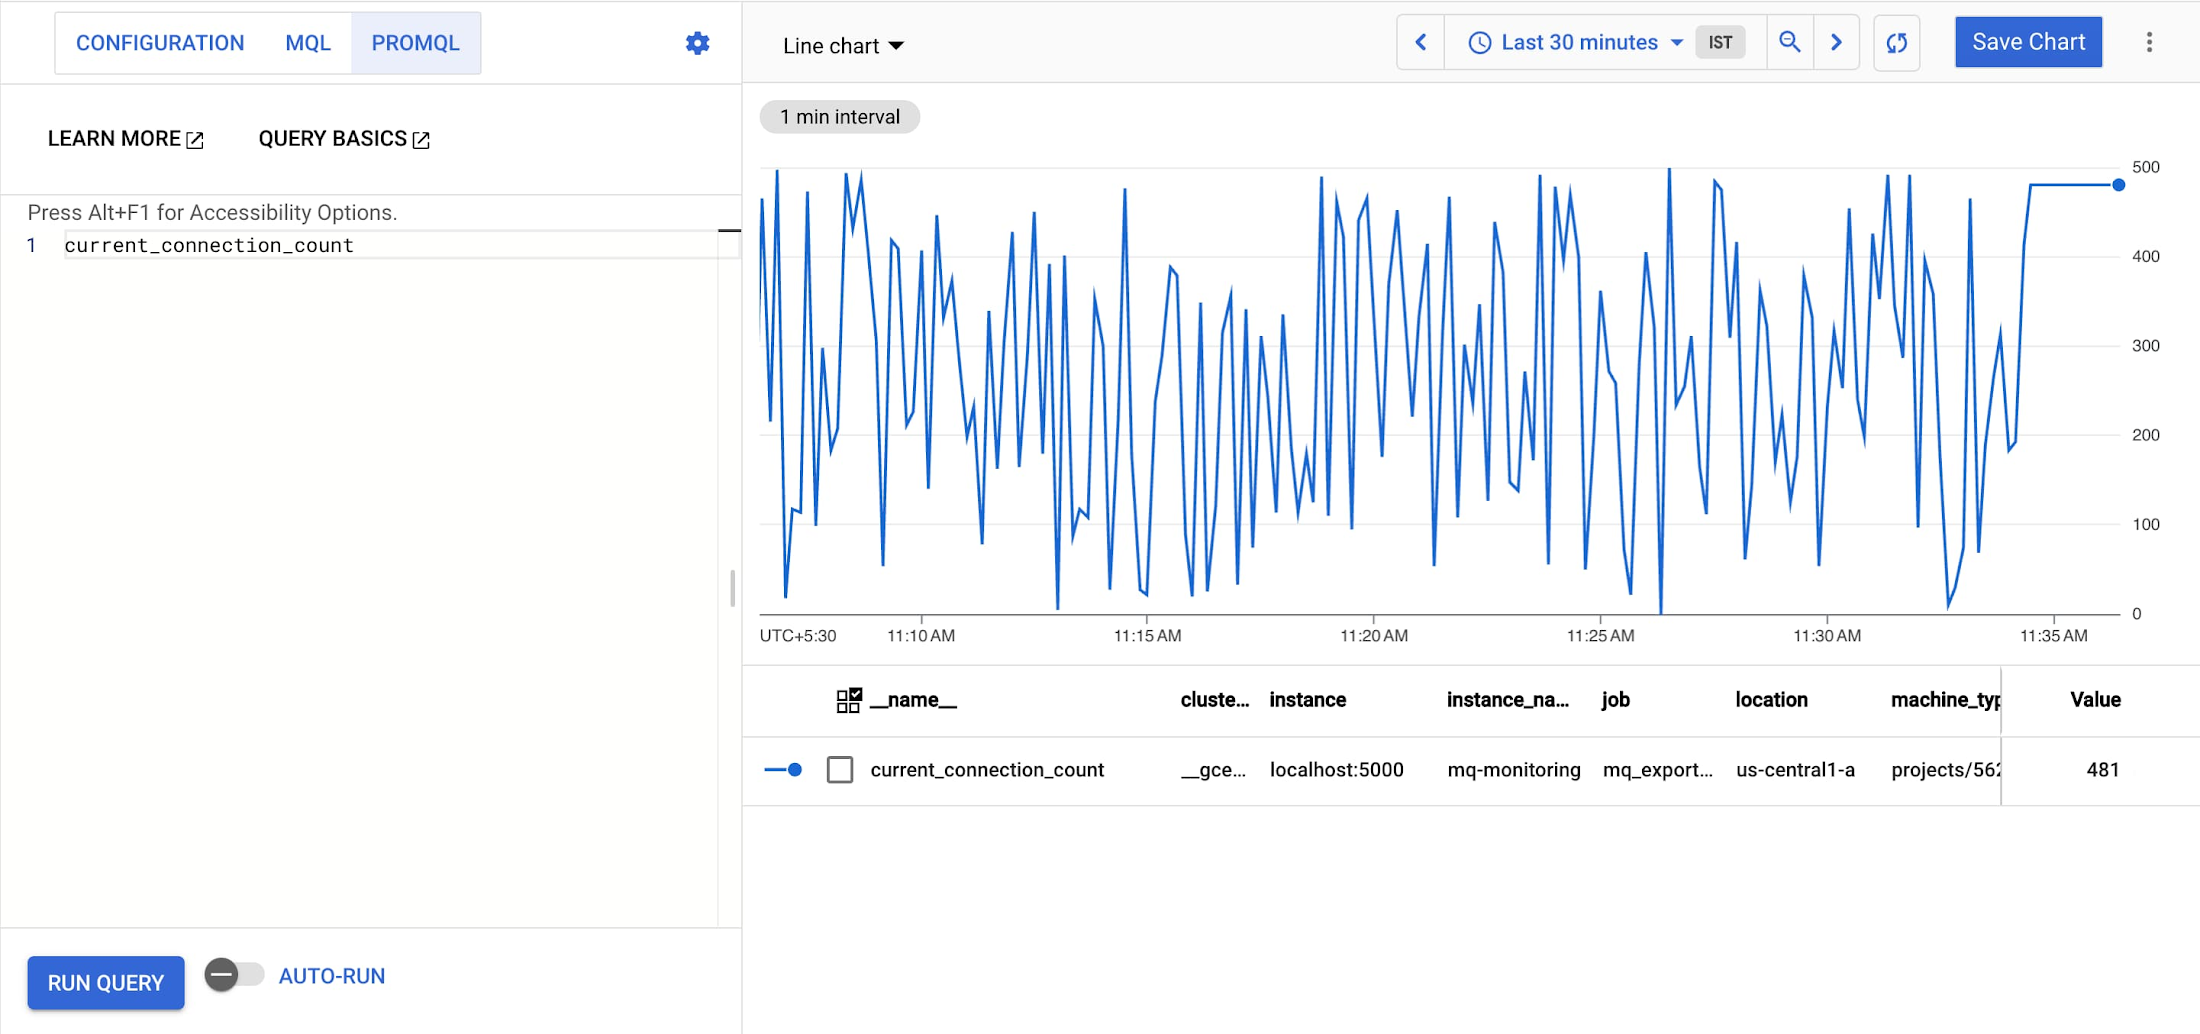
Metric 1: Current connection count
Summing-up:
Now that we’ve understood that MQ exporter and Ops Agent components are independent in nature, it can be deployed in a distributed manner or bundled on the same machine. However, the recommendation for MQ monitor (or exporter) is to deploy it on a different machine than MQ server to ensure scalability.
The sample code mentioned above covers few metrics, however, you can extend the solution to execute more PCF commands available in pymqi library to gather additional metrics mentioned below:
Shared connections
Active channels
Channel status
Total messages
Bytes sent/received
Buffer sent/received
Queue depth percentage
Queue I/O
Uncommitted messages
Enqueued messages
Dequeued messages
What’s-next:
Cloud Monitoring provides visibility into the performance, uptime, and overall health of cloud-powered applications whereas Cloud Logging is a fully managed service that performs at scale and can ingest application and platform log data, as well as custom log data from GKE environments, VMs, and other services inside and outside of Google Cloud.
Get started today with the below interactive articles:
References:
Check-out the below references to learn more: