Introducing the new Google Cloud Trace Explorer
Sujay Solomon
Senior Product Manager
Punya Biswal
Engineering Manager
Distributed tracing is a critical part of an observability stack, letting you troubleshoot latency and errors in your applications. Cloud Trace, part of Google Cloud Observability, is Google Cloud’s native tracing product, and we’ve made numerous improvements to the Trace explorer UI on top of a new analytics backend.
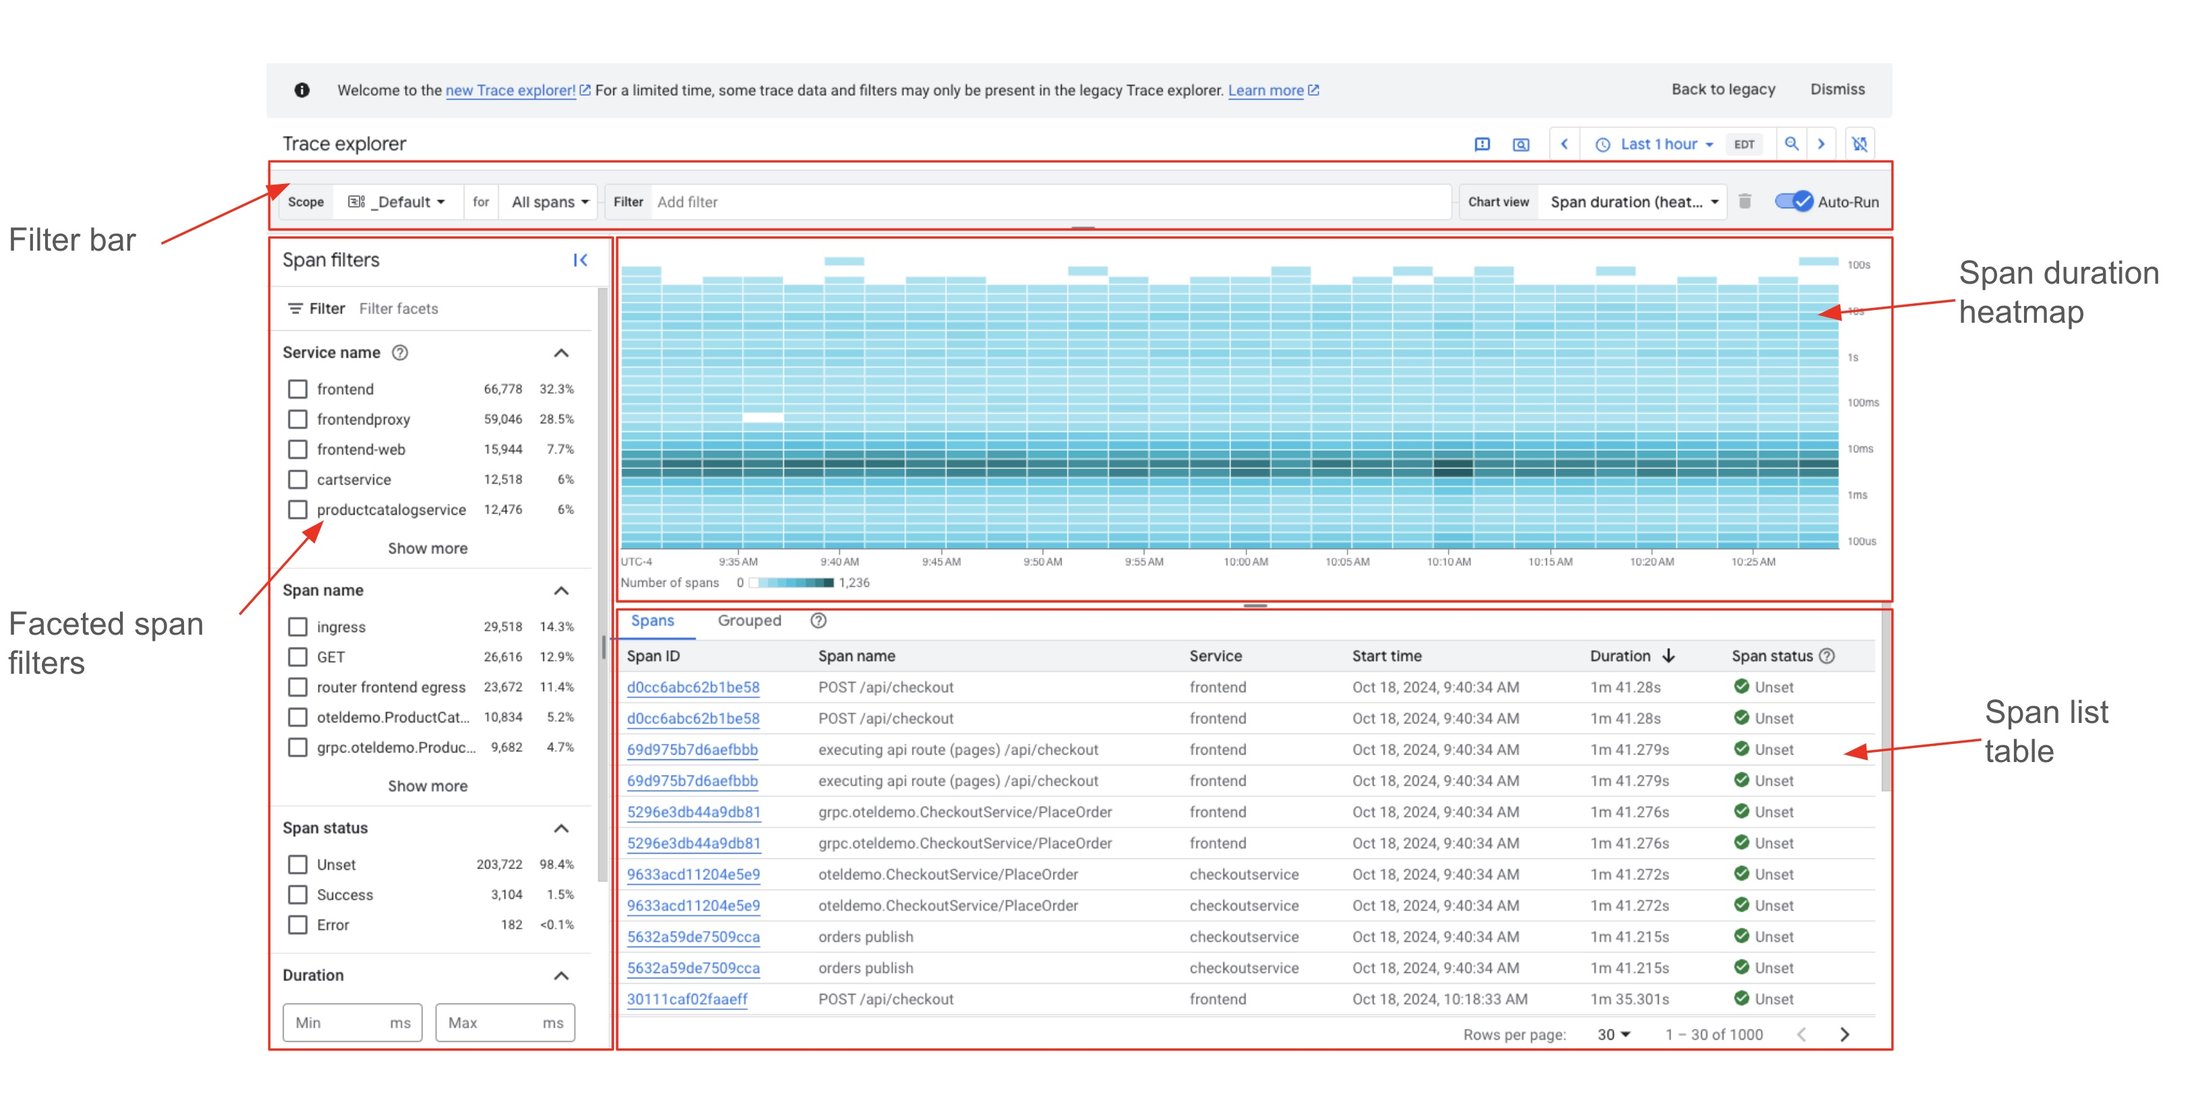
The new Trace explorer page contains:
-
A filter bar with options for users to choose a Google Cloud project-based trace scope, all/root spans and a custom attribute filter.
-
A faceted span filter pane that displays commonly used filters based on OpenTelemetry conventions.
-
A visualization of matching spans including an interactive span duration heatmap (default), a span rate line chart, and a span duration percentile chart.
-
A table of matching spans that can be narrowed down further by selecting a cell of interest on the heatmap.
A tour of the new Trace explorer
Let’s take a closer look at these new features and how you can use them to troubleshoot your applications. Imagine you’re a developer working on the checkoutservice of a retail webstore application and you’ve been paged because there’s an ongoing incident.
This application is instrumented using OpenTelemetry and sends trace data to Google Cloud Trace, so you navigate to the Trace explorer page on the Google Cloud console with the context set to the Google Cloud project that hosts the checkoutservice.
Before starting your investigation, you remember that your admin recommended using the webstore-prod trace scope when investigating webstore app-wide prod issues. By using this Trace scope, you'll be able to see spans stored in other Google Cloud projects that are relevant to your investigation.
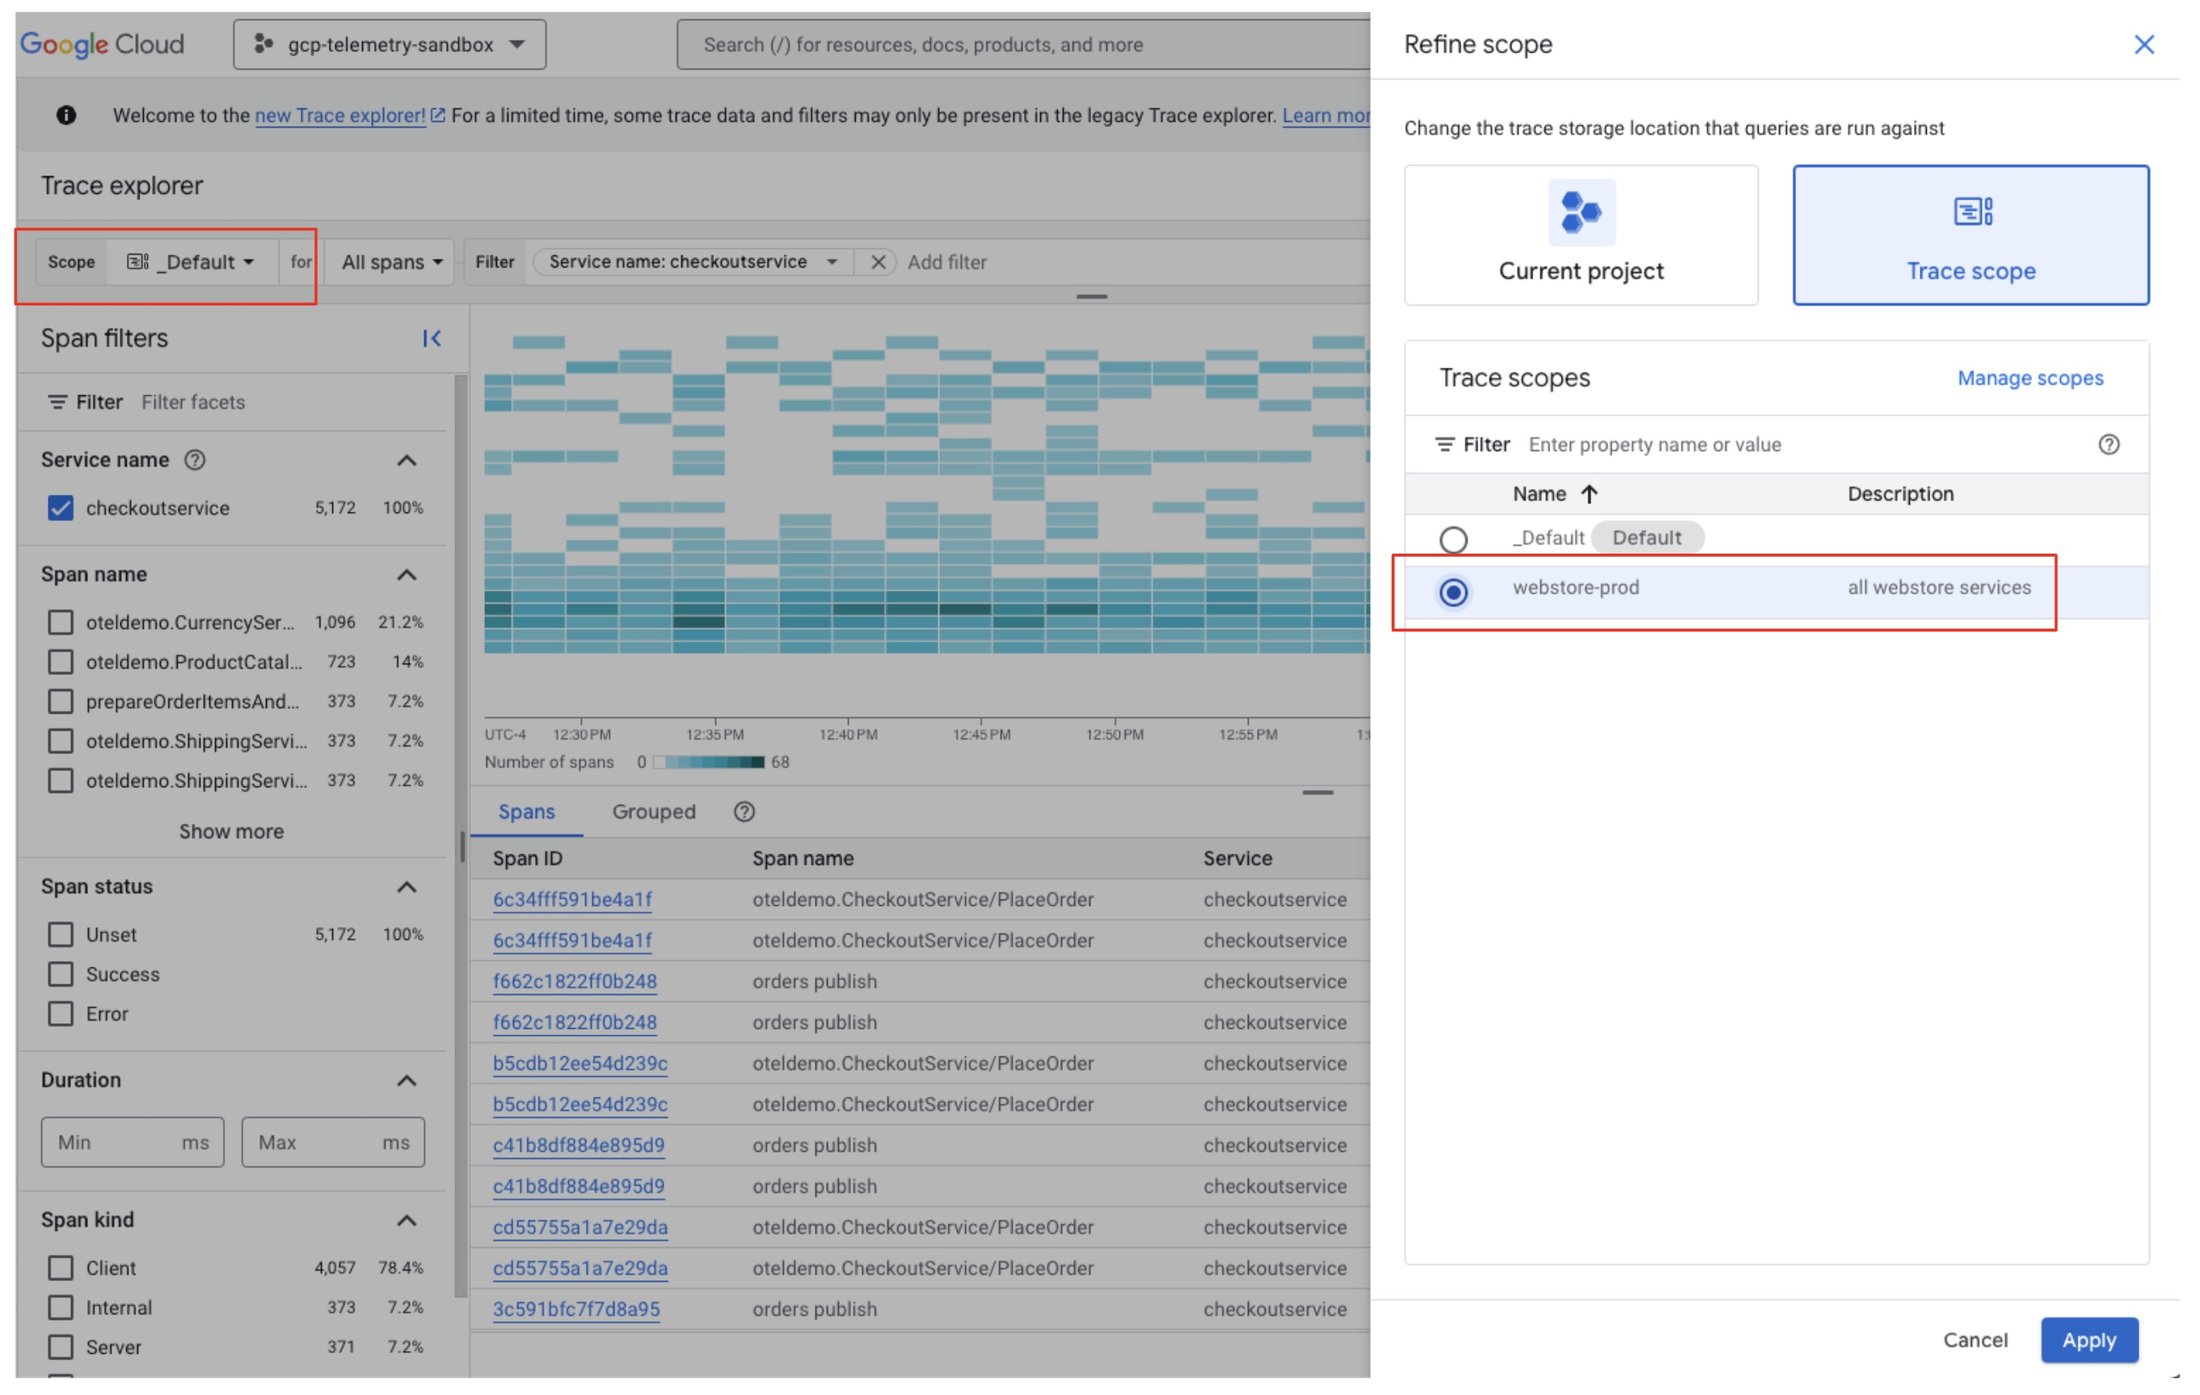
You set the trace scope to webstore-prod and your queries will now include spans from all the projects included in this trace scope.
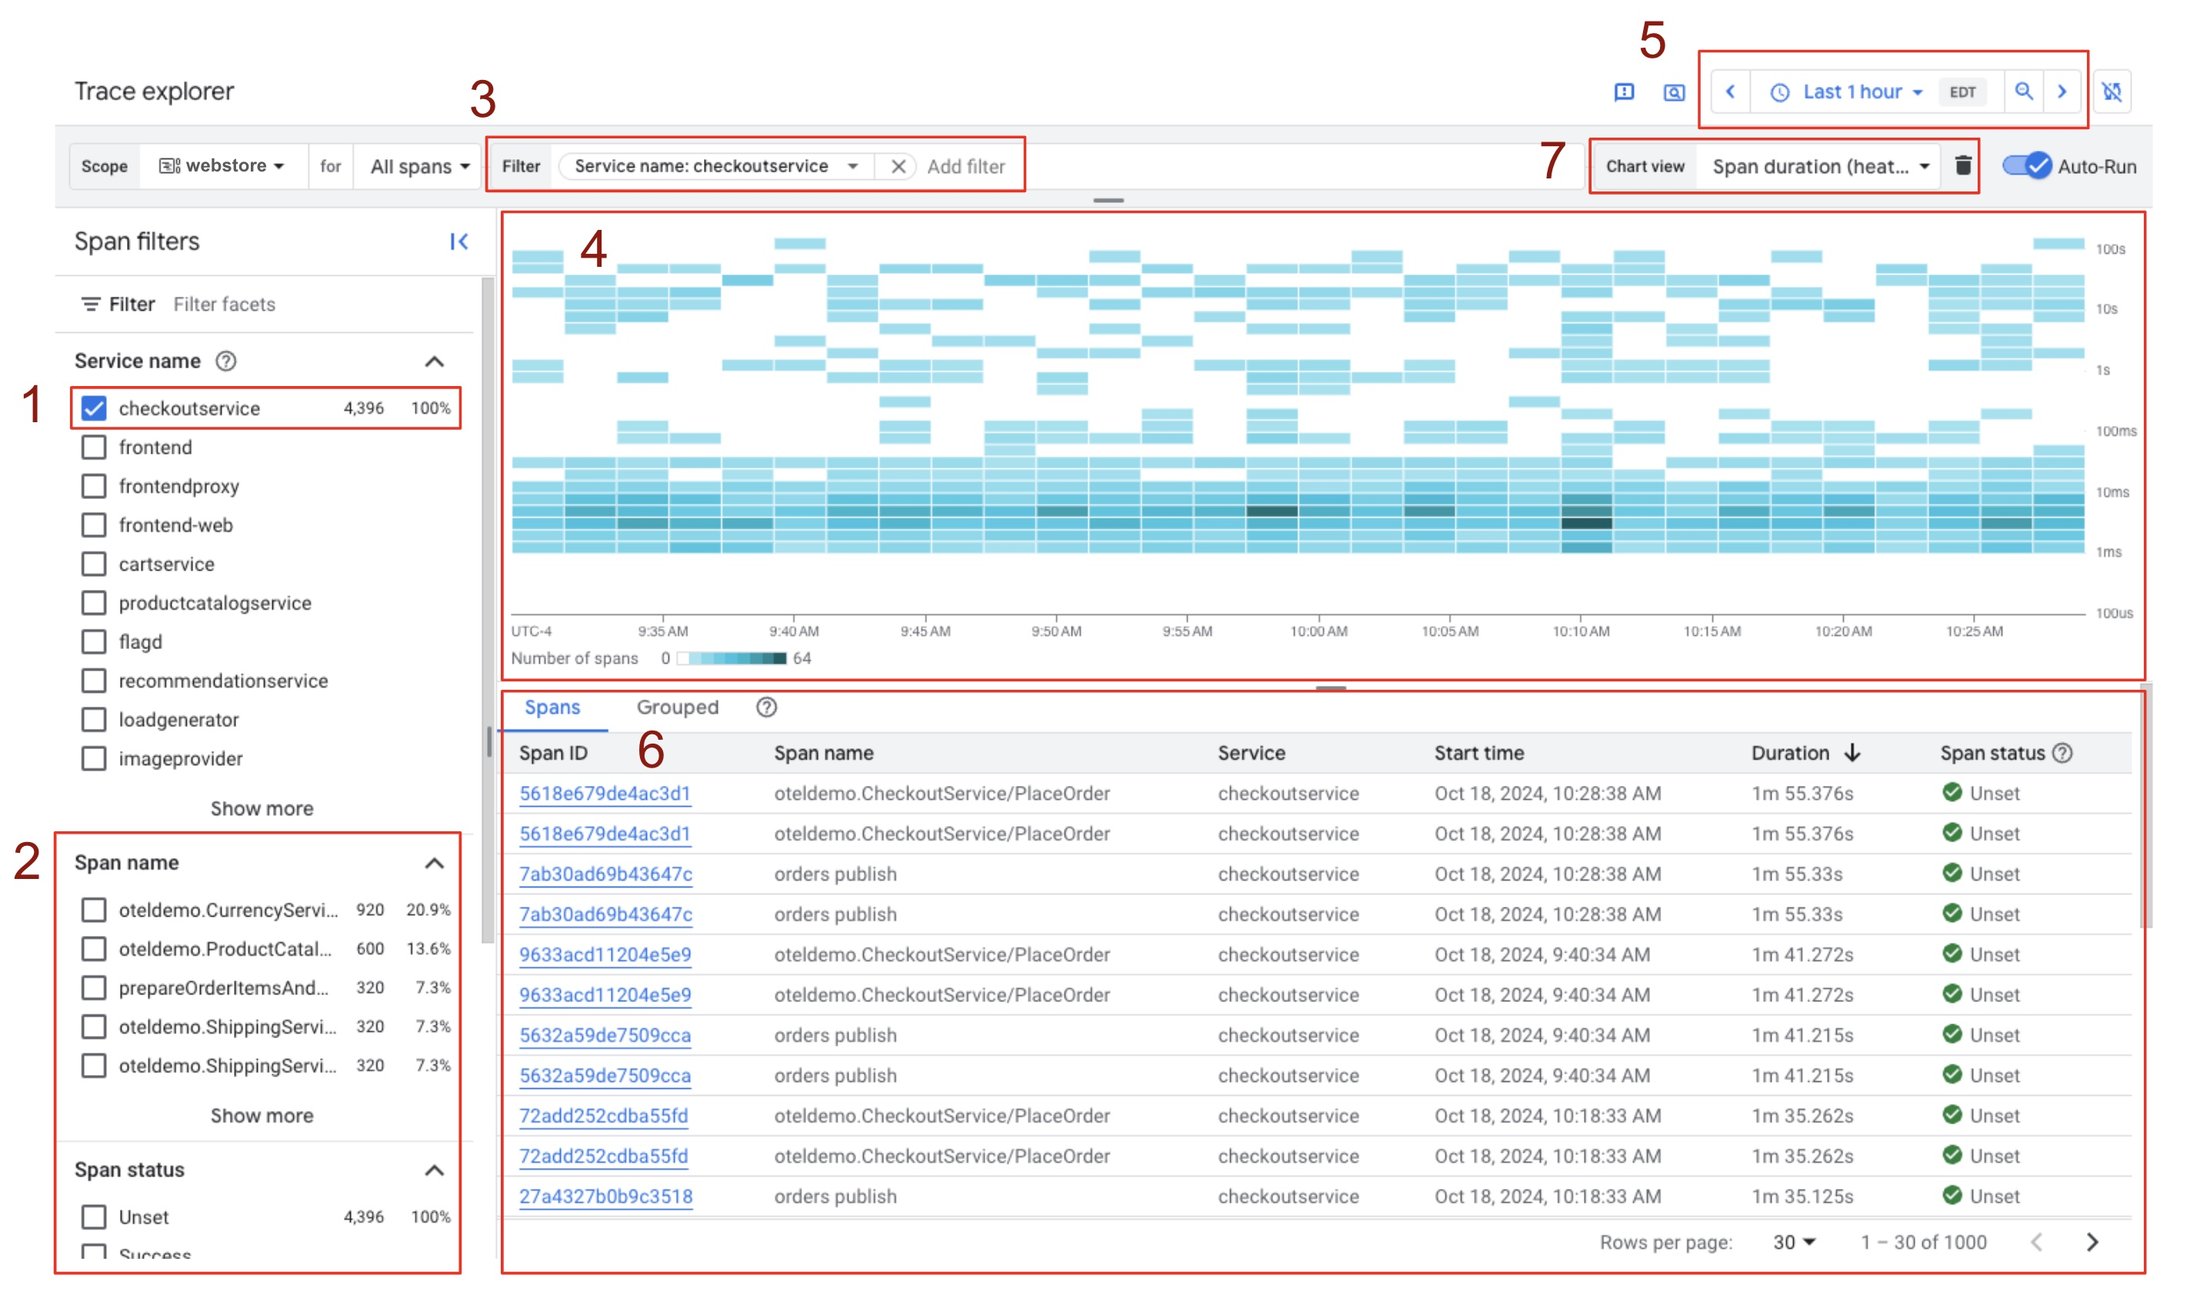
You select checkoutservice in Span filters (1) and the following updates load on the page:
-
Other sections such as Span name in the span filter pane (2) are updated with counts and percentages that take into account the selection made under service name. This can help you narrow down your search criteria to be more specific.
-
The span Filter bar (3) is updated to display the active filter.
-
The heatmap visualization (4) is updated to only display spans from the checkoutservice in the last 1 hour (default). You can change the time-range using the time-picker (5). The heatmap’s x-axis is time and the y-axis is span duration. It uses color shades to denote the number of spans in each cell with a legend that indicates the corresponding range.
-
The Spans table (6) is updated with matching spans sorted by duration (default).
-
Other Chart views (7) that you can switch to are also updated with the applied filter.
From looking at the heatmap, you can see that there are some spans in the >100s range which is abnormal and concerning. But first, you’re curious about the traffic and corresponding latency of calls handled by the checkoutservice.
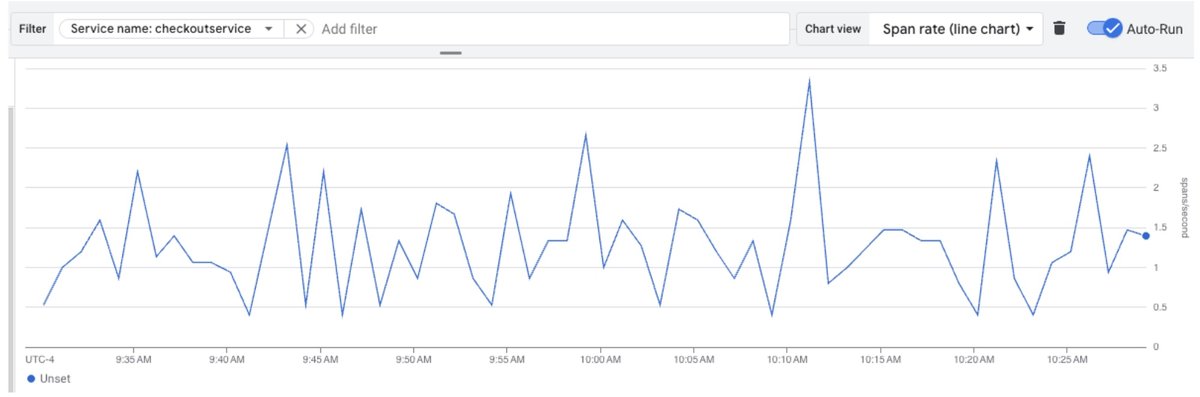
Switching to the Span rate line chart gives you an idea of the traffic handled by your service. The x-axis is time and the y-axis is spans/second. The traffic handled by your service looks normal as you know from past experience that 1.5-2 spans/second is quite typical.
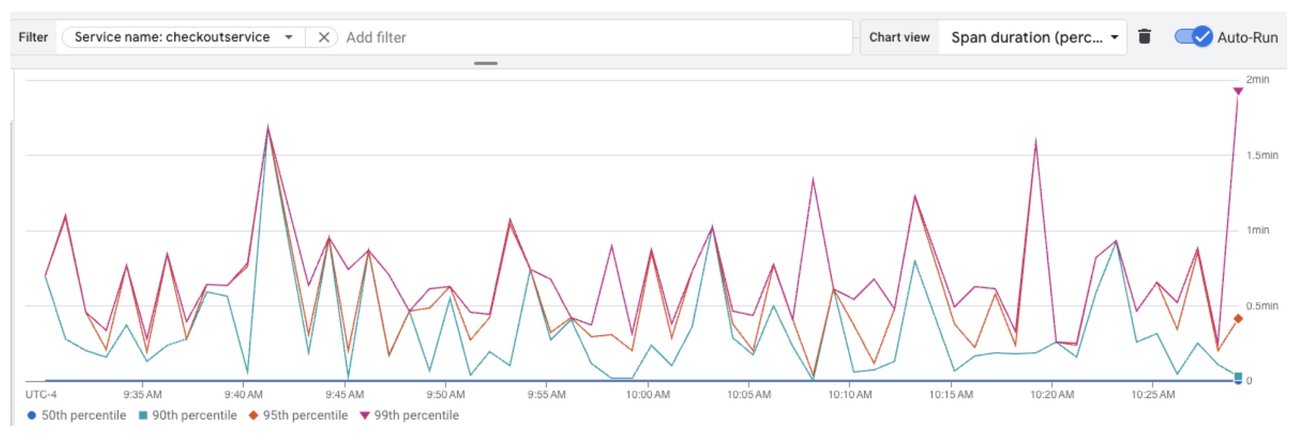
Switching to the Span duration percentile chart gives you p50/p90/p95/p99 span duration trends. While p50 looks fine, the p9x durations are greater than you expect for your service.
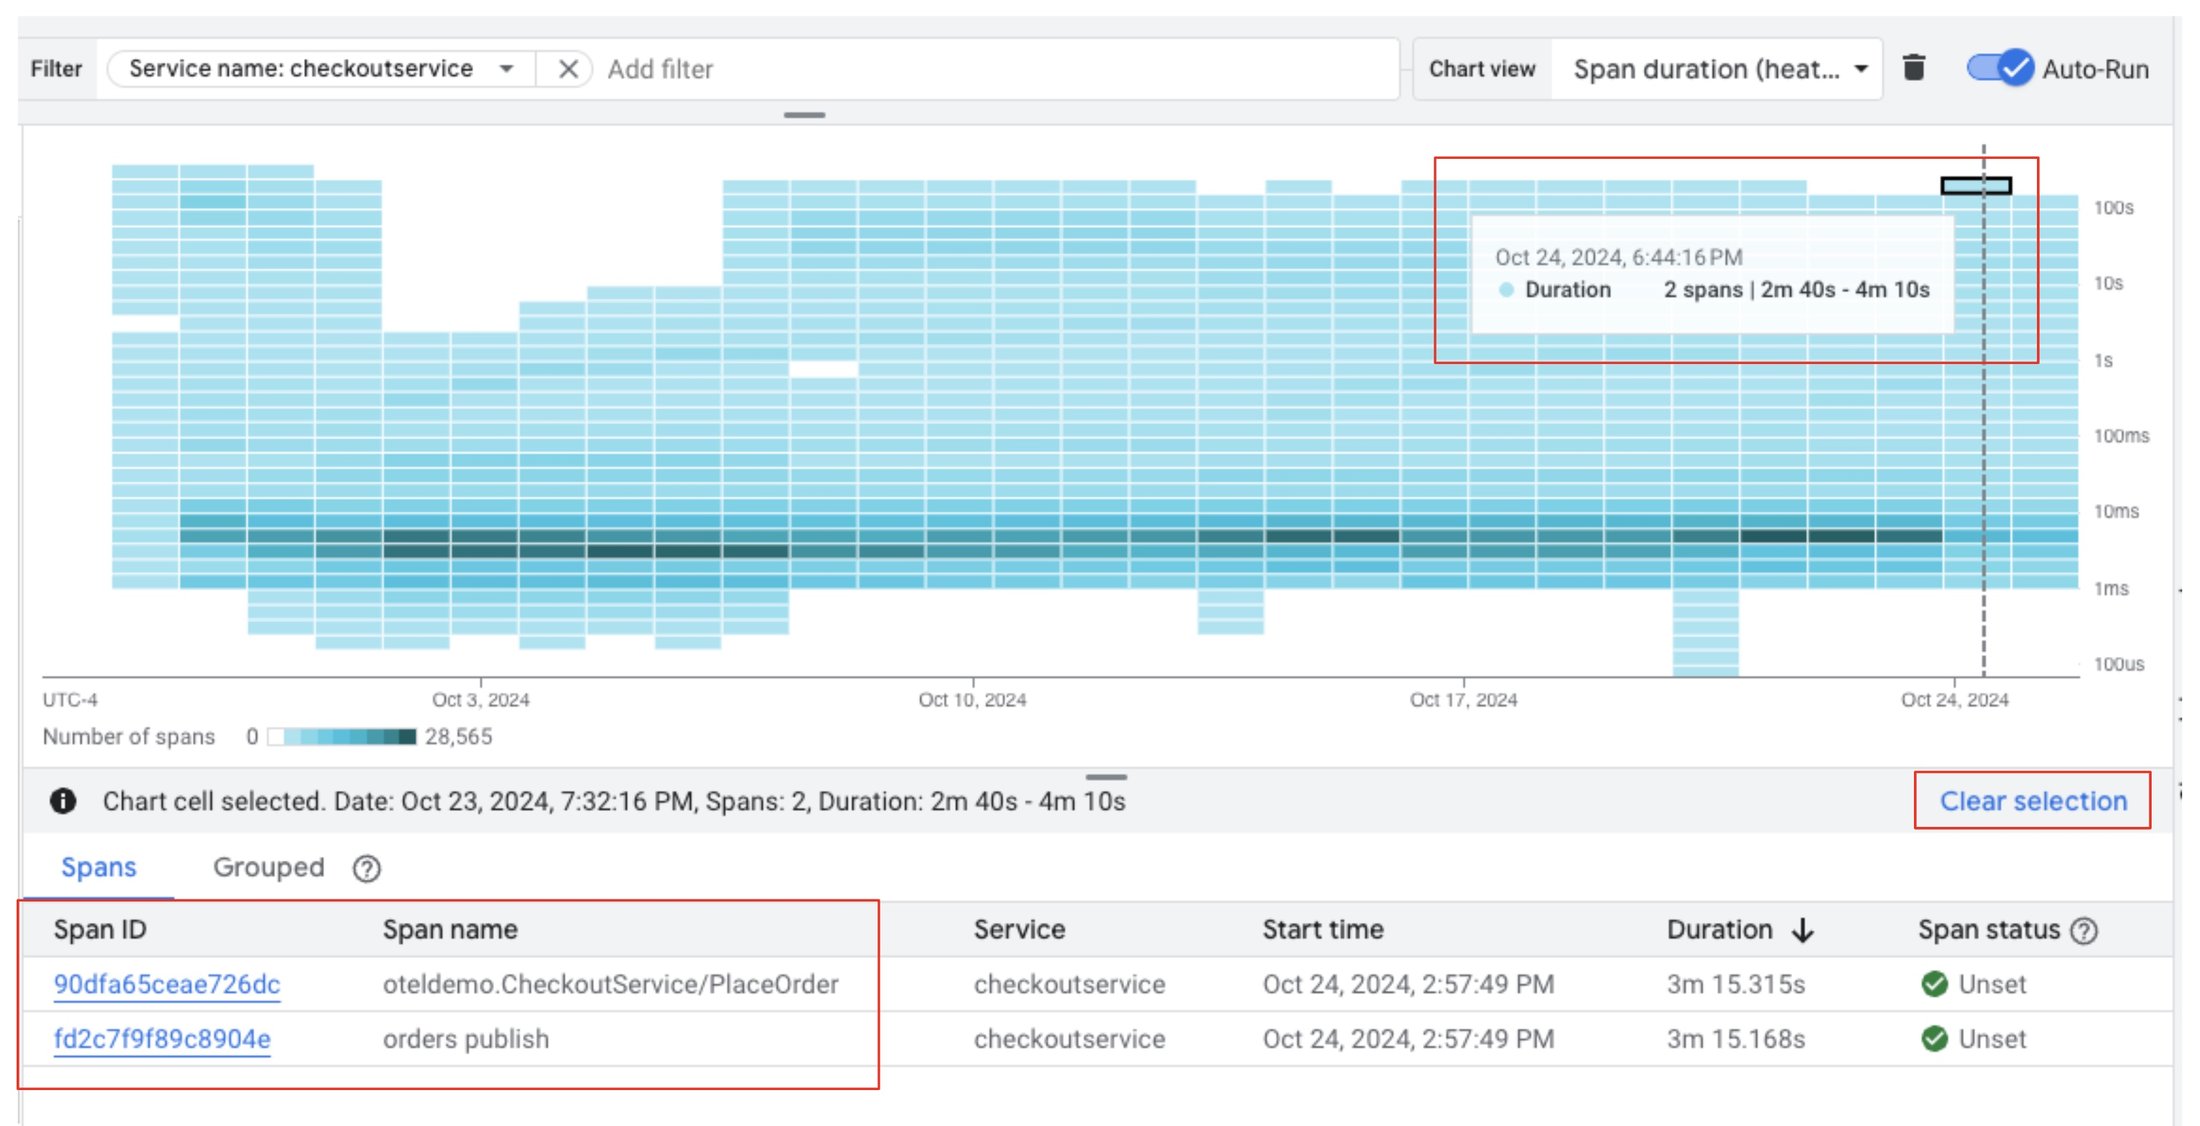
You switch back to the heatmap chart and select one of the outlier cells to investigate further. This particular cell has two matching spans with a duration of over 2 minutes, which is concerning.
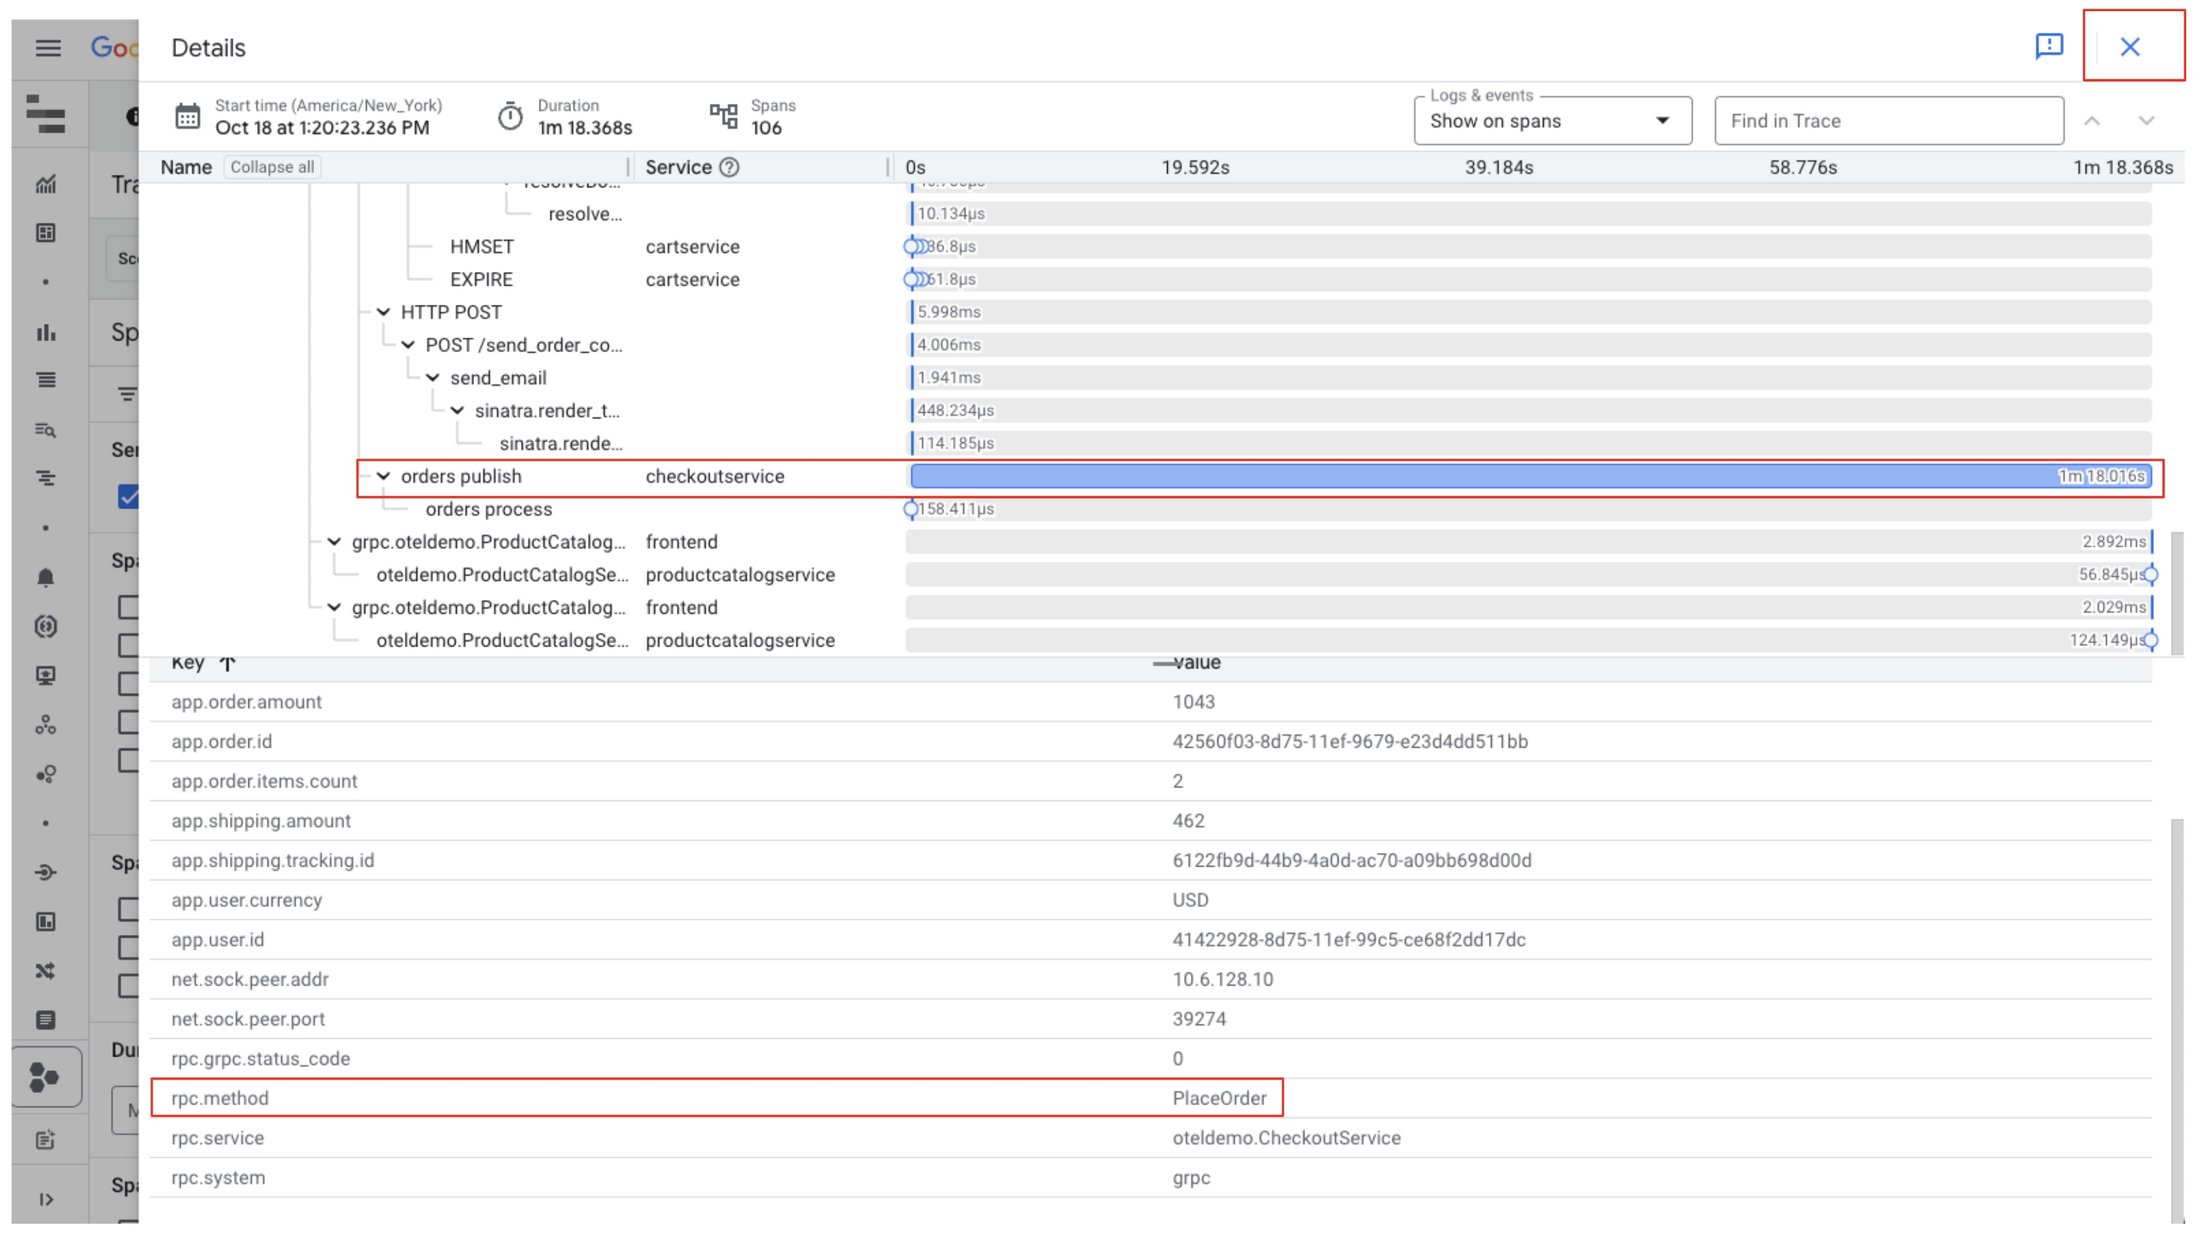
You investigate one of those spans by viewing the full trace and notice that the orders publish span is the one taking up the majority of the time when servicing this request. Given this, you form a hypothesis that the checkoutservice is having issues handling these types of calls. To validate your hypothesis, you note the rpc.method attribute being PlaceOrder and exit this trace using the X button.
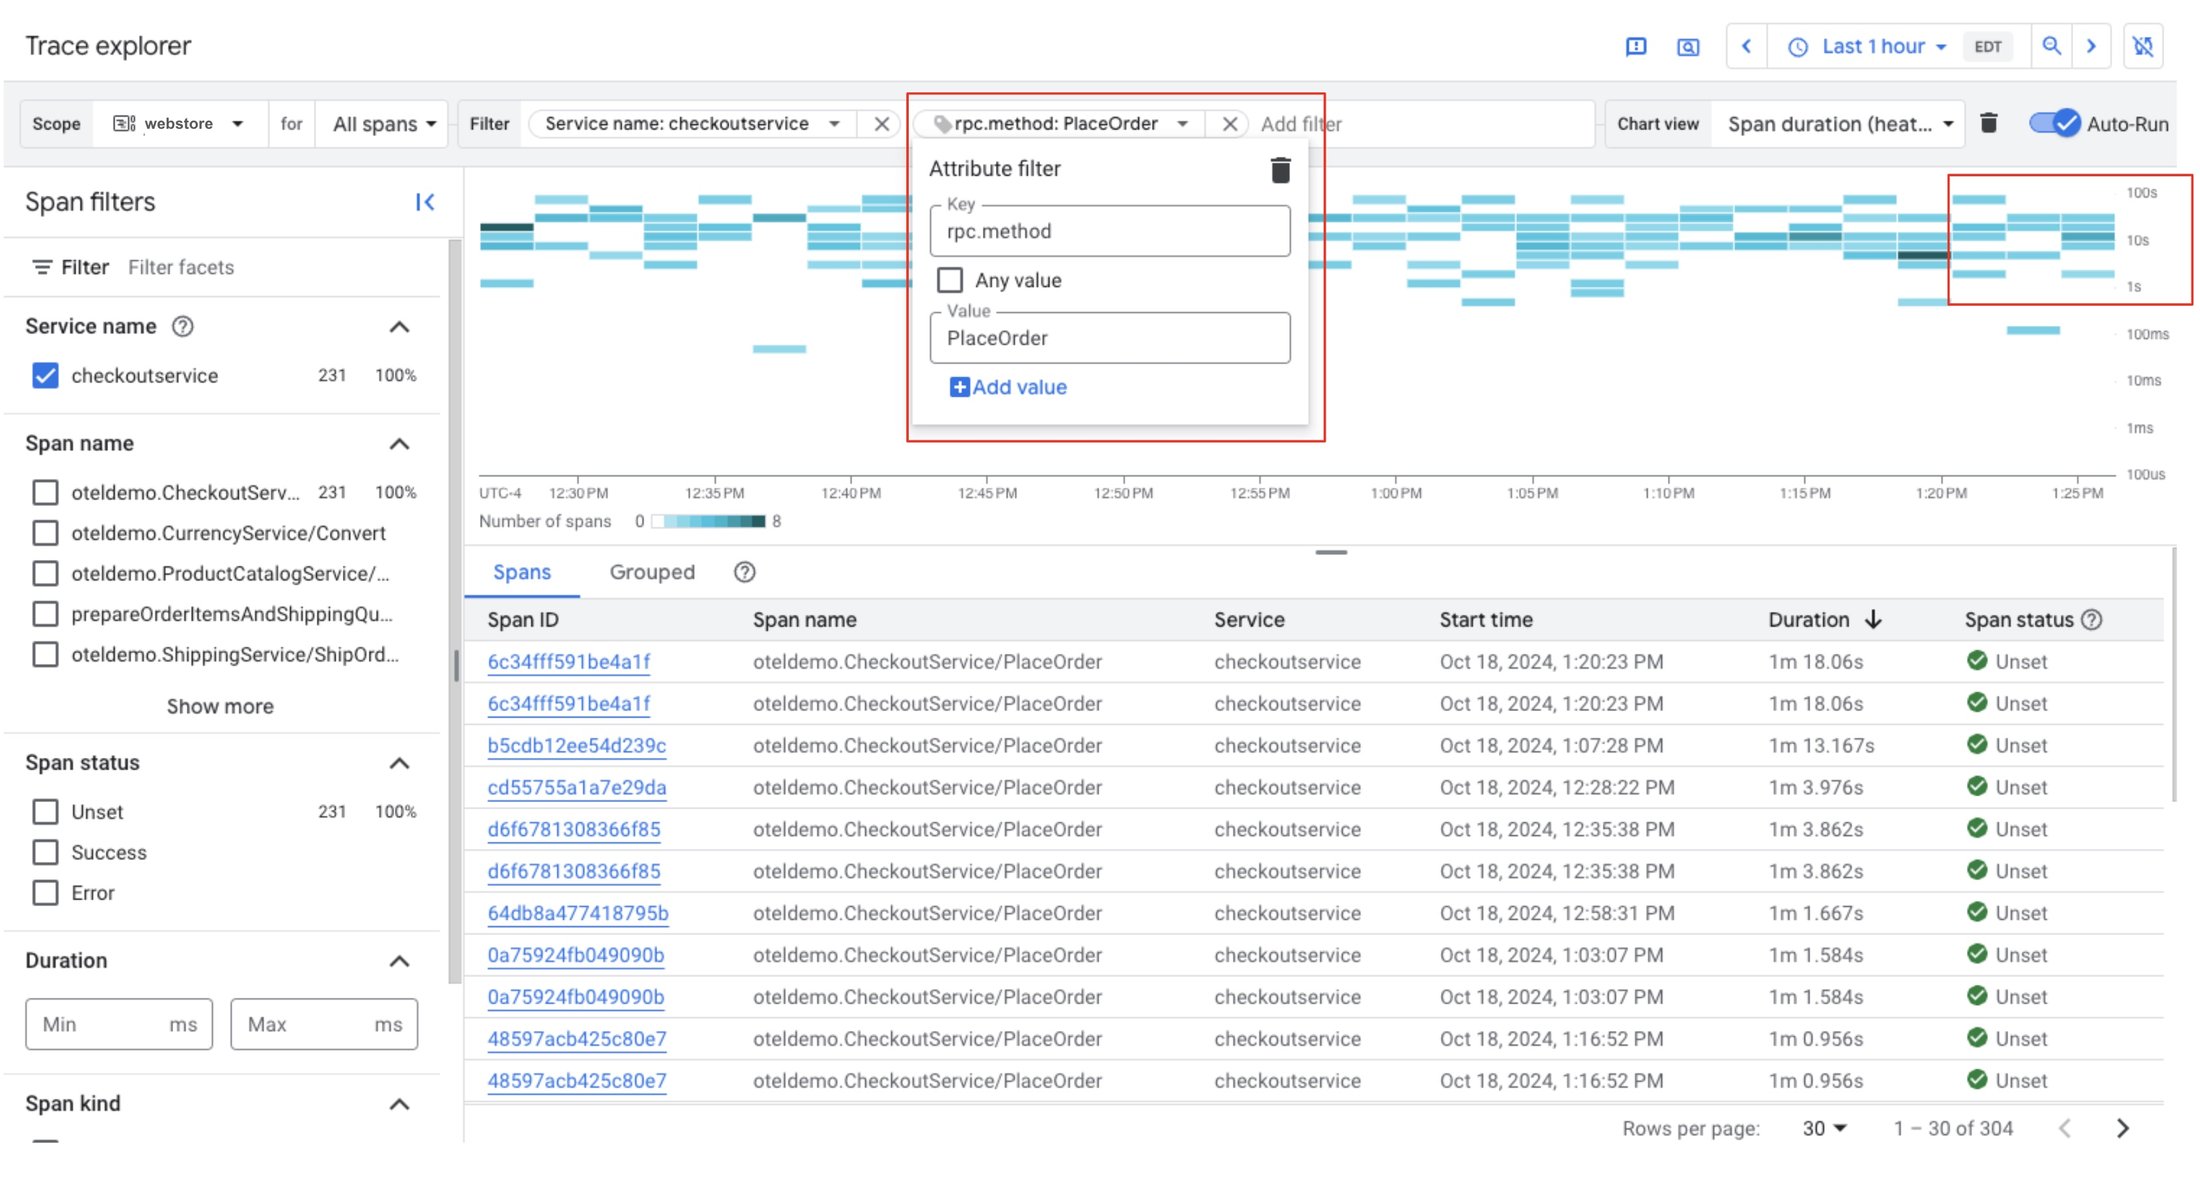
You add an attribute filter for key: rpc.method value:PlaceOrder using the Filter bar, which shows you that there is a clear latency issue with PlaceOrder calls handled by your service. You’ve seen this issue before and know that there is a runbook that addresses it, so you alert the SRE team with the appropriate action that needs to be taken to mitigate the incident.
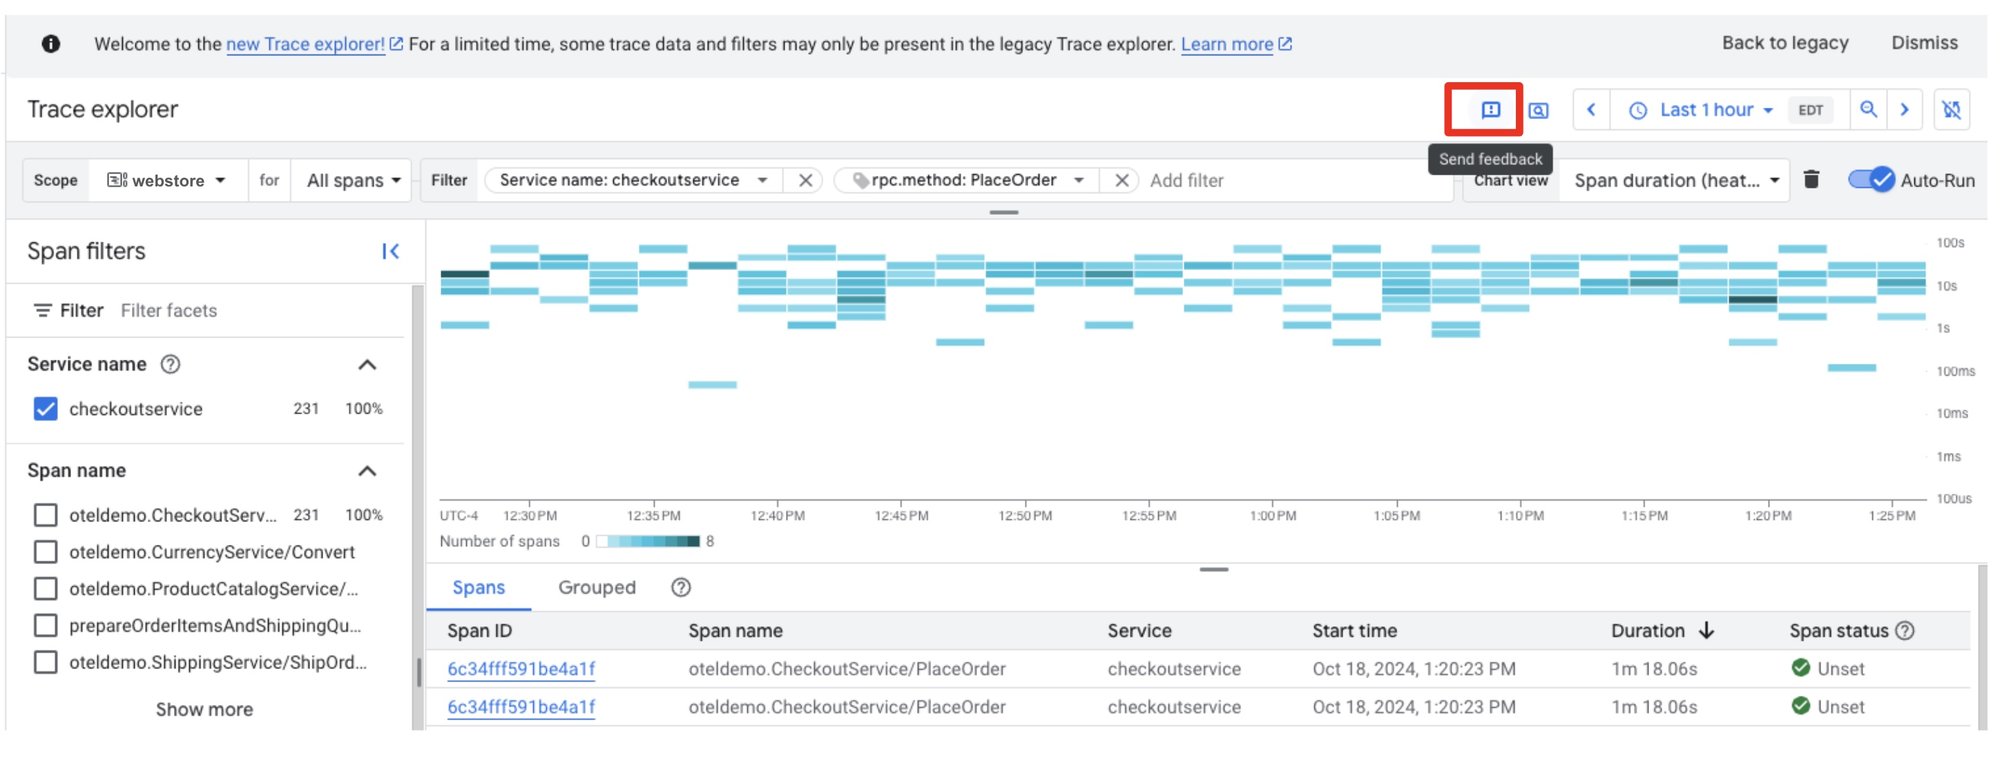
Share your feedback with us via the Send feedback button.
Behind the scenes
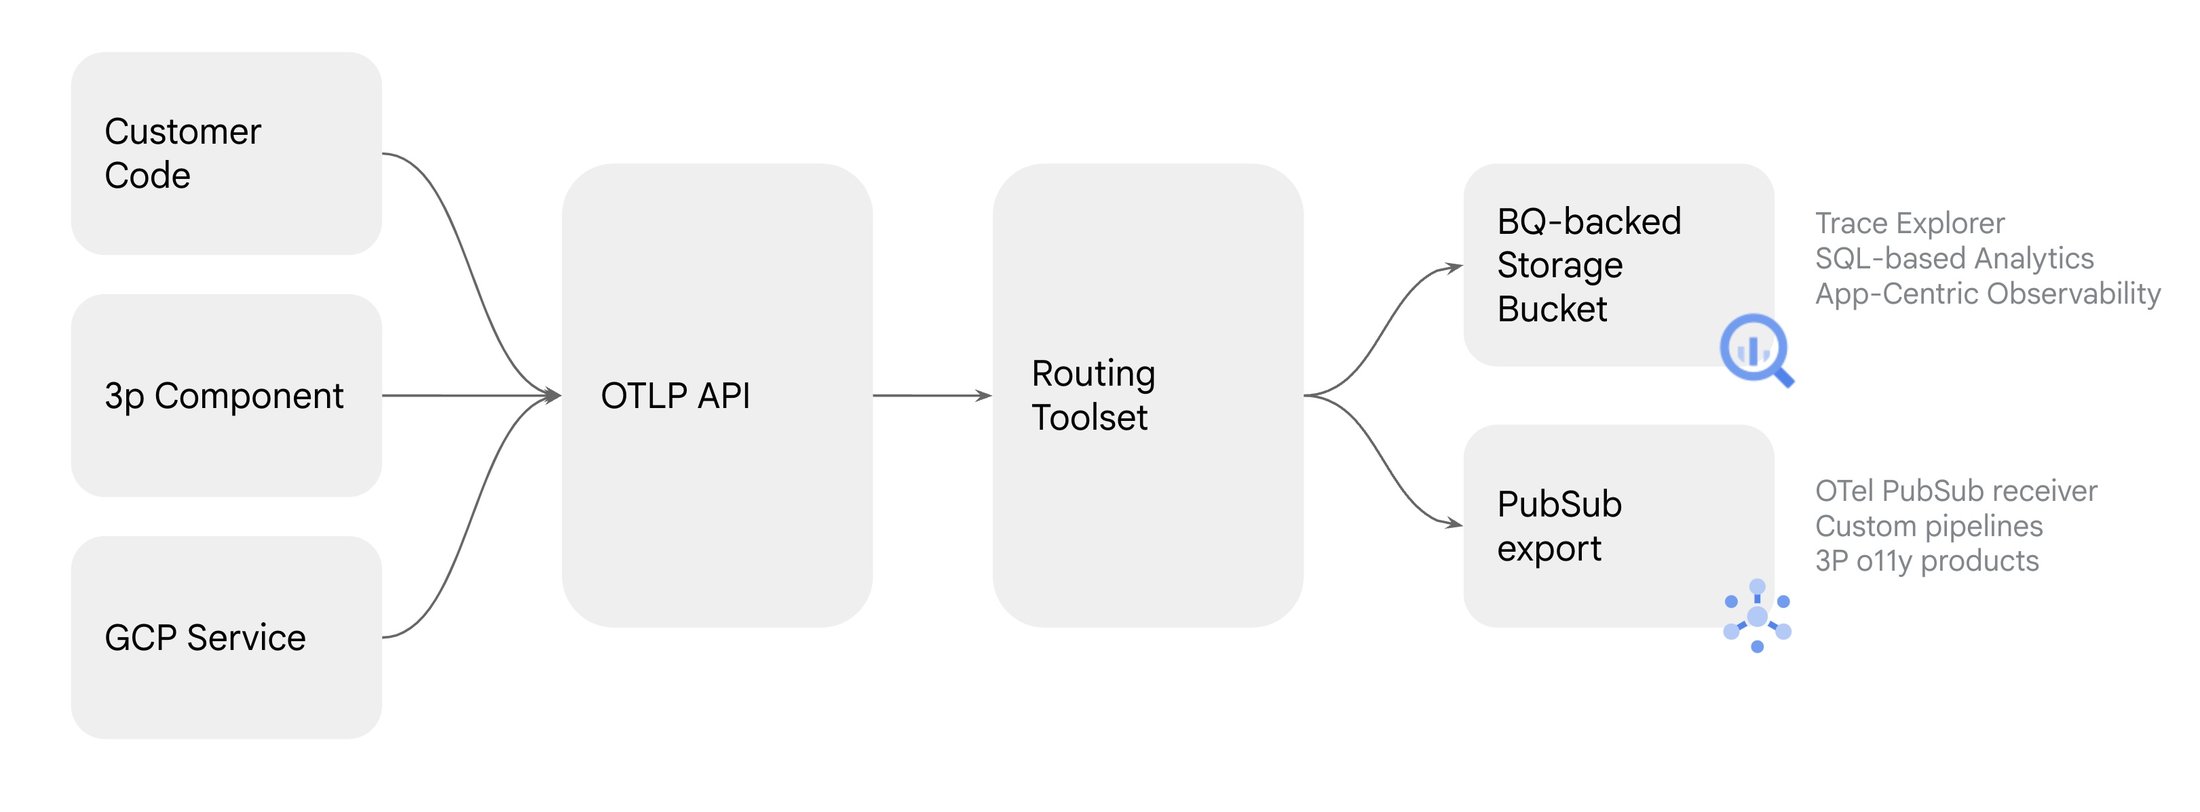
This new experience is powered by BigQuery, using the same platform that backs Log Analytics. We plan to launch new features that take full advantage of this platform: SQL queries, flexible sampling, export, and regional storage.
In summary, you can use the new Cloud Trace explorer to perform service-oriented investigations with advanced querying and visualization of trace data. This allows developers and SREs to effectively troubleshoot production incidents and identify mitigating measures to restore normal operations.
The new Cloud Trace explorer is generally available to all users — try it out and share your feedback with us via the Send feedback button.