排解 API 和服務延遲時間異常升高的疑難問題
本文將簡要說明偵錯程序,協助您瞭解 Google Cloud 控制台中的「API 和服務」使用情況,以及延遲尖峰。
首先,請按照下列步驟找出延遲時間較長的對話 ID:
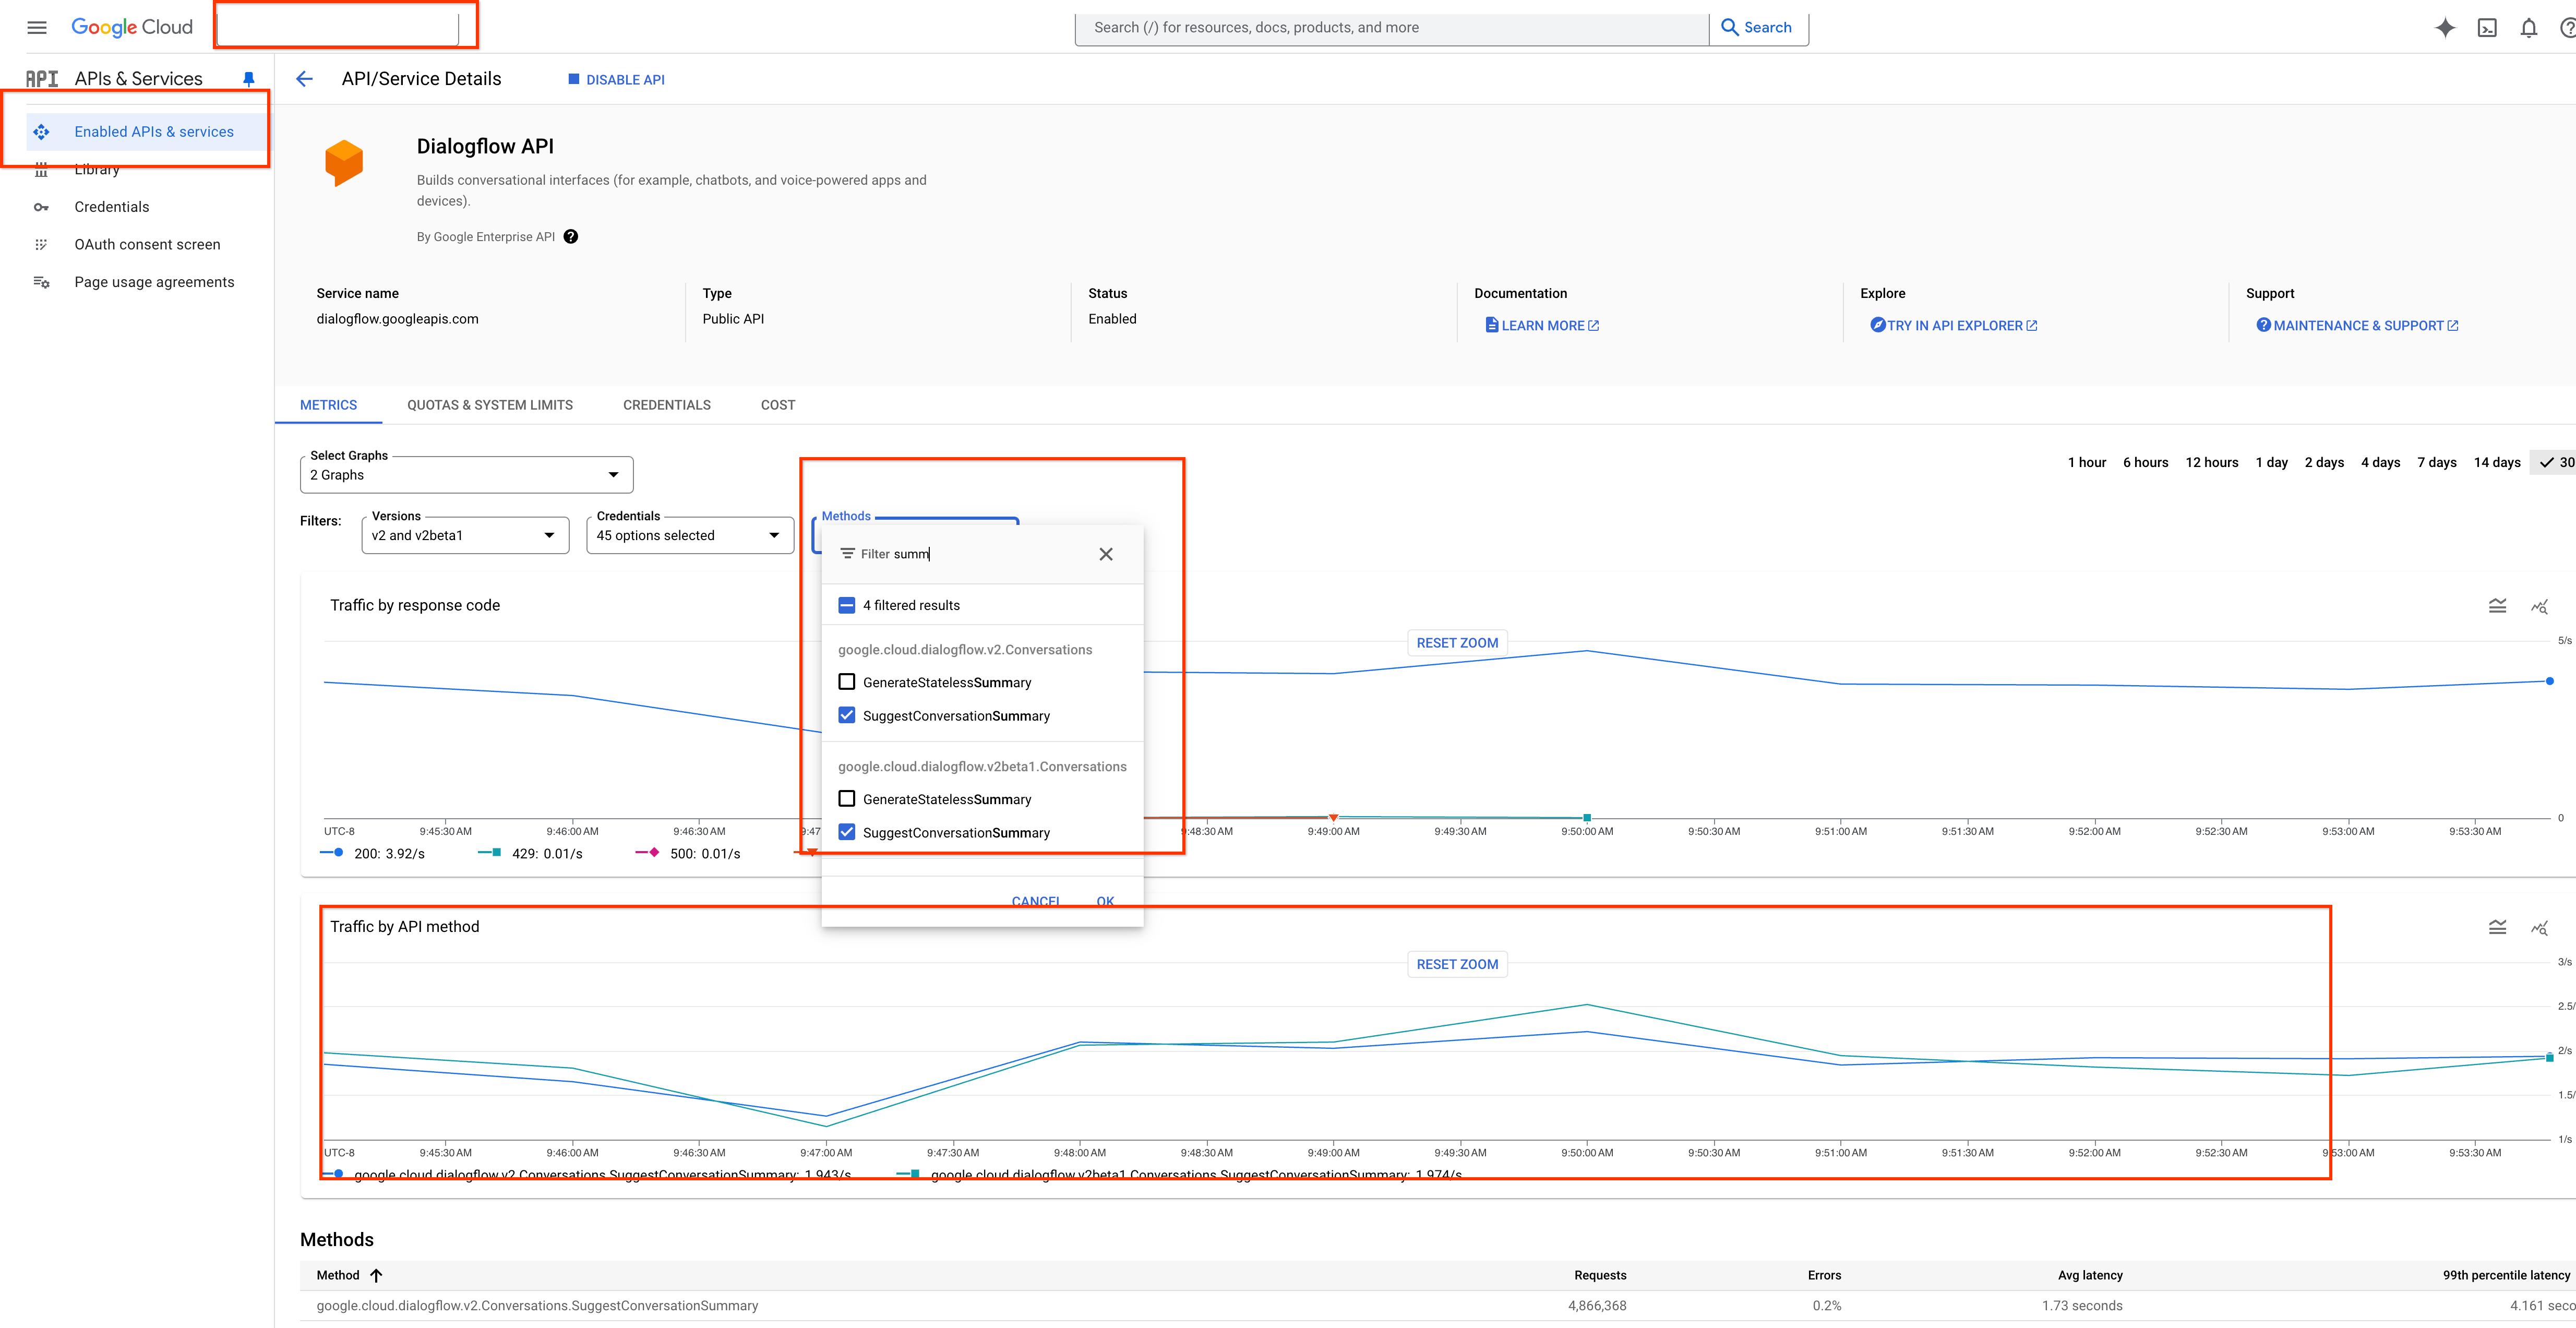
- 開啟 Google Cloud 控制台,然後前往「API 和服務」。
- 按一下「已啟用的 API 和服務」。
- 前往「指標」,然後選取「方法」下的「API 方法」。
系統會顯示延遲時間流量圖表,並標示為「依 API 方法顯示流量」。
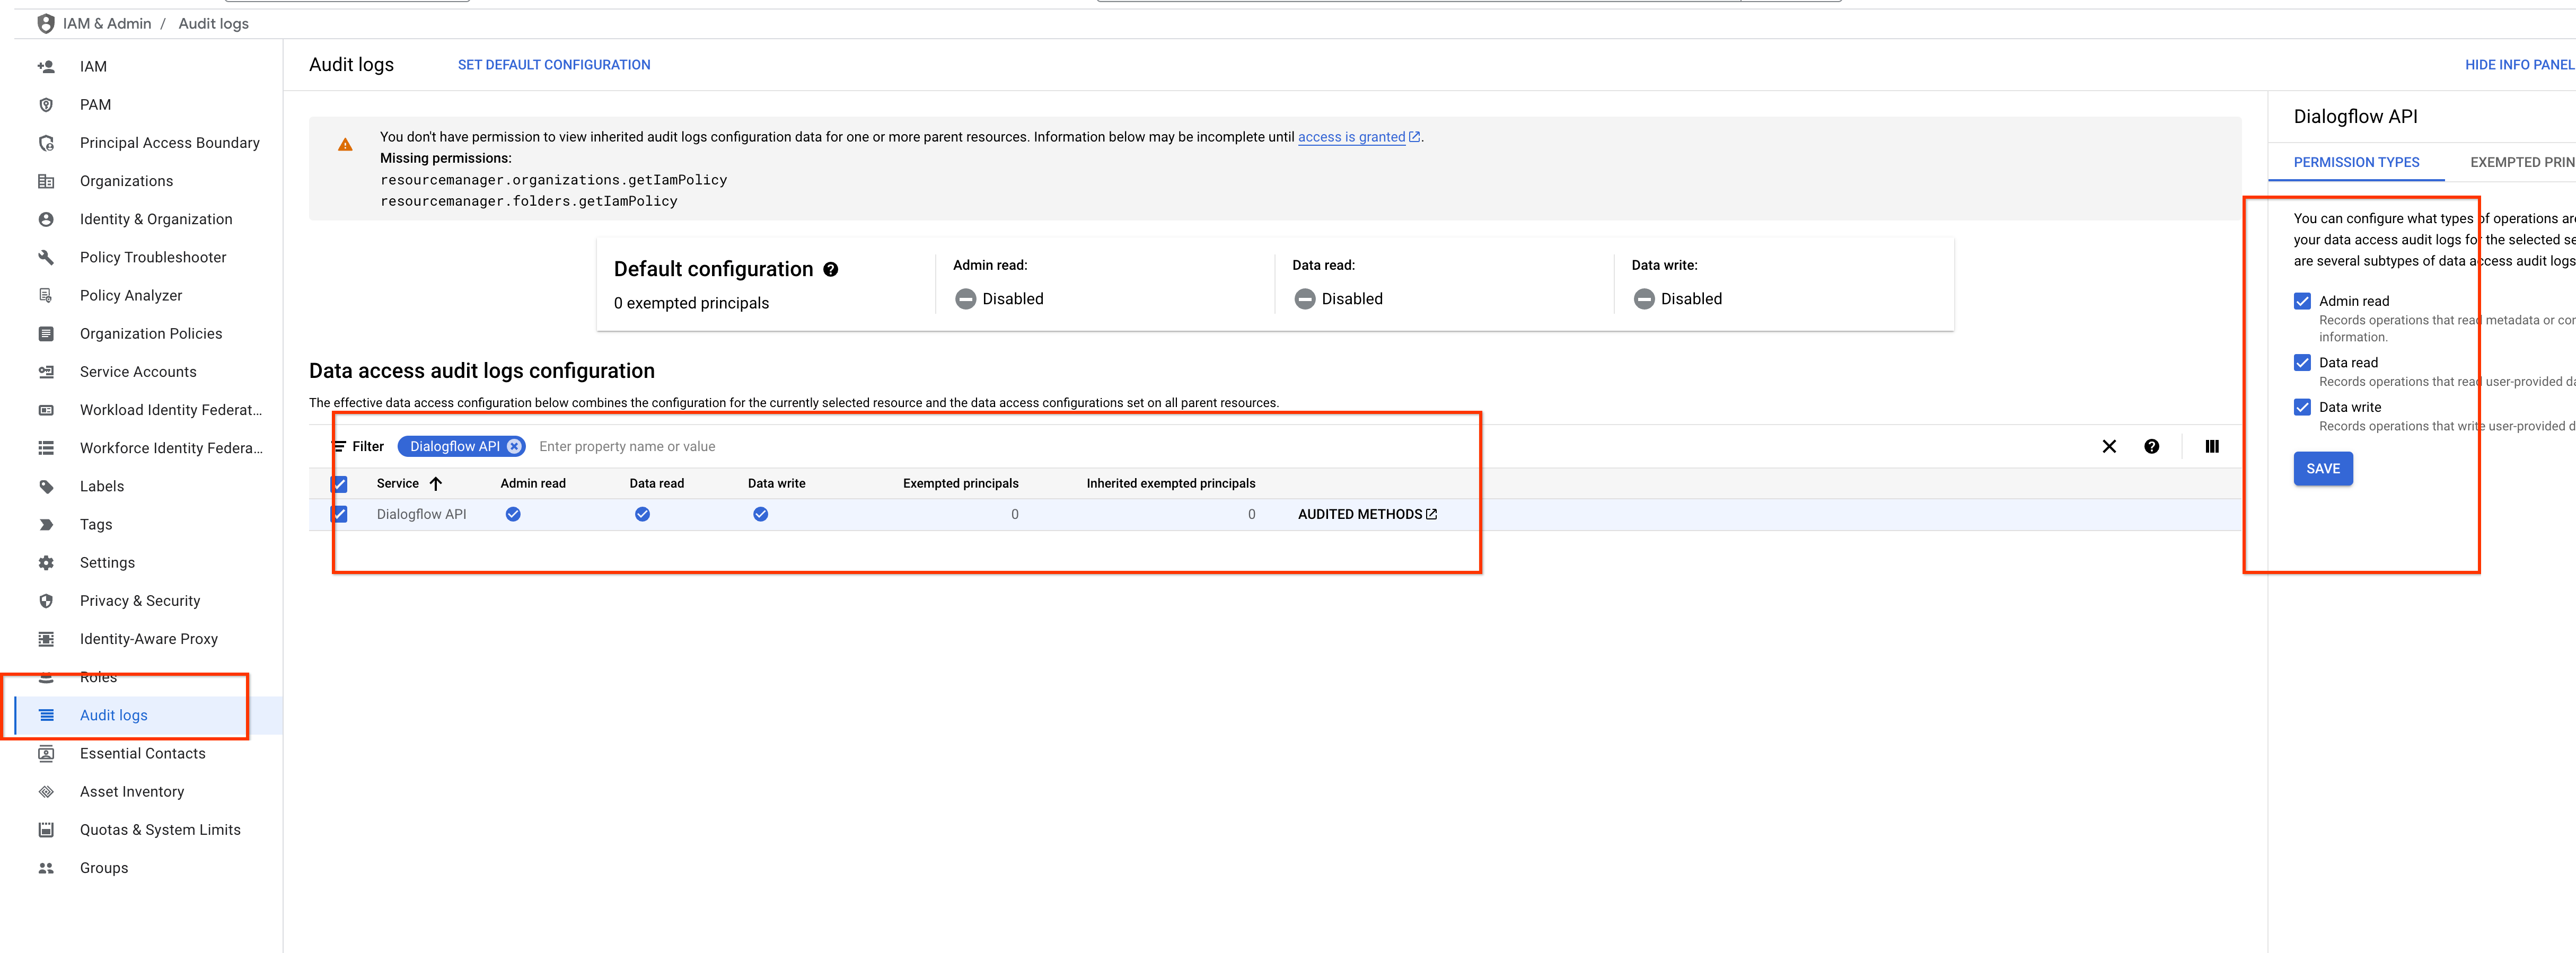
接著,請確認您已啟用稽核記錄。
- 前往「稽核記錄」。
- 勾選「管理員讀取」、「資料讀取」和「資料寫入」選項。
- 按一下 [儲存]。
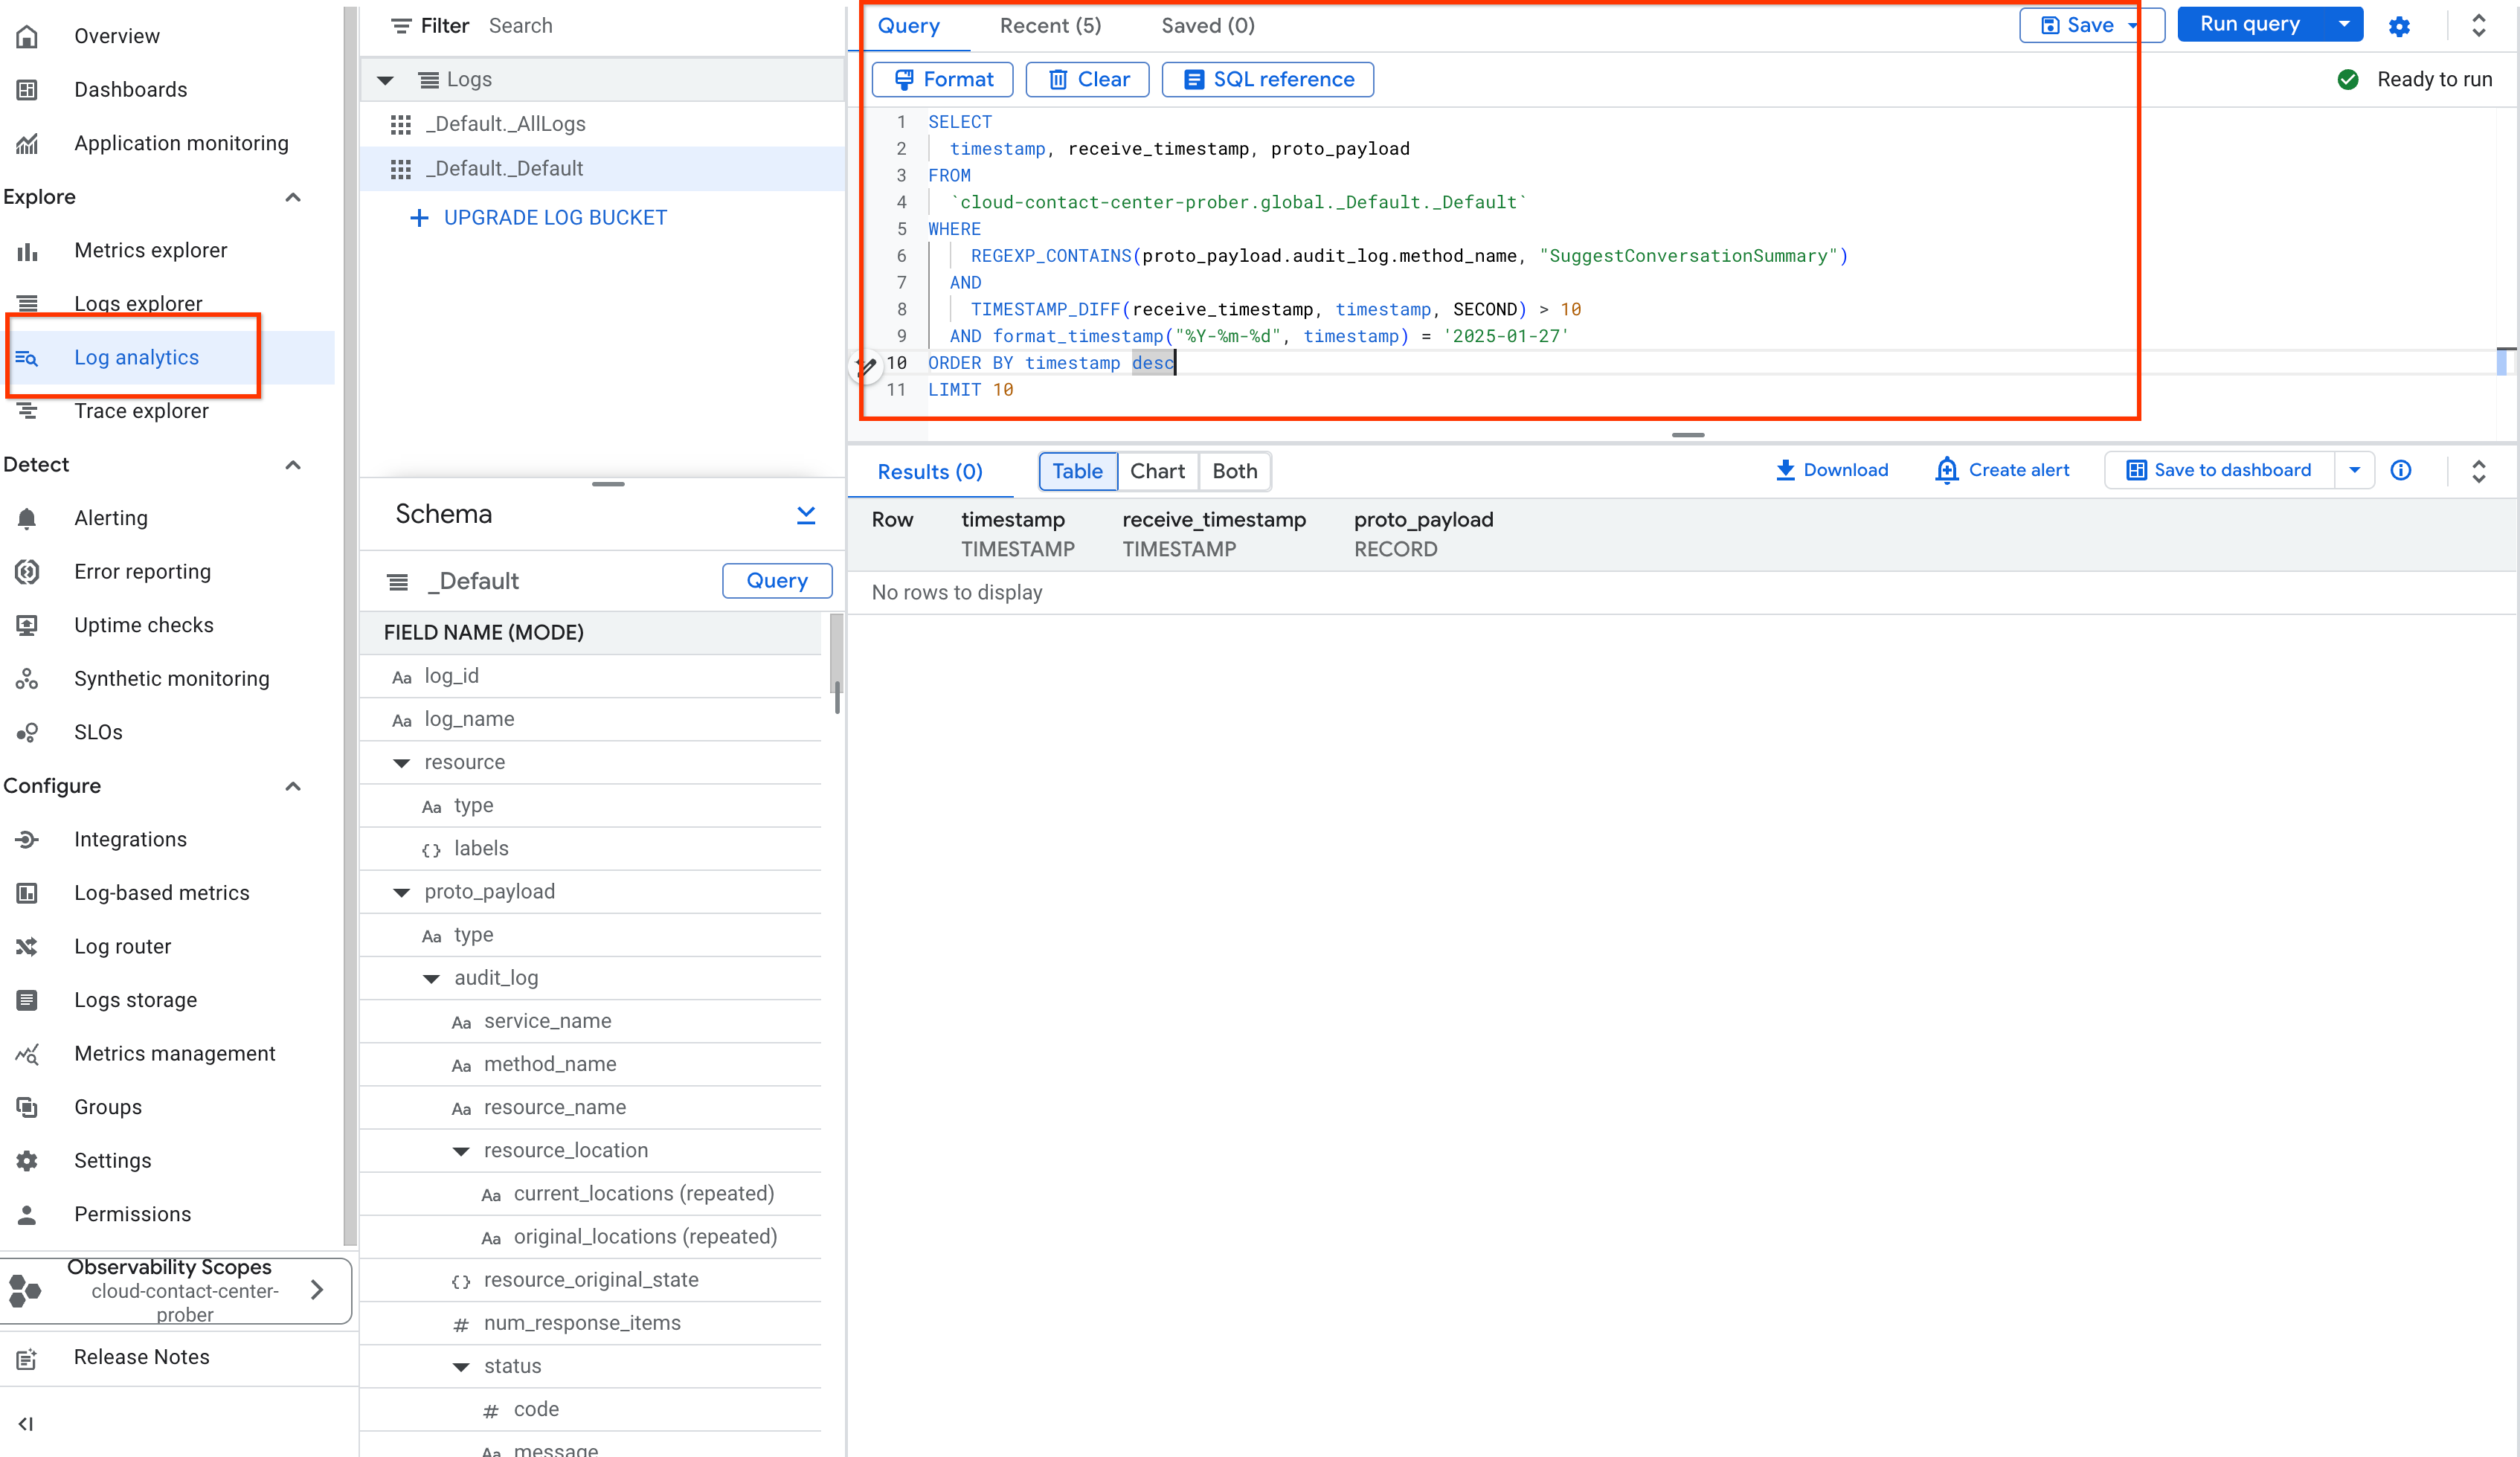
接著,在 Log analytics 中找出延遲時間超過特定值的對話 ID。舉例來說,在下方的螢幕截圖中,您可以看到特定日期的對話時間長度超過 10 秒。
- 前往「記錄檔分析」。
- 提供 TIMESTAMP_DIFF 的時間。
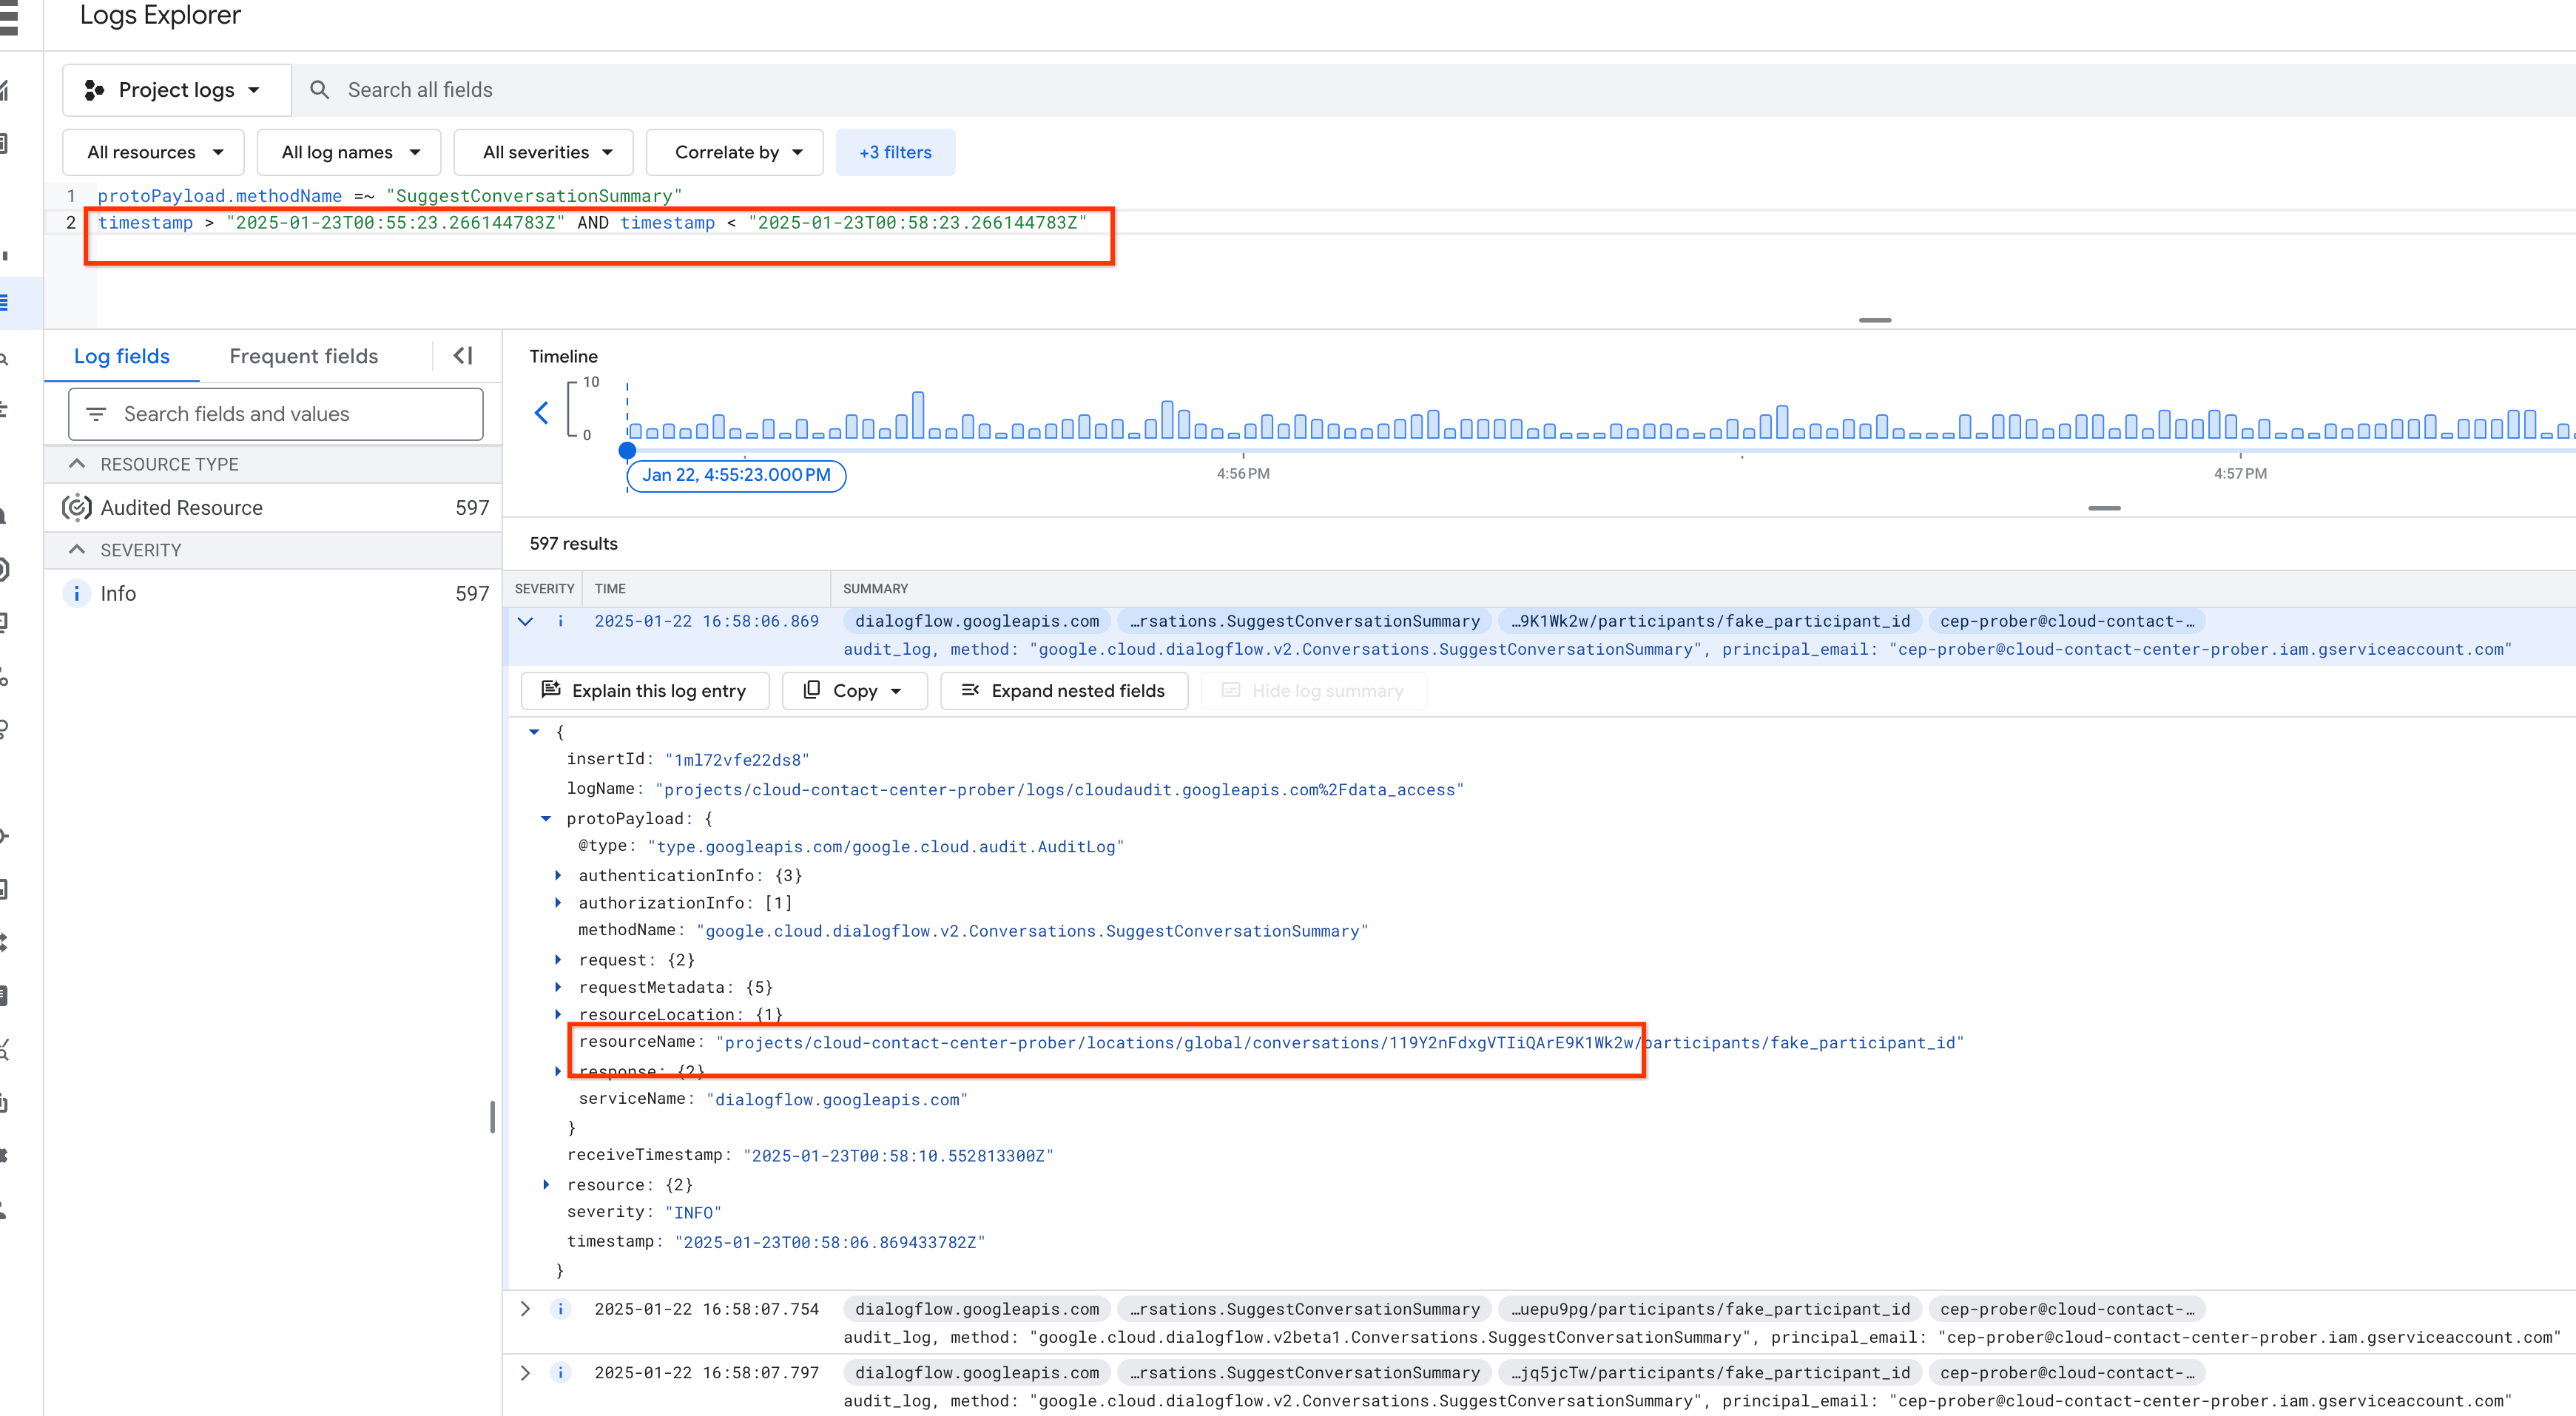
你也可以使用時間戳記,在 Log explorer 中找出特定時間範圍內的特定對話。
- 在 protoPayload.methodName 中輸入方法名稱。
- 在「時間戳記」中輸入時間範圍。
- 在「記錄欄位」中查看結果。
完成上述所有步驟後,您就能存取任何已啟用 Cloud Logging 的 Agent Assist API。
除非另有註明,否則本頁面中的內容是採用創用 CC 姓名標示 4.0 授權,程式碼範例則為阿帕契 2.0 授權。詳情請參閱《Google Developers 網站政策》。Java 是 Oracle 和/或其關聯企業的註冊商標。
上次更新時間:2025-10-19 (世界標準時間)。
[[["容易理解","easyToUnderstand","thumb-up"],["確實解決了我的問題","solvedMyProblem","thumb-up"],["其他","otherUp","thumb-up"]],[["難以理解","hardToUnderstand","thumb-down"],["資訊或程式碼範例有誤","incorrectInformationOrSampleCode","thumb-down"],["缺少我需要的資訊/範例","missingTheInformationSamplesINeed","thumb-down"],["翻譯問題","translationIssue","thumb-down"],["其他","otherDown","thumb-down"]],["上次更新時間:2025-10-19 (世界標準時間)。"],[],[]]