Risoluzione dei problemi relativi a picchi di latenza di API e servizi
Mantieni tutto organizzato con le raccolte
Salva e classifica i contenuti in base alle tue preferenze.
Questo documento fornisce una panoramica della procedura di debug per comprendere l'utilizzo di API e servizi nella console Google Cloud e anche il picco di latenza.
Innanzitutto, segui questi passaggi per identificare gli ID conversazione con latenza elevata:
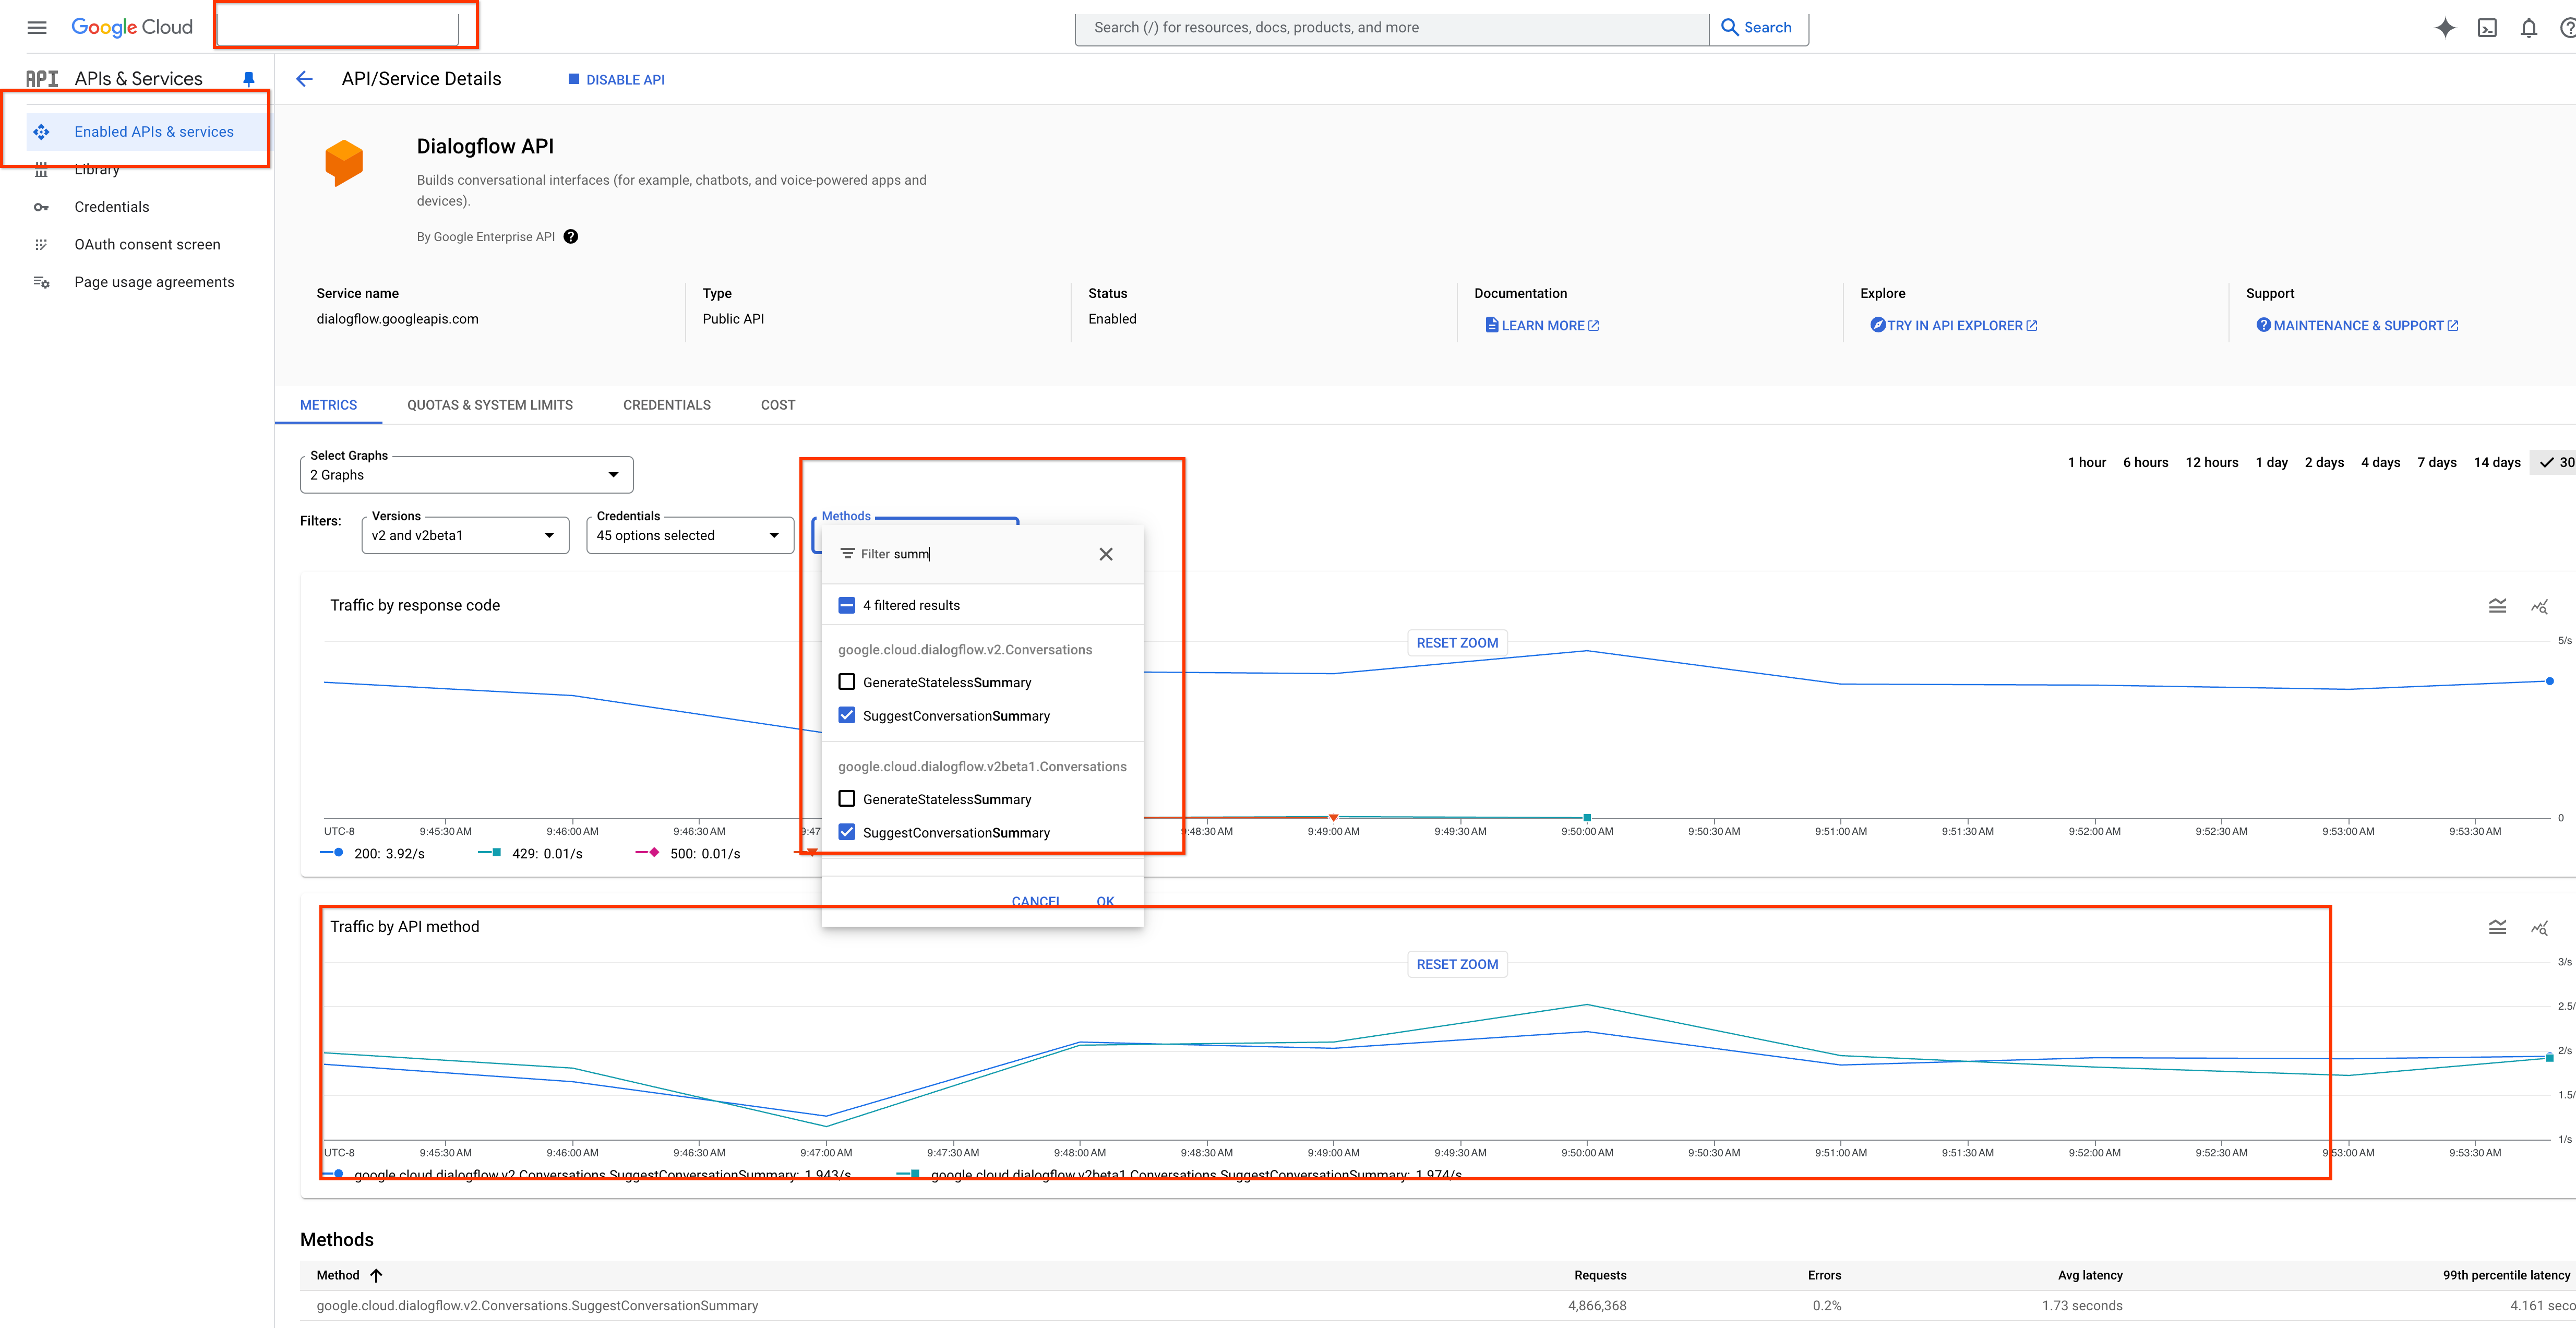
Viene visualizzato il grafico del traffico di latenza, etichettato Traffico per metodo API.
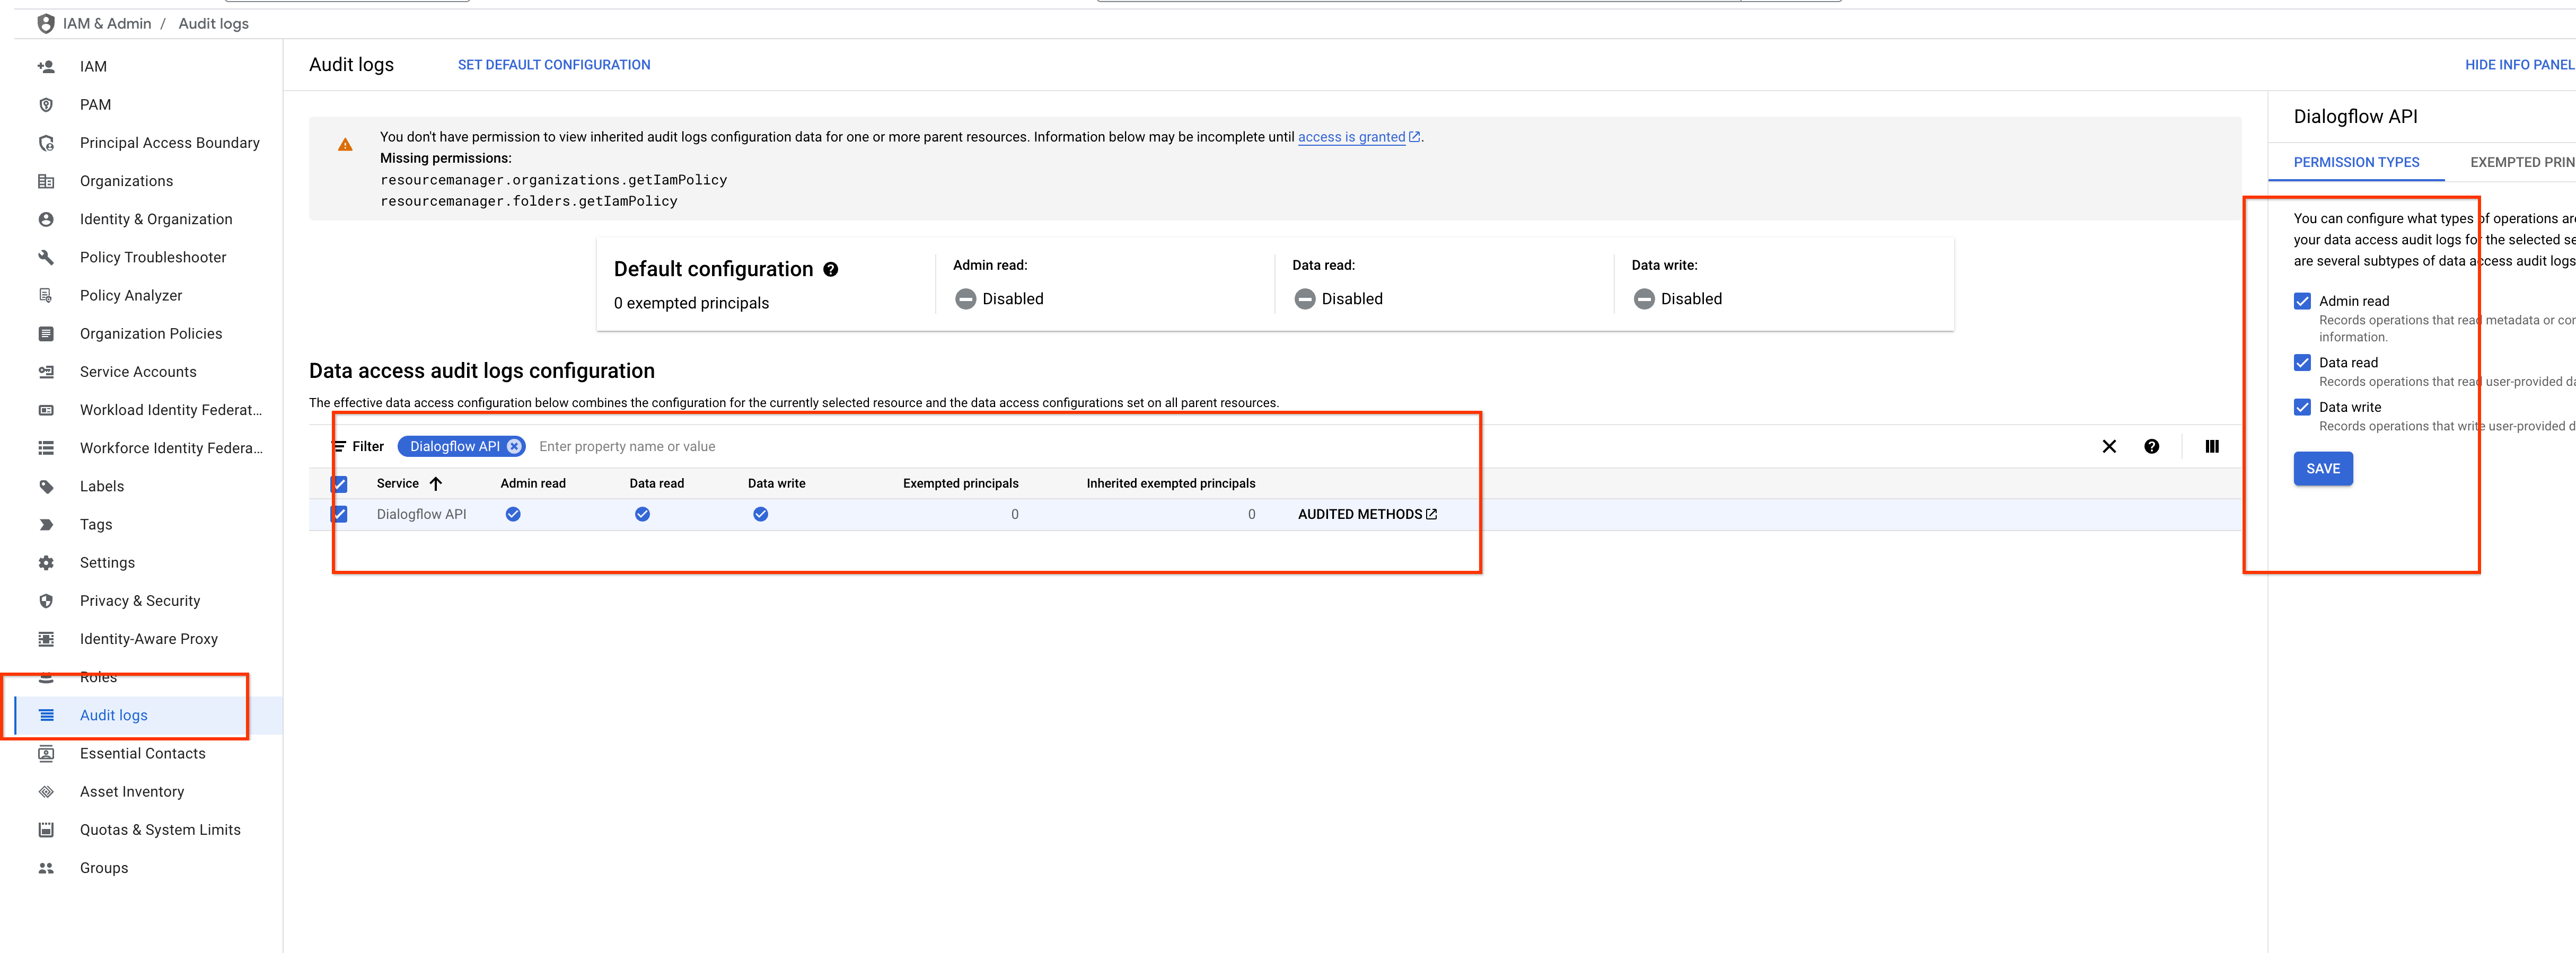
Il passaggio successivo consiste nell'assicurarti di abilitare gli audit log.
Vai a Audit log.
Seleziona le opzioni Lettura amministratore, Lettura dati e Scrittura dati.
Fai clic su Salva.
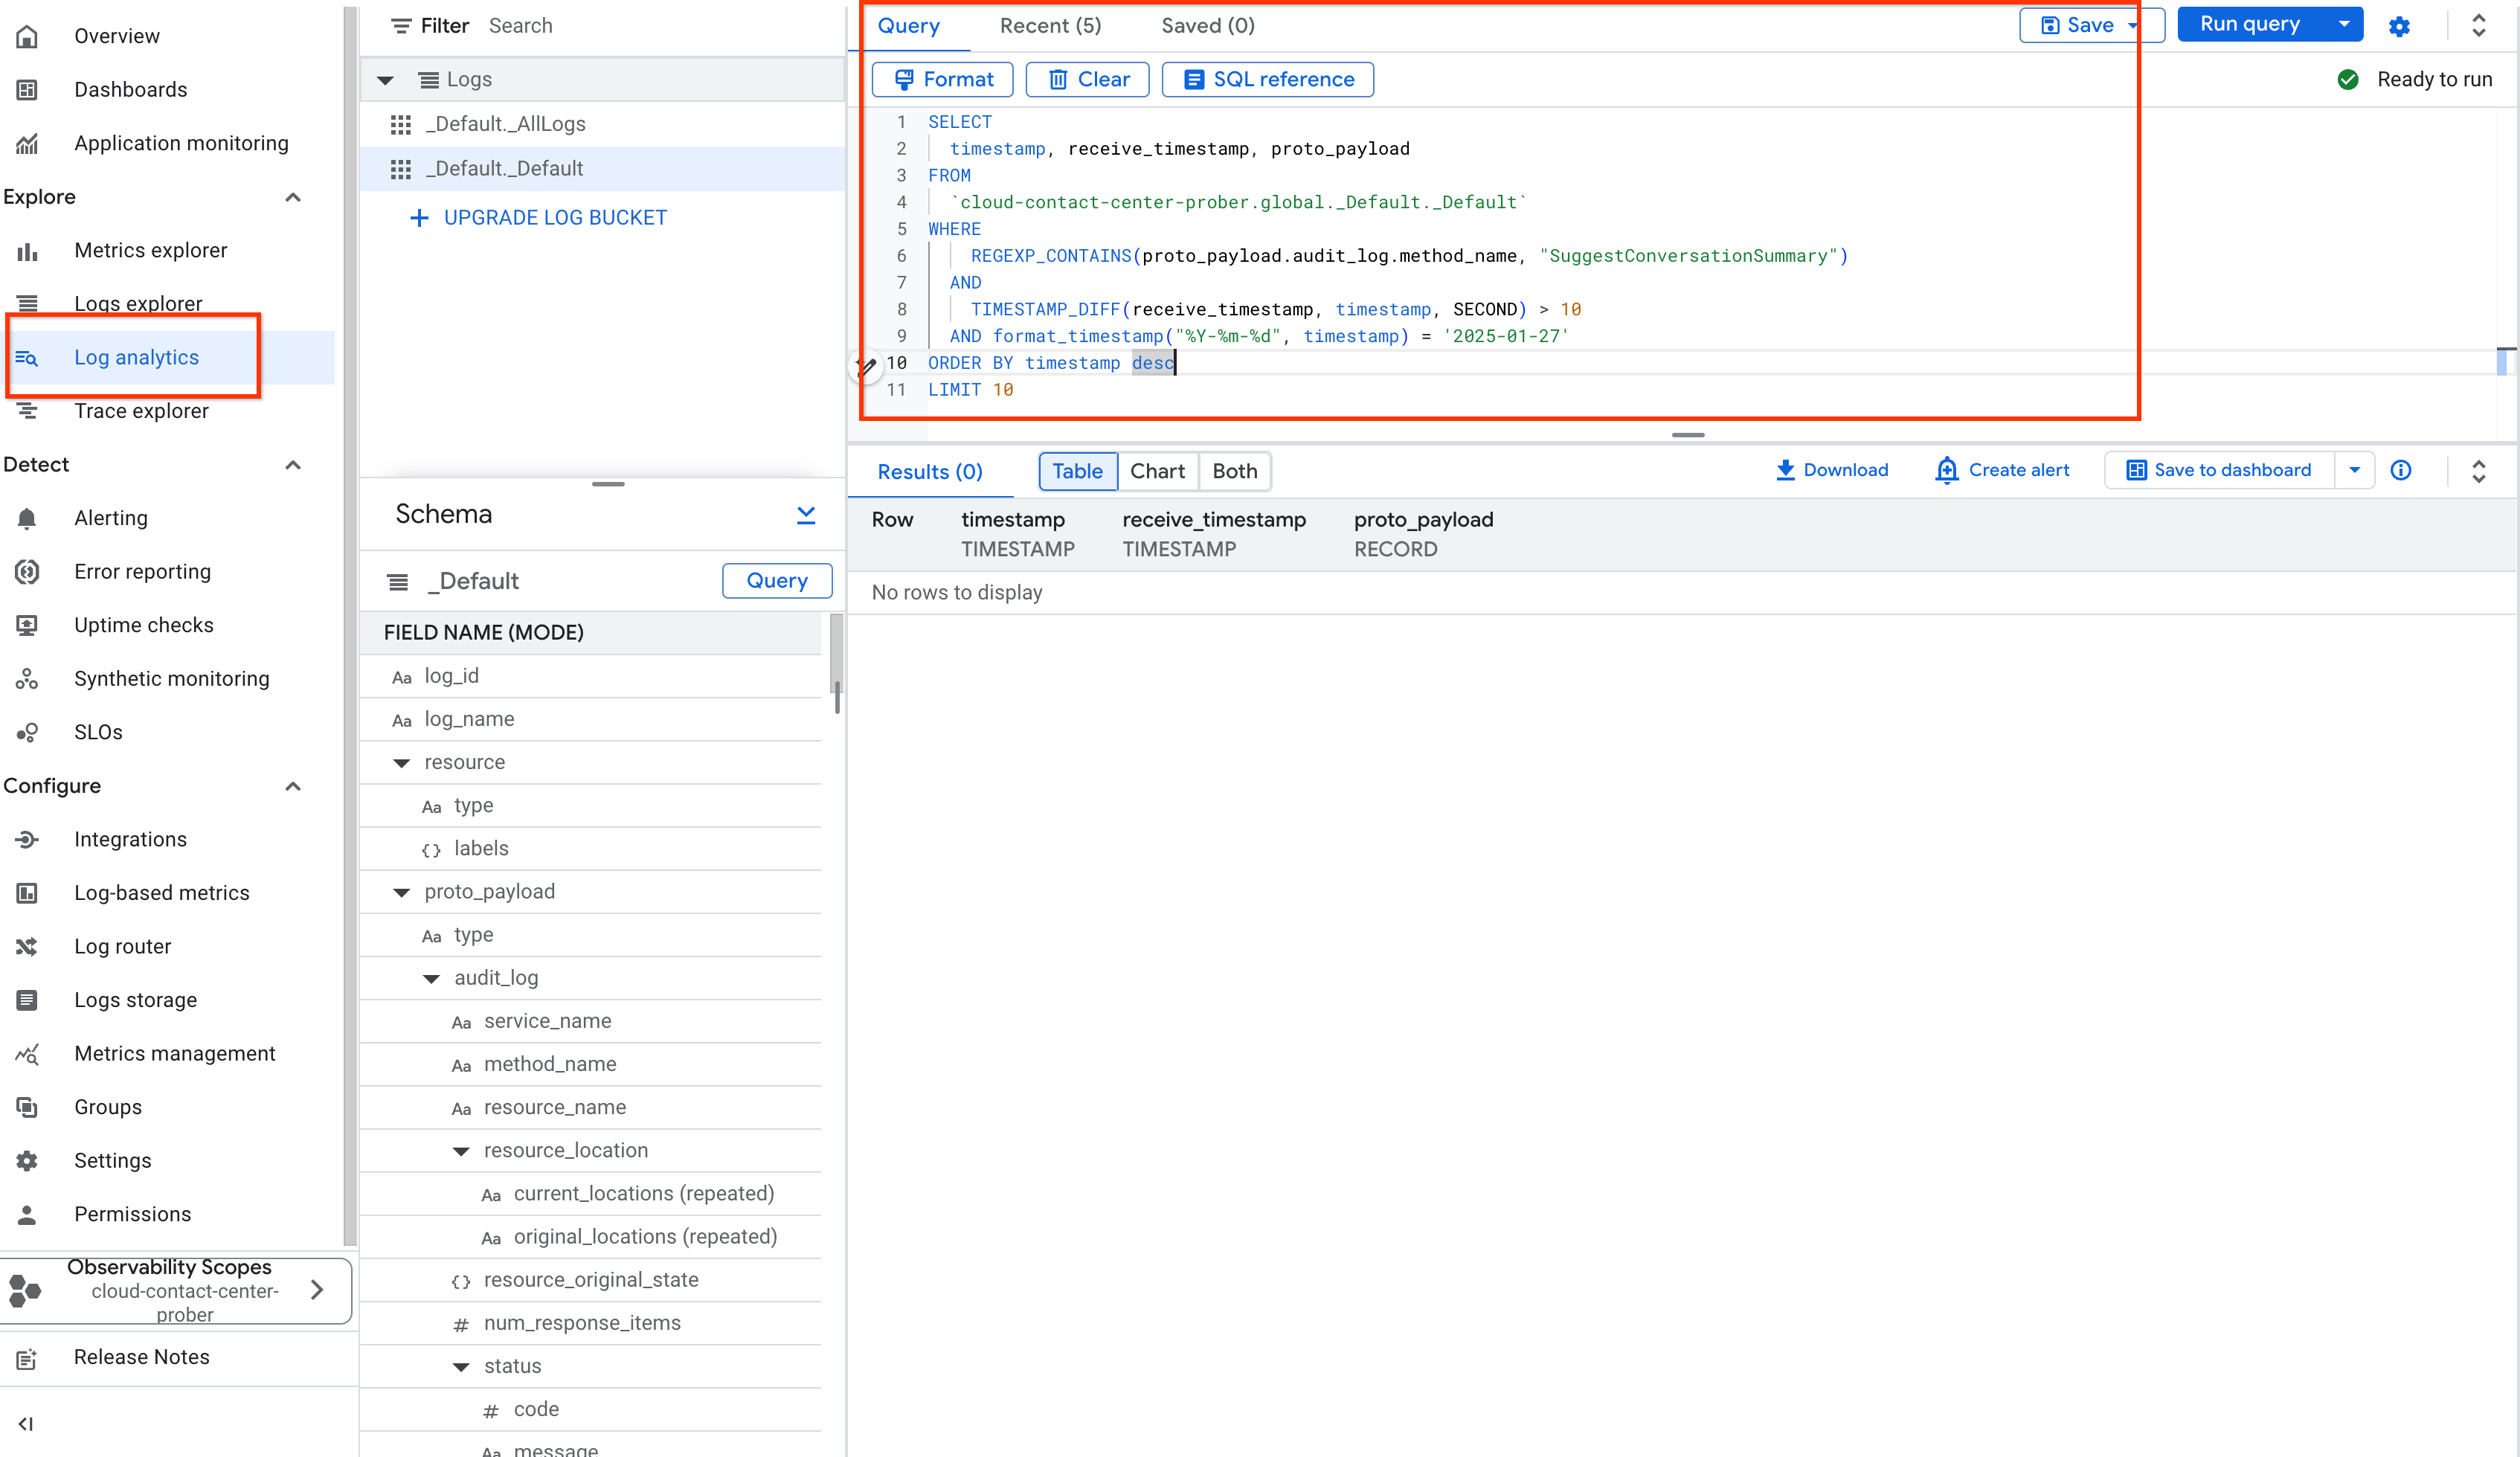
Successivamente, identifica gli ID conversazione con una latenza superiore a un determinato valore in Log analytics. Ad esempio, nello screenshot seguente puoi vedere le conversazioni più lunghe di 10 secondi in un determinato giorno.
Vai ad Analisi dei log.
Fornisci l'ora rispetto a TIMESTAMP_DIFF.
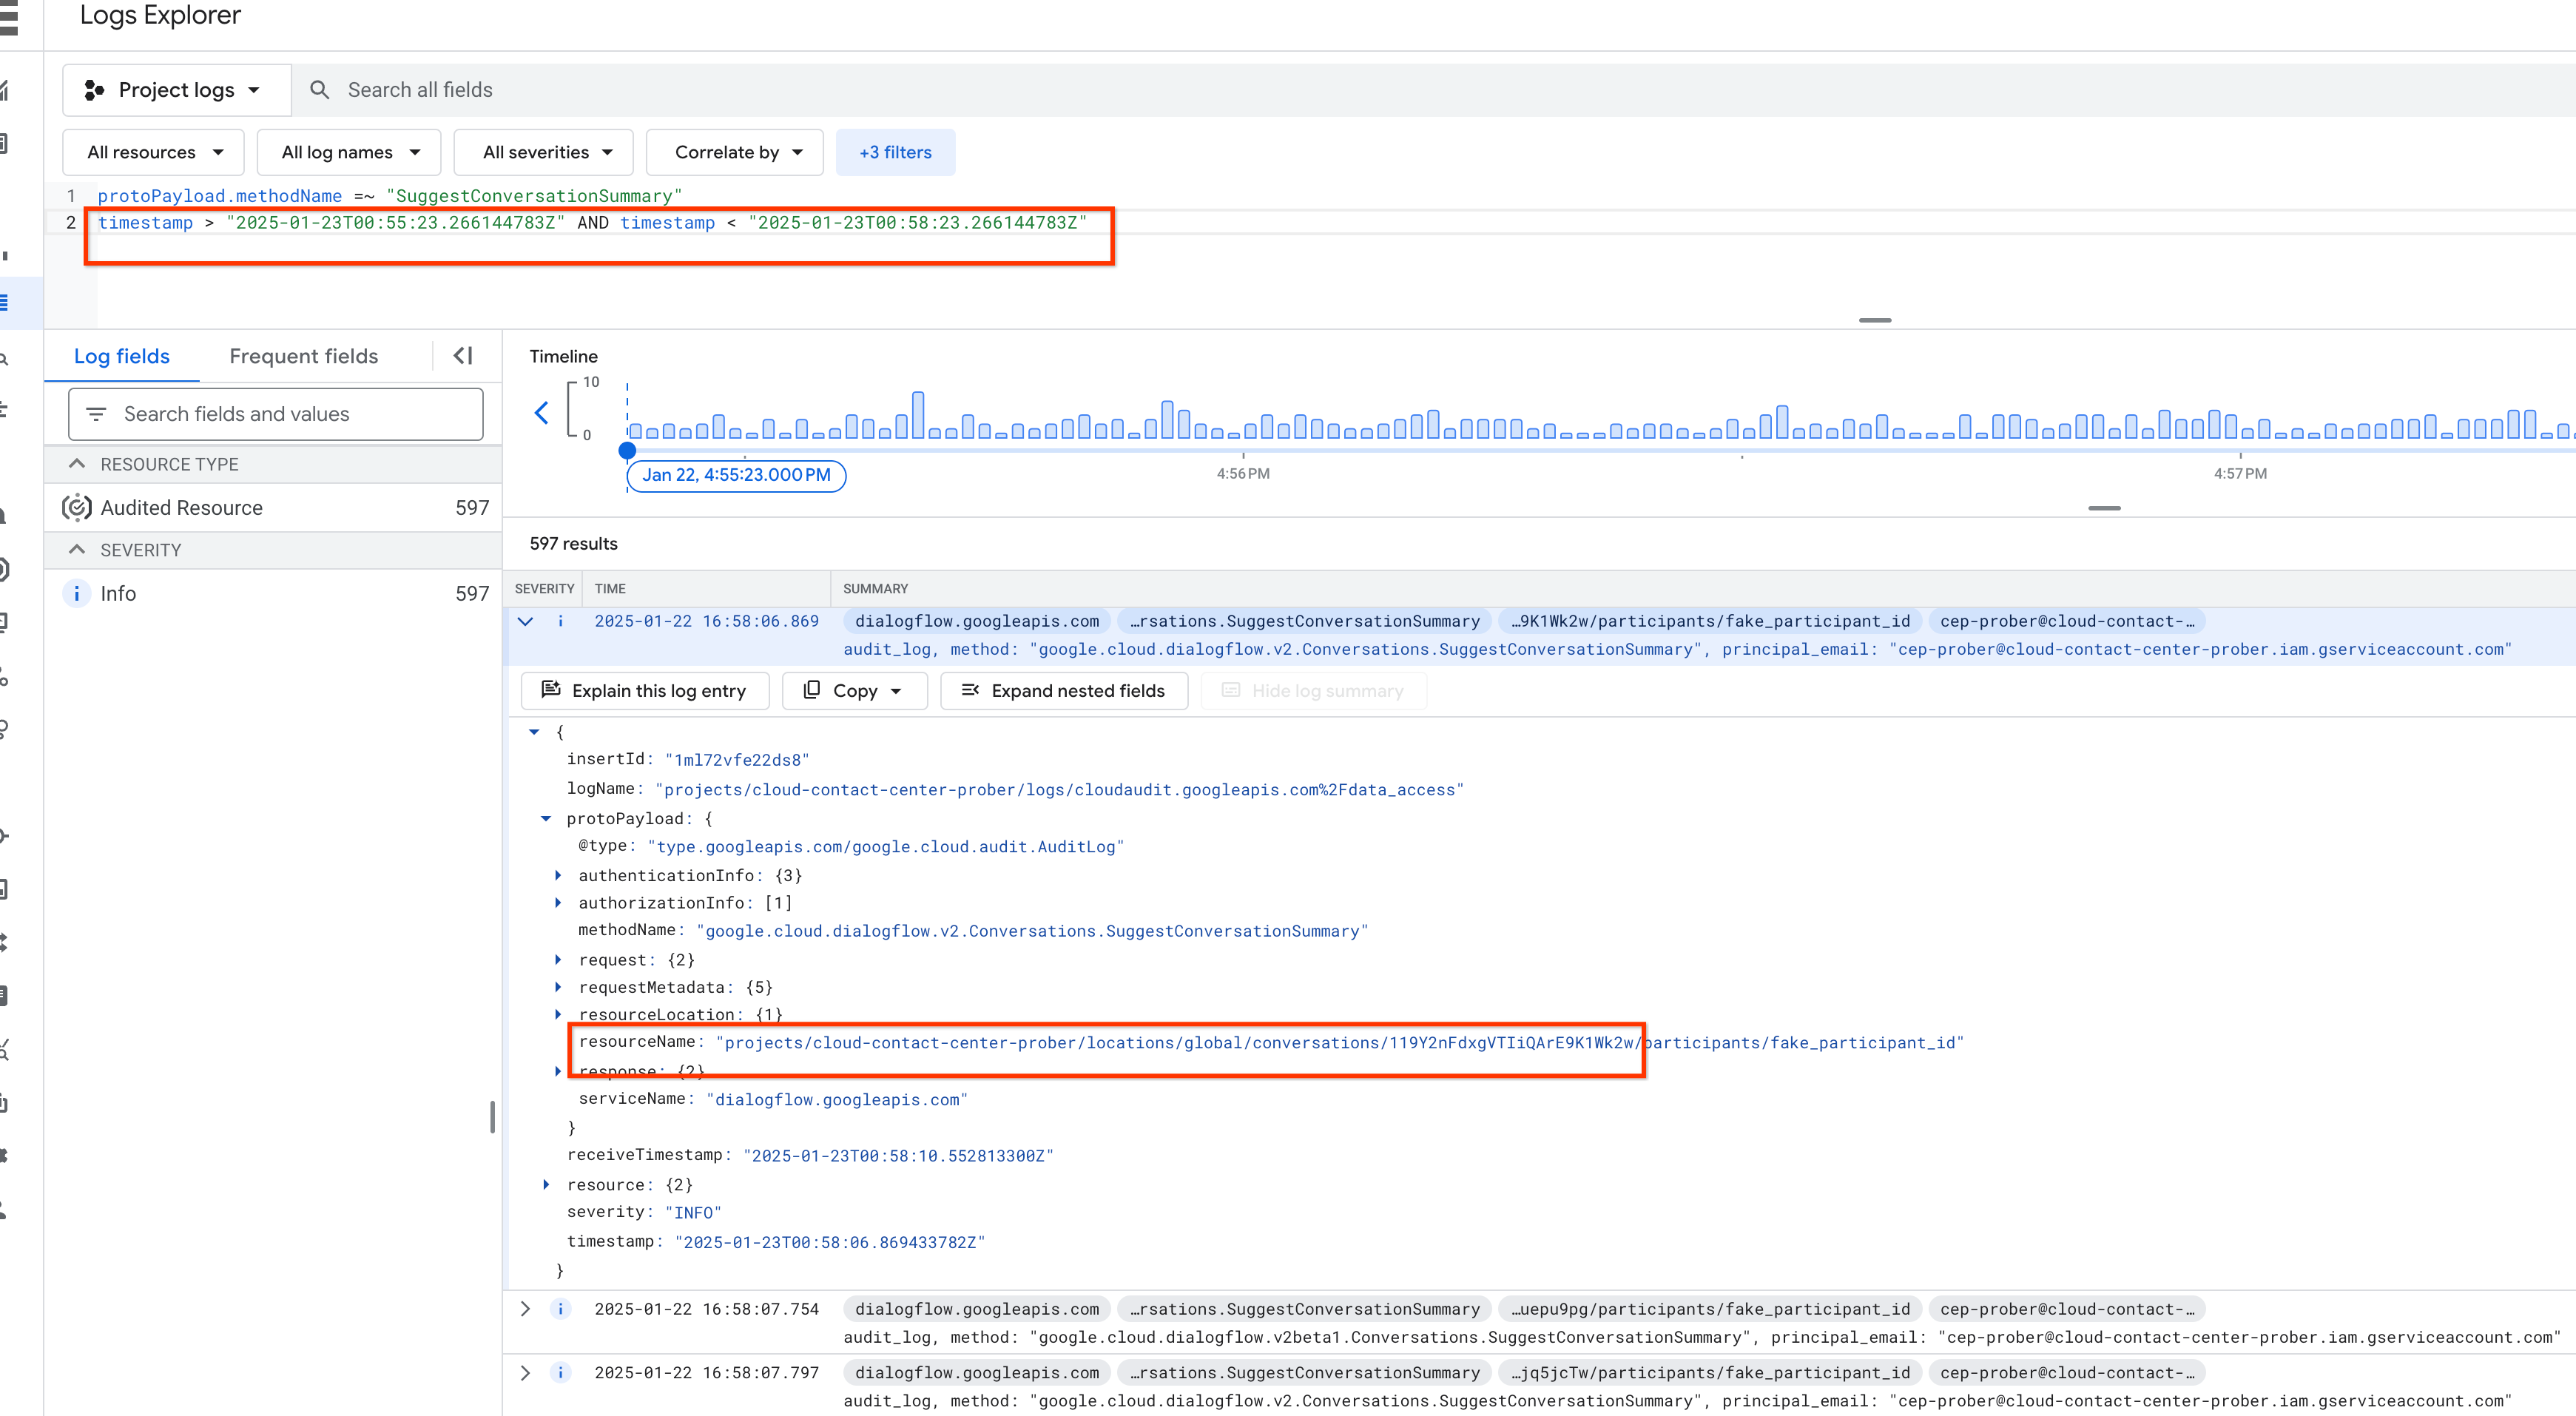
In alternativa, utilizza il timestamp per identificare conversazioni specifiche durante un determinato periodo in Log explorer.
Inserisci il nome del metodo in protoPayload.methodName.
Inserisci l'intervallo di tempo in Timestamp.
Visualizza i risultati in Campi log.
Puoi accedere a qualsiasi API Agent Assist con Cloud Logging abilitato seguendo tutti i passaggi precedenti.
[[["Facile da capire","easyToUnderstand","thumb-up"],["Il problema è stato risolto","solvedMyProblem","thumb-up"],["Altra","otherUp","thumb-up"]],[["Difficile da capire","hardToUnderstand","thumb-down"],["Informazioni o codice di esempio errati","incorrectInformationOrSampleCode","thumb-down"],["Mancano le informazioni o gli esempi di cui ho bisogno","missingTheInformationSamplesINeed","thumb-down"],["Problema di traduzione","translationIssue","thumb-down"],["Altra","otherDown","thumb-down"]],["Ultimo aggiornamento 2025-09-04 UTC."],[[["\u003cp\u003eThis document outlines how to debug API and service usage and latency spikes within the Google Cloud console.\u003c/p\u003e\n"],["\u003cp\u003eYou can identify high-latency conversation IDs by using the "Traffic by API method" graph in the \u003cstrong\u003eMetrics\u003c/strong\u003e section of \u003cstrong\u003eEnabled APIs and Services\u003c/strong\u003e.\u003c/p\u003e\n"],["\u003cp\u003eEnabling \u003cstrong\u003eAdmin Read\u003c/strong\u003e, \u003cstrong\u003eData Read\u003c/strong\u003e, and \u003cstrong\u003eData Write\u003c/strong\u003e audit logs is necessary for debugging.\u003c/p\u003e\n"],["\u003cp\u003e\u003ccode\u003eLog analytics\u003c/code\u003e can be used to find conversations with latency exceeding a specific time, such as 10 seconds.\u003c/p\u003e\n"],["\u003cp\u003e\u003ccode\u003eLog explorer\u003c/code\u003e can be used with the method name and timestamp to identify specific conversations during a time period.\u003c/p\u003e\n"]]],[],null,["# Troubleshooting API and services latency spike\n\nThis document gives an overview of the debugging process to understand the usage of **APIs and Services** in the Google Cloud console and also their latency spike.\n\nFirst, follow these steps to identify conversation IDs with high latency:\n\n1. Open **[Google Cloud console](https://console.cloud.google.com)** and go to the **APIs \\& Services**.\n2. Click **Enabled APIs and Services**.\n3. Go to **Metrics** and select the **API method** under **Methods**.\n\nThe latency traffic graph appears, labeled **Traffic by API method**.\n\nNext, ensure that you enable audit logging.\n\n1. Go to **Audit Logs**.\n2. Check the options **Admin Read** , **Data Read** and **Data Write**.\n3. Click **Save**.\n\nNext, identify the conversation IDs with latency longer than a certain value in `Log analytics`. For example, in the following screenshot, you can see conversations longer than 10 seconds on a particular day.\n\n1. Go to **Log analytics**.\n2. Provide the time against **TIMESTAMP_DIFF**.\n\nAlternatively, use the timestamp to identify specific conversations during a certain period in `Log explorer`.\n\n1. Enter the name of the method in **protoPayload.methodName**.\n2. Enter the time range in **Timestamp**.\n3. View the results in **Log fields**.\n\nYou can access any Agent Assist APIs with Cloud Logging enabled by following all of the preceding steps."]]