This document describes how to access and view Google Cloud Observability error reports in the Cloud Tools for Visual Studio Error Reporting tab.
Before you begin
Configure your application to log exceptions in Cloud Logging.
Accessing the Error Reporting tab
To access and view the error reports in Visual Studio, select Tools -> Google Cloud Tools -> Show Stackdriver Error Reporting.

Information about the error reports
The reports display the following:
| Column | Description |
|---|---|
| Occurrences | Number of times the error occurred in the selected time range. |
| Users | Number of users affected by the error in the selected time range. |
| Error | Provides the error information, as extracted from its stack trace, including the error message and its code location. |
| Seen in | Lists the service and version in which the error occurs. |
| First seen | Time when the error first appeared. Sorting on this column is useful for finding the errors which have most recently started occurring. |
| Last seen | Time when the error last occurred. Sorting on this column is useful for seeing which errors are still occurring. You can also reverse sort to see which have stopped. |
| Status | If available, the HTTP status code returned with this error. |
Error Reporting analyzes stack traces to remove duplicate errors and groups the errors according to the common frameworks used by your application's programming language.
You can select a time-range button to display only those errors that occur within the specified time frame. For example, clicking 1 hour displays errors that occurred within the past hour.
You can click Auto reload to refresh the list every 10 seconds.
Viewing details of an error
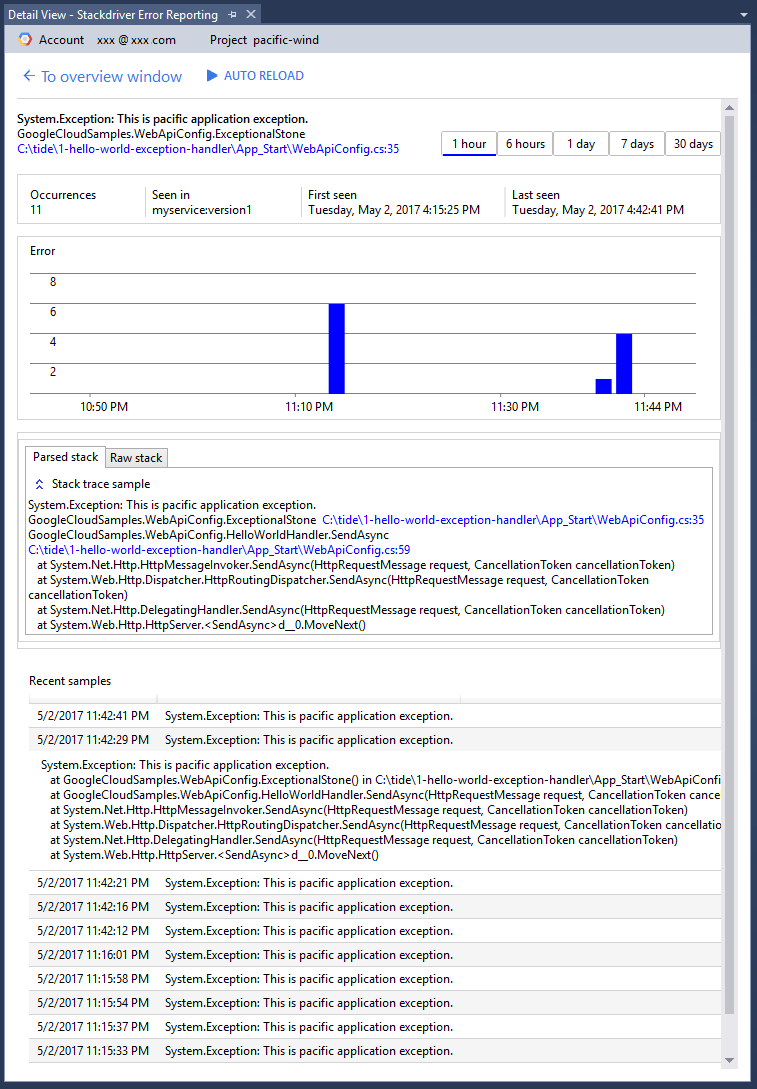
To view details about a specific error, click its row in the error list. The Detail View tab for the error displays.

You can examine the history of the selected error, as well as access diagnostic information contained in a series of error samples. C# applications generate samples that include parsed stack traces.
Error Reporting groups together similar errors, so it only keeps 1,000 samples of the errors and then extrapolates. For each sample, the UI shows the data that is provided to Error Reporting.
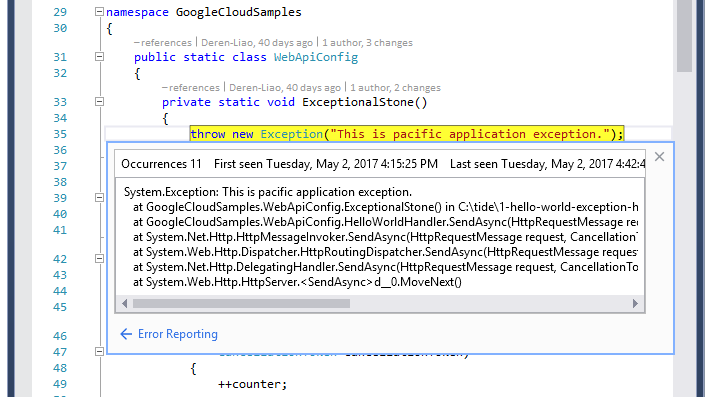
Viewing the source code for an error
Errors from the C# application and debug build contain source code location information at stack frames. To browse to the source code, click on the source link. First, you must load the project that contains the file in your current Visual Studio solution.

