이 페이지에서는 Cloud Monitoring을 사용하여 Sensitive Data Protection 사용량에 대한 측정항목 데이터를 보고 그래프로 표시하는 방법을 설명합니다.
Sensitive Data Protection은 Sensitive Data Protection 사용량에 대한 자세한 원격 분석을 Monitoring으로 전송합니다. 이는 예상치 못한 발견 항목, 스캔 또는 변환된 데이터 양, 작업 트리거 또는 작업의 오류, 비용을 모니터링하는 데 유용합니다.
Monitoring에서 Sensitive Data Protection 측정항목 보기
Cloud Monitoring의 측정항목 탐색기를 사용하면 사용 가능한 측정항목 데이터를 자세히 살펴보고 Sensitive Data Protection 사용량에 대한 유용한 정보를 얻을 수 있습니다. Monitoring은 다양한 측정항목을 지원하므로 필터 및 집계를 조합하여 사용하면 새롭고 유용한 정보를 얻을 수 있습니다.
측정항목 탐색기를 사용하여 모니터링 리소스의 측정항목을 확인하려면 다음을 수행하세요.
-
Google Cloud 콘솔에서 leaderboard 측정항목 탐색기 페이지로 이동합니다.
검색창을 사용하여 이 페이지를 찾은 경우 부제목이 Monitoring인 결과를 선택합니다.
- 측정항목 요소에서 측정항목 선택 메뉴를 확장한 후 리소스 유형 및 측정항목 유형을 선택합니다. 예를 들어 가상 머신의 CPU 사용률을 차트로 표시하려면 다음 안내를 따르세요.
- (선택사항) 메뉴의 옵션을 줄이려면 필터 표시줄에서 측정항목 이름의 일부를 입력합니다. 이 예시에서는
utilization을 입력합니다. - 활성 리소스 메뉴에서 VM 인스턴스를 선택합니다.
- 활성 측정항목 카테고리 메뉴에서 인스턴스를 선택합니다.
- 활성 측정항목 메뉴에서 CPU 사용량을 선택한 후 적용을 클릭합니다.
- (선택사항) 메뉴의 옵션을 줄이려면 필터 표시줄에서 측정항목 이름의 일부를 입력합니다. 이 예시에서는
표시할 시계열을 필터링하려면 필터 요소를 사용합니다.
시계열을 조합하려면 집계 요소의 메뉴를 사용합니다. 예를 들어 VM의 CPU 사용률을 영역에 따라 표시하려면 첫 번째 메뉴를 평균으로, 두 번째 메뉴를 영역으로 설정합니다.
집계 요소의 첫 번째 메뉴가 집계되지 않음으로 설정되면 모든 시계열이 표시됩니다. 집계 요소 기본 설정은 선택한 측정항목 유형에 따라 결정됩니다.
측정항목 탐색기에서 Sensitive Data Protection 관련 측정항목을 보려면 dlp.googleapis.com으로 검색하여 검색 결과를 세분화합니다.
측정항목 탐색기에서 API 측정항목을 보려면 사용된 API를 리소스 유형으로 선택한 다음 필터 및 집계 옵션을 사용해 데이터를 상세검색합니다.
원하는 측정항목을 찾았으면 Monitoring을 사용하여 계속해서 모니터링하면서 강력한 애플리케이션을 유지하는 데 도움이 되는 커스텀 대시보드와 알림을 만들 수 있습니다.
측정항목 그래프 작성
고급 집계를 사용하여 측정항목을 집계하여 그래프로 표시할 수 있습니다. 다음 설정을 사용하세요.
- 정렬기: SUM
- 정렬 기간: 1440
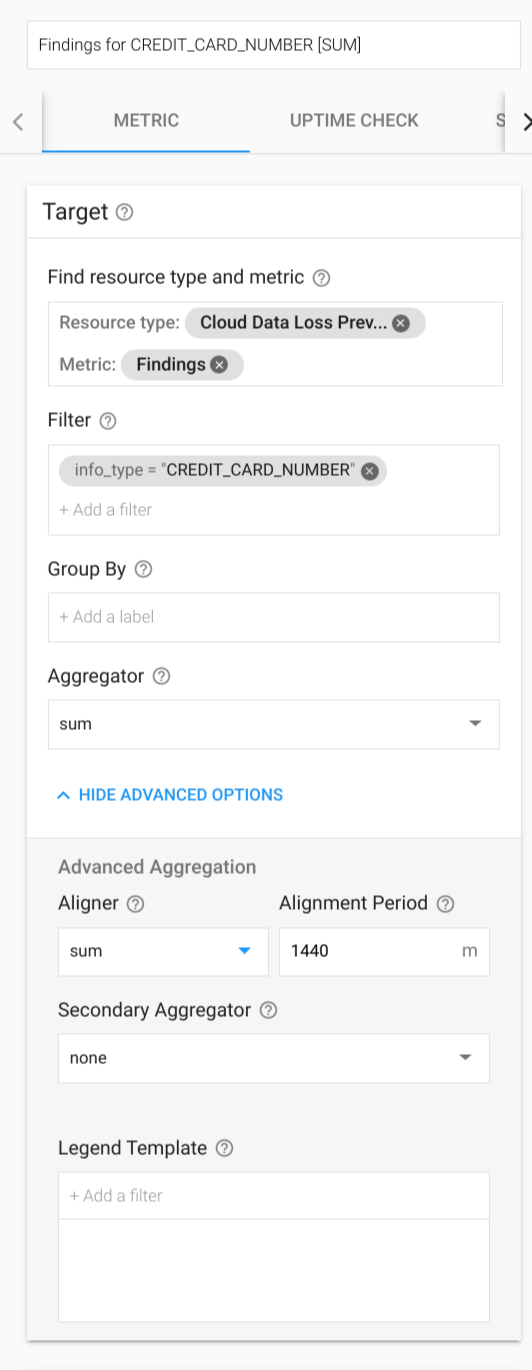
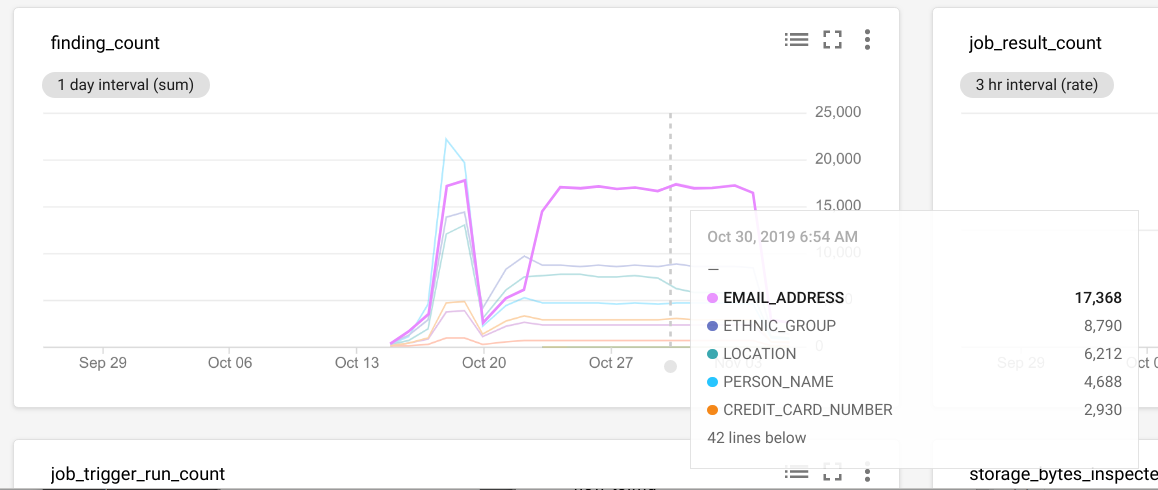
일별 결과를 보여주는 차트가 표시됩니다.
Cloud Monitoring은 모든 측정항목에 대한 알림을 지원합니다. Sensitive Data Protection 측정항목을 사용하면 다음을 포함하는 사용 사례에 대한 알림을 보낼 수 있습니다.
content_bytes_inspected_count또는content_bytes_transformed_count를 모니터링하여 지출이 하루 동안 예산을 초과한 경우 알림을 보냅니다.- 총 발견 항목 또는 특정 infoType의 발견 항목이 기준점을 초과하면 알림을 보냅니다. 예를 들어 PII가 없는 특정 프로젝트에서
CREDIT_CARD_NUMBER발견 항목이 0을 초과하면 알림을 만들 수 있습니다.
사용 가능한 측정항목
다음 측정항목 유형 이름에 dlp.googleapis.com/ 프리픽스를 붙여야 합니다. 테이블의 항목에서는 이 프리픽스가 생략되었습니다.
| 측정항목 유형 표시 이름 |
|
|---|---|
| 종류, 유형, 단위 출시 단계 |
설명 라벨 |
finding_count발견 항목 수 |
|
DELTA, INT64, By
|
초당 발견 항목 수. PublishToStackdriver 액션이 포함된 작업에만 채워집니다.
|
content_bytes_inspected_count검사된 콘텐츠 바이트 수 |
|
DELTA, INT64, By
|
초당 콘텐츠 메서드에서 검사된 바이트 수. |
content_bytes_transformed_count변환된 콘텐츠 바이트 수 |
|
DELTA, INT64, By
|
초당 콘텐츠 메서드에서 변환된 바이트 수. |
storage_bytes_inspected_count검사된 스토리지 바이트 수 |
|
DELTA, INT64, By
|
Sensitive Data Protection 작업에서 검사된 바이트 수 |
storage_bytes_transformed_count변환된 스토리지 바이트 수 |
|
DELTA, INT64, By
|
Sensitive Data Protection 작업에서 변환된 바이트 수 |
job_result_count작업 결과 |
|
DELTA, INT64, 1
|
Sensitive Data Protection 작업 결과. 작업이 성공하면 true, 그렇지 않으면 false입니다. |
job_trigger_run_count작업 트리거 실행 |
|
DELTA, INT64, 1
|
작업 트리거 실행 결과. |