이 페이지에서는 시스템 호출 추적을 통해 컨테이너 샌드박스 제한사항을 진단하는 방법을 설명하고 strace 또는 dtruss와 같은 도구를 사용하여 시스템 호출을 추적하는 데 익숙하다고 가정합니다. 시스템 호출 추적에 익숙하지 않은 경우 Google Cloud 지원팀에 문제의 세부정보를 문의한 후 Google Cloud 지원팀이 시스템 호출을 추적하도록 초대한 경우에만 진행해야 합니다.
컨테이너 샌드박스는 Linux에서 지원되는 모든 시스템 호출을 지원하지 않습니다. strace(Linux) 또는 dtruss(macOS)와 같은 시스템 호출 추적 도구를 사용하여 애플리케이션에서 호출한 syscall을 검사하여 샌드박스에서 지원하지 않는 syscall을 확인할 수 있습니다.
strace(Linux) 사용
Linux에서 코드를 실행하려면 strace를 설치하고 사용 설정합니다.
sudoapt-getinstallstrace
strace를 사용하여 애플리케이션을 실행할 때 일반적인 호출은 strace -f로 시작합니다. 여기서 -f는 모든 하위 스레드를 추적한다는 의미입니다. 예를 들어 ./main으로 애플리케이션을 일반적으로 호출하는 경우 /usr/bin/strace -f ./main을 호출하여 strace로 실행할 수 있습니다.
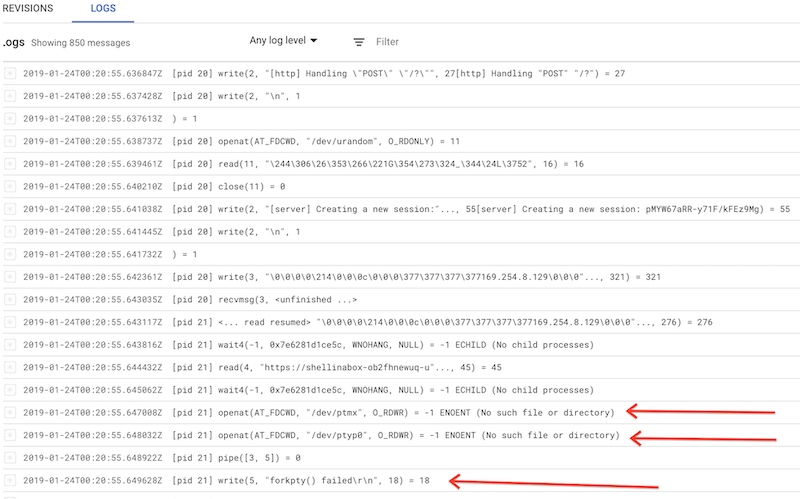
strace에서 반환된 로그 보기
strace의 시스템 로그는 다음과 같이 표시됩니다.
dtruss(macOS) 사용
macOS에서 코드를 실행하려면 명령줄에서 일반적인 호출을 dtruss -a로 시작하여 dtrusss를 사용합니다. 예를 들면 다음과 같습니다.
[[["이해하기 쉬움","easyToUnderstand","thumb-up"],["문제가 해결됨","solvedMyProblem","thumb-up"],["기타","otherUp","thumb-up"]],[["이해하기 어려움","hardToUnderstand","thumb-down"],["잘못된 정보 또는 샘플 코드","incorrectInformationOrSampleCode","thumb-down"],["필요한 정보/샘플이 없음","missingTheInformationSamplesINeed","thumb-down"],["번역 문제","translationIssue","thumb-down"],["기타","otherDown","thumb-down"]],["최종 업데이트: 2025-09-04(UTC)"],[],[],null,["# Tracing system calls\n\nThis page describes using system call tracing to diagnose container sandbox\nlimitations, and assumes that you have some familiarity with system call tracing,\nusing tools such as [`strace`](https://en.wikipedia.org/wiki/Strace) or\n`dtruss`. If you are not familiar with system call tracing, you should proceed\nonly after you contact Google Cloud support with the details of your problem\nand have been invited to trace the system calls by the Google Cloud support team.\n\nThe container sandbox does not support all of the system calls that are\nsupported in Linux. You can use system call tracing tools such as `strace`\n(Linux) or `dtruss` (macOS) to examine the syscalls made by your application, to\nhelp determine the syscalls that are not supported by the sandbox.\n\nUsing `strace` (Linux)\n----------------------\n\nIf you're running your code on Linux, install and enable `strace`: \n\n```bash\nsudo apt-get install strace\n```\n\nRun your application with strace by prefacing your usual invocation with\n`strace -f` where `-f` means to trace all child threads. For example, if you\nnormally invoke your application with `./main`, you can run it with strace by\ninvoking `/usr/bin/strace -f ./main`.\n\n### Viewing the logs returned by strace\n\nThe system logs from strace look like this:\n\nUsing `dtruss` (macOS)\n----------------------\n\nIf you're running your code on macOS, use `dtrusss` by prefacing your usual\ninvocation with `dtruss -a` from the command line, for example: \n\n```bash\nsudo dtruss -a ./main\n```\n\nFor documentation, use the command `man dtruss`, or visit one of the\n[`dtrace/drusss` websites](http://www.brendangregg.com/DTrace/dtruss_example.txt)."]]