이 문서는 Google Distributed Cloud를 실행하는 애플리케이션 소유자를 대상으로 합니다. 이 문서에서는 GDC용 VM 런타임을 사용하는 가상 머신(VM)의 콘솔 로그를 보는 방법을 보여줍니다. VM 콘솔 로그를 사용하여 클러스터의 문제를 해결하고 진단할 수 있습니다.
시작하기 전에
이 문서를 완료하려면 다음 리소스에 대해 액세스 권한이 필요합니다.
- 클러스터 중 하나에서 실행되는 VM. 필요한 경우 Google Distributed Cloud에서 VM을 만듭니다.
kubectl의 플러그인으로 설치되는virtctl클라이언트 도구. 필요한 경우 virtctl 클라이언트 도구를 설치합니다.
VM에 연결
검토할 로그가 있는지 확인하려면 VM에 연결하고 일부 로그 활동을 생성합니다.
콘솔에서 VM에 액세스하려면
kubectl을 사용합니다.kubectl virt console VM_NAMEVM_NAME을 연결하려는 VM의 이름으로 바꿉니다.메시지가 표시되면 VM을 만들었을 때 지정한 사용자 인증 정보를 입력합니다.
Debian 기반 VM의
apt-get또는 Red Hat 기반 VM의yum check-update와 같이 업데이트를 확인하기 위해 명령어를 실행합니다.Debian 기반
apt-get updateRed Hat 기반
yum check-update콘솔 로그 활동을 성공적으로 생성한 후 VM 세션 및 콘솔을 종료합니다.
Ctrl + ]
VM 콘솔 로그 보기
Google Cloud 콘솔에서 VM 콘솔 로그를 봅니다. VM 직렬 콘솔 로그는 Cloud Logging으로 스트리밍되며 로그 탐색기에서 볼 수 있습니다. GDC용 VM 런타임을 사용하여 실행되는 VM은 콘솔 로그에서 컨테이너로 분류됩니다.
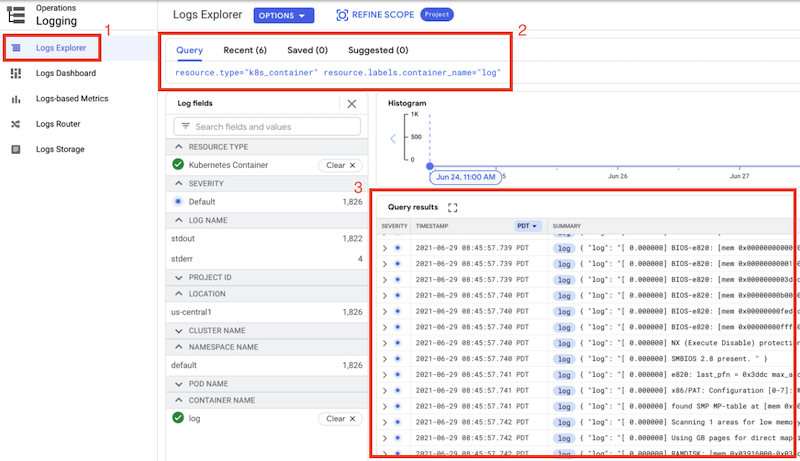
Google Cloud 콘솔의 로깅 메뉴에서 로그 탐색기 페이지로 이동합니다.
쿼리 필드에 다음 기본 쿼리를 입력합니다.
resource.type="k8s_container"
resource.labels.container_name="log"
쿼리 결과 창에는 다음 예시 스크린샷에 표시된 것처럼 VM의 콘솔 로그 출력이 표시됩니다.
쿼리에 클러스터 이름 및 VM 이름을 추가하여 특정 VM에 대한 쿼리 결과를 추가로 필터링할 수 있습니다.
resource.type="k8s_container"
resource.labels.container_name="log"
resource.labels.cluster_name="CLUSTER_NAME"
labels.k8s-pod/kubevirt/vm="VM_NAME"
다음을 바꿉니다.
CLUSTER_NAME: VM이 포함된 클러스터의 이름입니다.VM_NAME: VM의 이름입니다.
다음 단계
- 콘솔 로그를 필터링하는 방법을 자세히 알아보려면 로그 탐색기에서 쿼리 빌드를 참조하세요.