사용량 모니터링
이 페이지에서는 Firestore 사용량을 모니터링하고 앱의 잠재적 문제를 파악하는 방법에 대해 설명합니다.
사용량 대시보드
Google Cloud 콘솔과 Firebase Console의 사용량 대시보드를 사용하여 시간 경과에 따른 문서 읽기, 쓰기, 삭제를 확인합니다.
액세스 제어
사용량 대시보드에는 monitoring.timeSeries.list IAM 권한이 필요합니다.
프로젝트 소유자, 편집자, 뷰어 역할이 이 권한을 부여합니다. Cloud Monitoring 역할 또는 커스텀 역할을 통해 이 권한을 부여할 수도 있습니다.
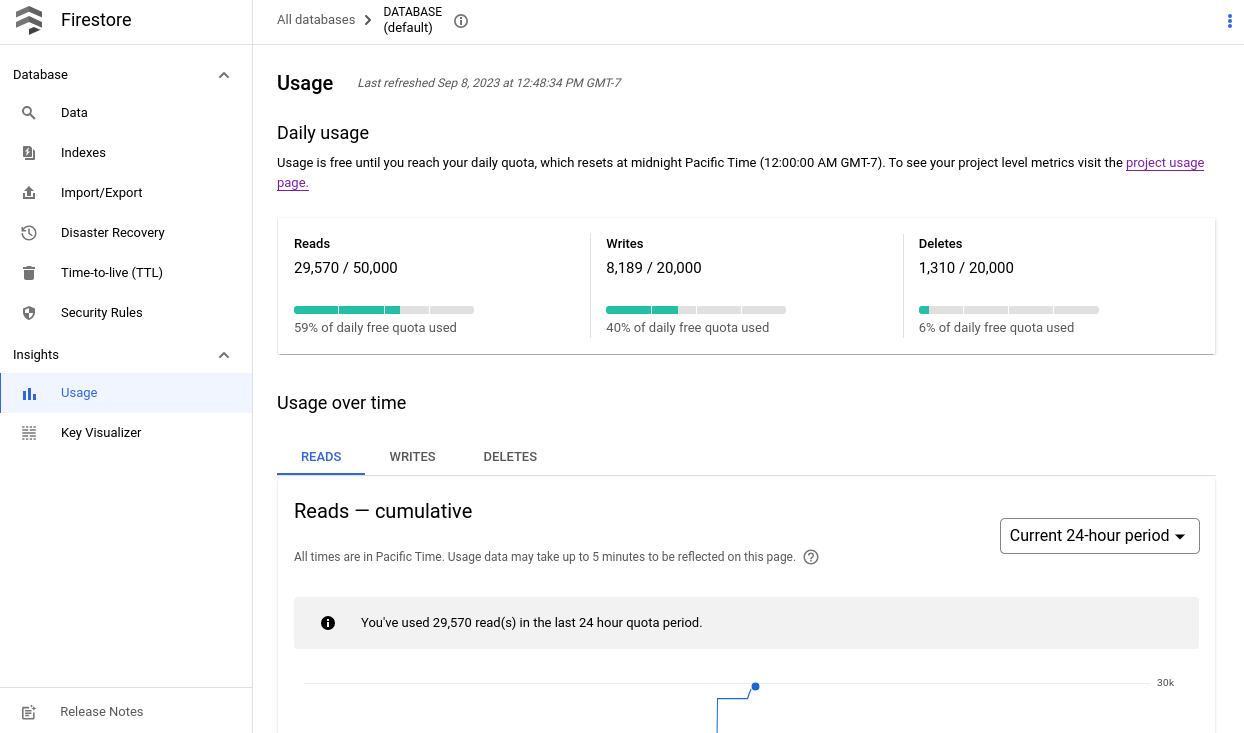
데이터베이스 사용량 대시보드
Firestore 데이터베이스의 사용량 측정항목을 보려면 Google Cloud 콘솔에서 데이터베이스 사용량 페이지를 엽니다.
Google Cloud 콘솔에서 데이터베이스 페이지로 이동합니다.
데이터베이스 목록에서 필요한 데이터베이스를 선택합니다.
탐색 메뉴에서 사용량을 클릭합니다.
페이지에 표시되는 메시지의 링크를 클릭하여 데이터베이스 사용량을 확인합니다.
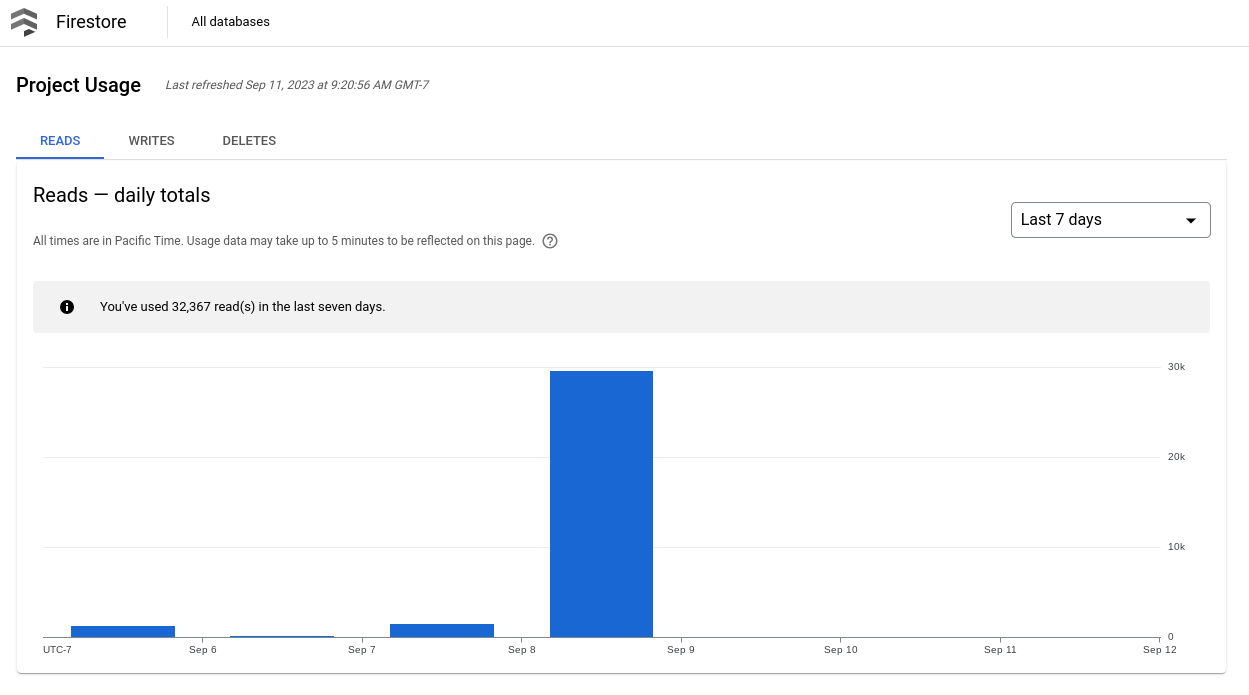
집계된 사용량 대시보드
프로젝트에 Firestore 데이터베이스가 여러 개 있는 경우 Google Cloud 콘솔이나 Firebase Console에서 집계된 사용량 측정항목을 볼 수 있습니다.
Google Cloud 콘솔
Google Cloud 콘솔에서 프로젝트 사용량 페이지로 이동합니다.
프로젝트 Google Cloud 프로젝트 사용량으로 이동
프로젝트 사용량 대시보드에는 시간 경과에 따른 문서 작업이 다음과 같이 표시됩니다.
Firebase Console
Firestore 사용량 페이지(Firebase Console)로 이동
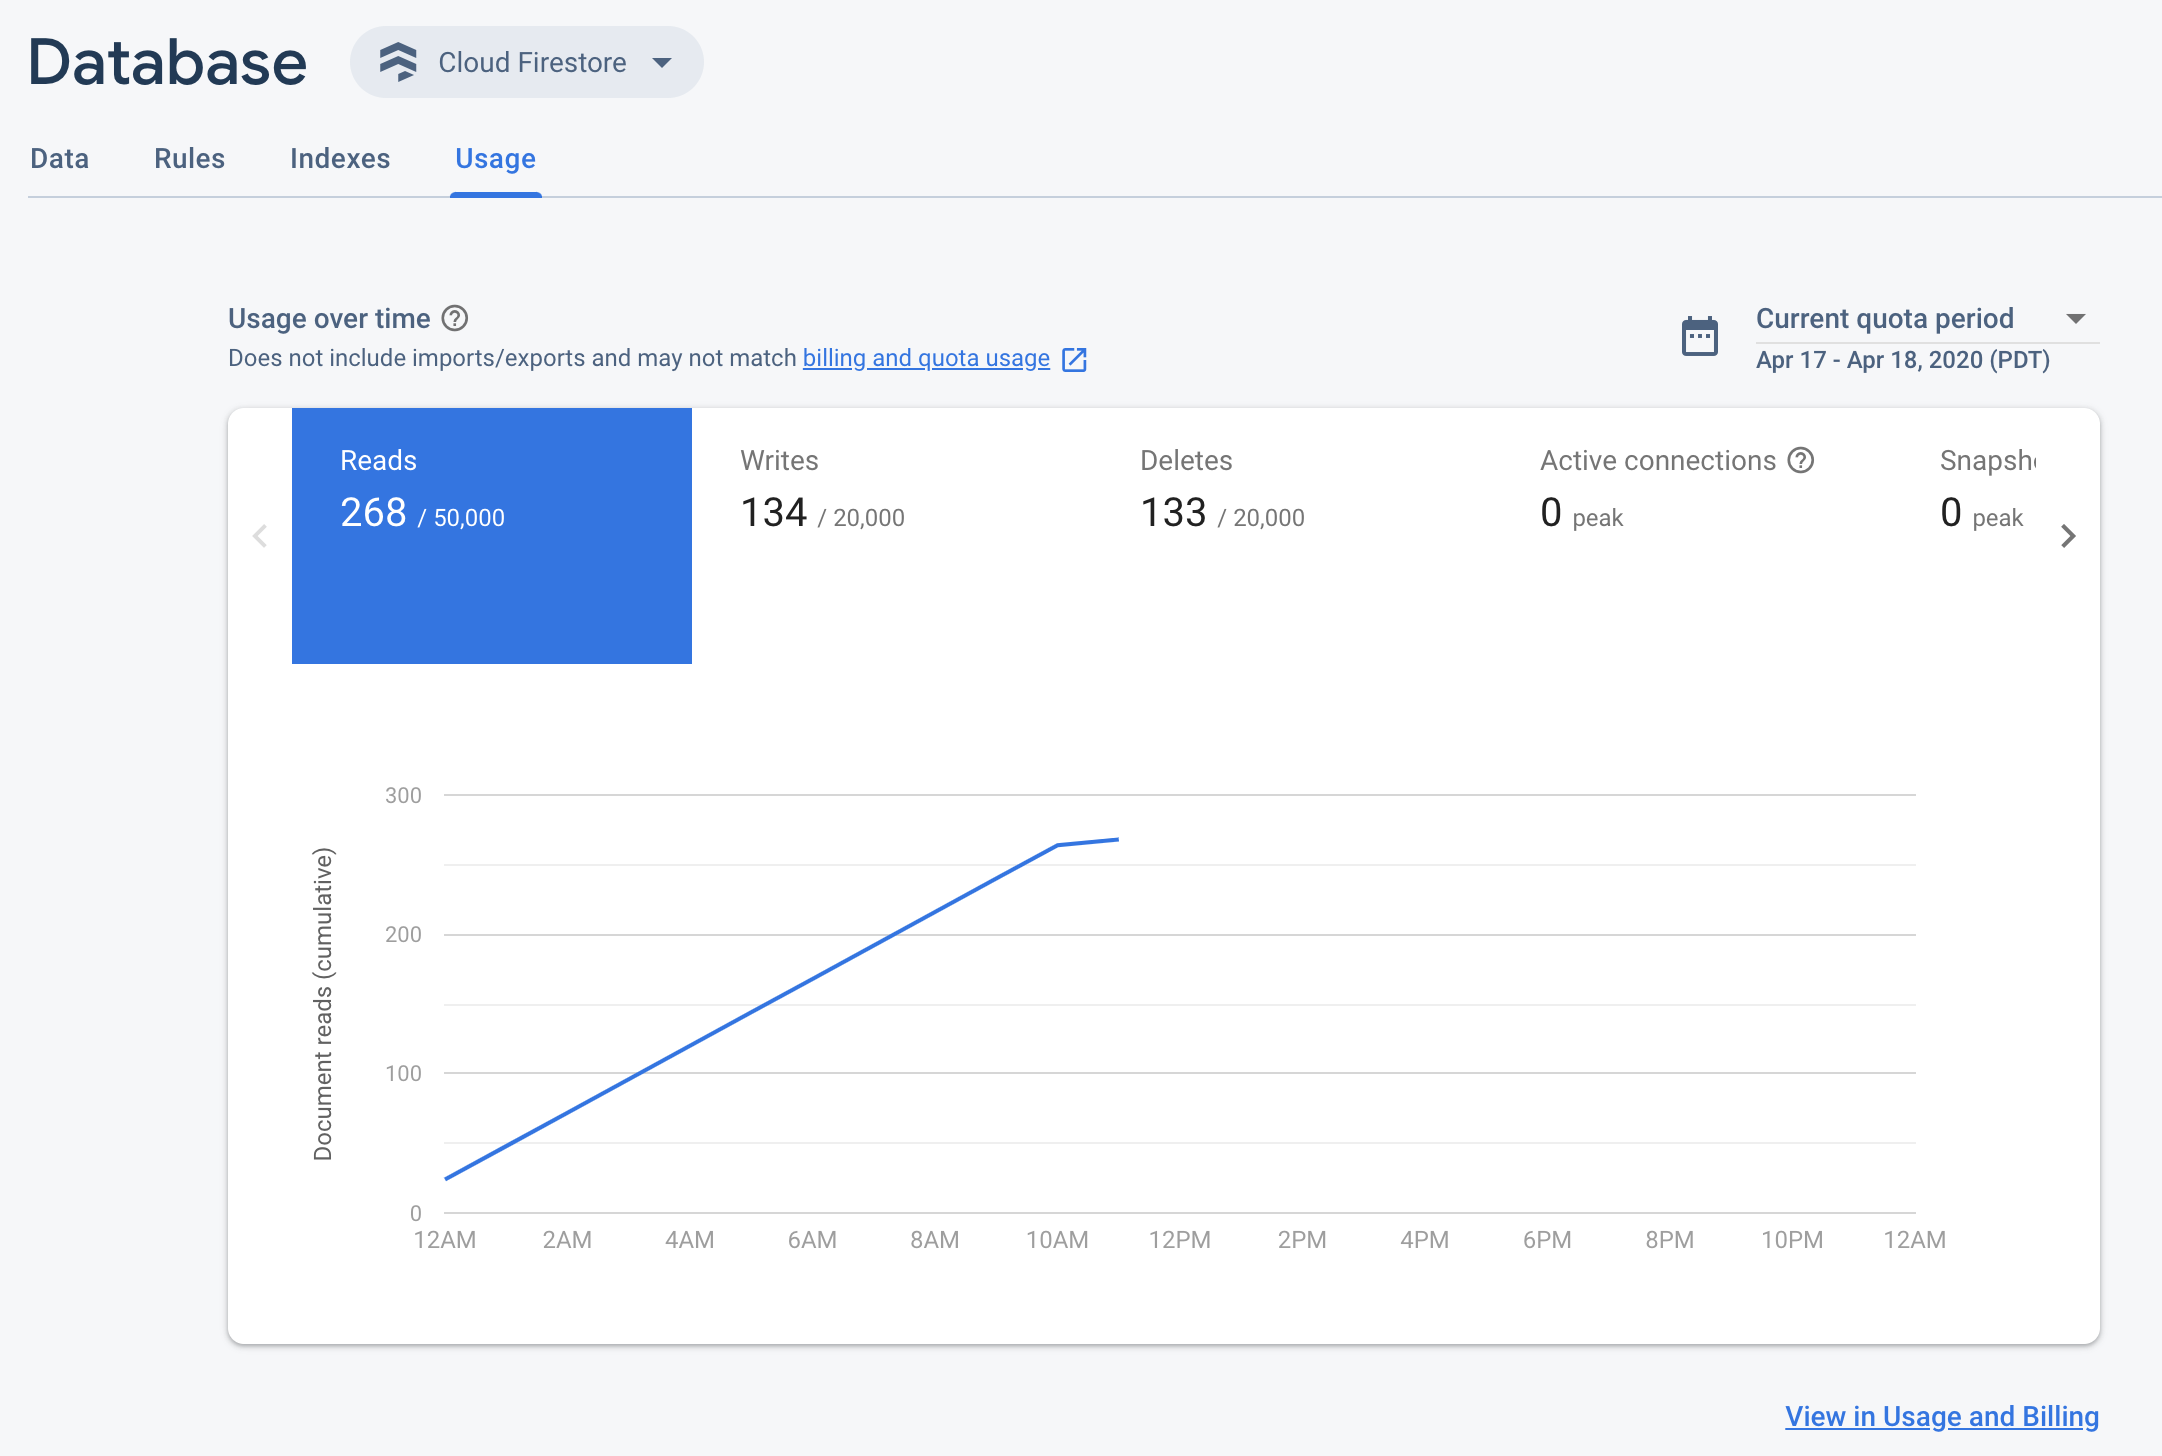
사용량 대시보드 및 결제 보고서
Firebase 및 Cloud Console의 Firestore 사용량 대시보드는 예상 사용량을 제공합니다. 이는 사용량 급증을 식별하는 데 도움이 됩니다. 하지만 대시보드는 청구 작업의 정확한 뷰가 아닙니다. 청구 사용량이 더 높을 수 있습니다. 불일치가 발생하는 경우 언제나 결제 보고서가 사용량 대시보드보다 우선합니다.
사용량 대시보드와 청구 사용량 사이에 불일치를 일으킬 수 있는 작업은 다음과 같습니다.
- 가져오기 및 내보내기 작업 이러한 작업으로 수행되는 읽기 및 쓰기는 사용량 대시보드에 표시되지 않습니다.
- 노옵스(no-ops) 확인 전용 쓰기: 문서의 존재 여부만 확인하는 쓰기는 청구 대상 읽기 작업에 속하지만 쓰기 사용량 대시보드에 각각 'UPDATE_NOOP' 및 'DELETE_NOOP'로 표시됩니다.
- 노옵스(no-ops) 쓰기: 필드 값을 변경하지 않는 업데이트 또는 삭제된 문서에 대한 쓰기 등 데이터베이스가 변경되지 않는 작업은 사용량 대시보드에 'UPDATE_NOOP' 또는 'DELETE_NOOP'로 표시될 수 있습니다. 'NOOP'로 표시되더라도 청구 대상 작업에 속합니다.
축소된 쓰기: 동일한 문서에 여러 번의 쓰기 작업이 연속으로 빠르게 발생하는 경우 사용량 대시보드는 여러 번의 쓰기를 한 번의 쓰기로 축소하여 계산할 수 있습니다. 청구 사용량에서 각각의 쓰기는 별도로 계산됩니다.
또한 사용량 대시보드는 서버 타임스탬프, 숫자 증가, 배열 통합 작업과 같은 필드 변환에 대한 쓰기도 축소합니다. 사용량 대시보드는 필드 변환의 여러 작업을 단일 작업으로 계산할 수 있습니다.
- 0개의 결과를 반환하는 쿼리: 결과가 0개인 쿼리는 읽기 작업 1회에 대한 비용이 발생합니다. 이 사용량에는 요금이 청구되지만 사용량 대시보드에는 표시되지 않습니다.
- 색인 항목 읽기의 읽기 작업. 이 사용량에는 요금이 청구되지만 사용량 대시보드에는 표시되지 않습니다. 예를 들어 집계 쿼리는 읽은 색인 항목에 대해 요금이 청구되지만 이 사용량은 사용량 대시보드에 표시되지 않습니다.
삭제의 사용량 대시보드에는 TTL(수명) 정책에서 수행되는 자동 만료 작업이 캡처되지 않습니다. Cloud Monitoring의 TTL 측정항목을 참조하세요.
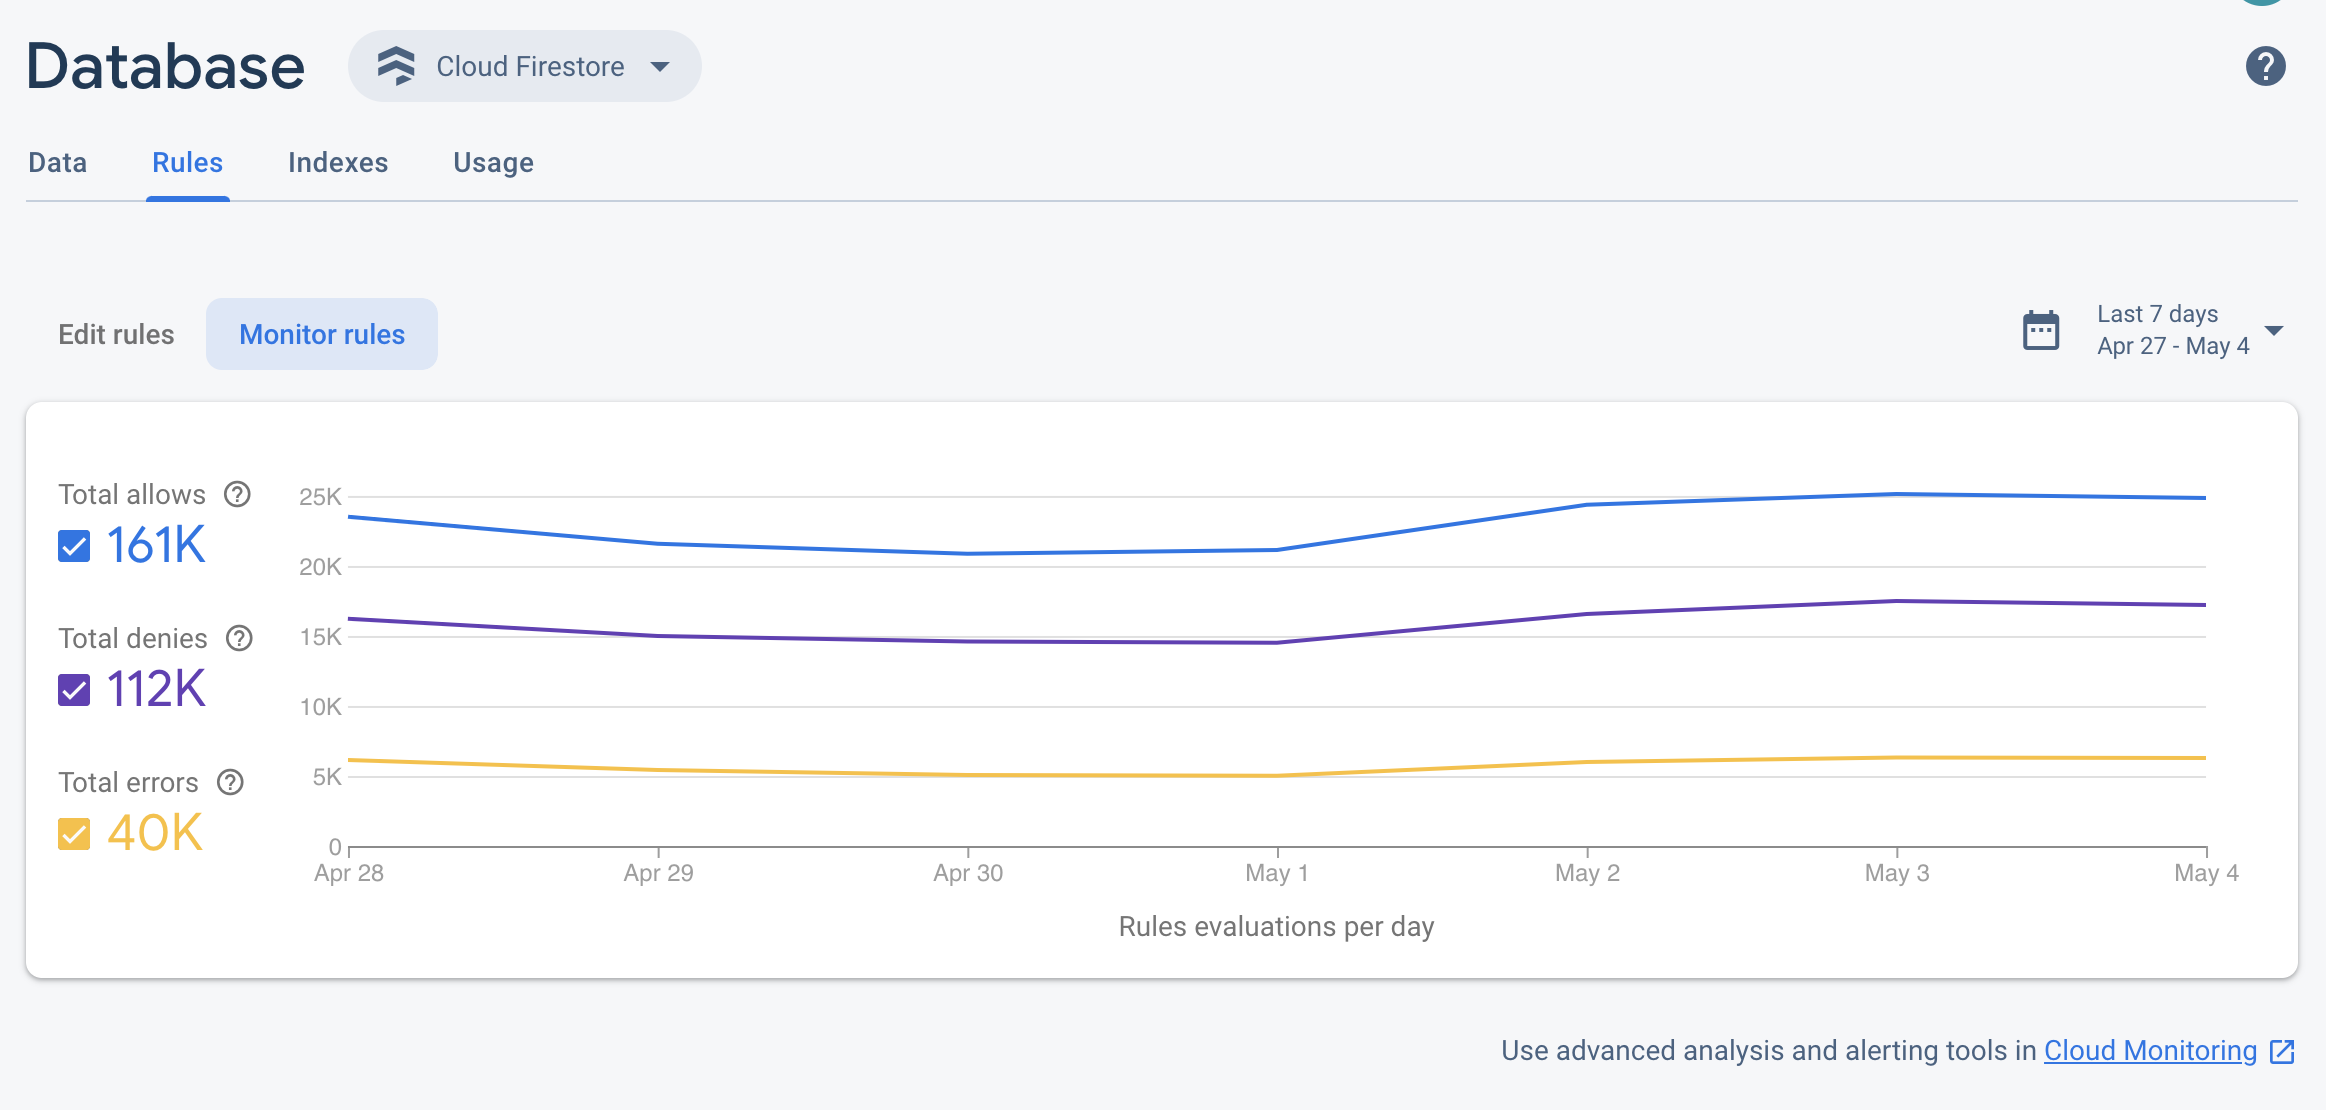
보안 규칙 사용
또한 Firebase Console은 규칙 호출을 한눈에 볼 수 있는 유용한 Firebase 보안 규칙 평가 대시보드를 제공합니다. Cloud Monitoring을 통해 Firebase 보안 규칙 사용량을 모니터링할 수도 있습니다. 이를 통해 동일한 규칙 평가 측정항목을 제공하며, 맞춤 대시보드를 빌드하고, 추세를 분석하고, 알림을 구성할 수 있습니다(예: 거부된 요청이 급증하는 경우). 사용 가능한 측정항목의 전체 목록은 Cloud Monitoring 측정항목 참조를 참고하세요.
Cloud Monitoring 측정항목
Cloud Monitoring은 Google Cloud 제품에서 측정항목, 이벤트, 메타데이터를 수집합니다. Firestore Console의 사용량 대시보드는 동일한 측정항목 데이터를 보고합니다. 커스텀 대시보드와 사용량 알림을 설정하려면 Cloud Monitoring을 사용합니다.
Cloud Monitoring에는 다음 Firestore 측정항목이 포함됩니다.
| 측정항목 이름 | 설명 |
|---|---|
| 문서 읽기 |
성공적인 문서 읽기 횟수입니다. 읽기 유형(LOOKUP 또는 QUERY)에 따라 이 측정항목을 분류할 수 있습니다. 이 측정항목에는 관리형 내보내기 또는 일괄 삭제 작업의 읽기가 포함되지 않습니다. |
| 문서 쓰기 |
성공적인 문서 쓰기 횟수입니다. 쓰기 유형(CREATE 또는 UPDATE)에 따라 측정항목을 분류할 수 있습니다. 이 측정항목에는 가져오기 관리 작업의 쓰기가 포함되지 않습니다. |
| 문서 삭제 | 성공적인 문서 삭제 횟수입니다. |
| 활성 연결 |
데이터베이스에 대한 활성 연결 수입니다. 각 활성 모바일 및 웹 SDK는 여러 스냅샷 리스너 간에 공유할 수 있는 단일 연결을 유지합니다. 서버 클라이언트 라이브러리는 스냅샷 리스너당 하나의 연결을 만듭니다. |
| 스냅샷 리스너 |
모든 활성 연결의 스냅샷 리스너 수입니다. |
| TTL(수명) 삭제 횟수 |
TTL(수명) 정책이 삭제한 총 문서 수입니다. |
| 삭제 지연에 대한 TTL(수명) 만료 |
TTL(수명) 정책에 따라 문서가 만료된 시점과 실제로 삭제된 시점 사이에 경과한 시간입니다. |
- 실시간 업데이트 사용량
활성 연결 및 스냅샷 리스너 측정항목은 실시간 업데이트 사용량을 측정합니다.
사용자가 휴대전화에서 앱을 연다고 가정해 보겠습니다. 그러면 앱이 Firestore에 연결되고 쿼리 10개를 구독합니다. 이 경우 측정항목은 활성 연결 1개와 스냅샷 리스너 10개를 기준으로 증가합니다.
- 샘플링 레이트
Firestore 측정항목은 1분 간격으로 샘플링되지만 업데이트 내용이 대시보드에 표시되는 데 최대 4분이 걸릴 수 있습니다.
지연 시간 측정항목
백엔드 지연 시간 측정항목은 일반적인 Google Cloud firestore 측정항목을 통해 제공됩니다.
예를 들어 p50 지연 시간의 그래프는 Cloud 콘솔의 측정항목 탐색기 뷰에서 확인할 수 있습니다.
Cloud Monitoring 대시보드 설정
사전 정의된 대시보드를 보거나 대시보드를 설정하려면 모니터링 대시보드 사용을 참조하세요.