이전 작업 세부정보 페이지에는 이전 작업의 현재 상태와 진행 상황을 파악하는 데 도움이 되는 여러 다이어그램이 표시됩니다. 마이그레이션 작업에 포함된 각 데이터베이스에 대해 이 다이어그램의 정보를 필터링할 수 있습니다.
그림 1. Database Migration Service의 샘플 관측 가능성 다이어그램
(확대하려면 클릭)
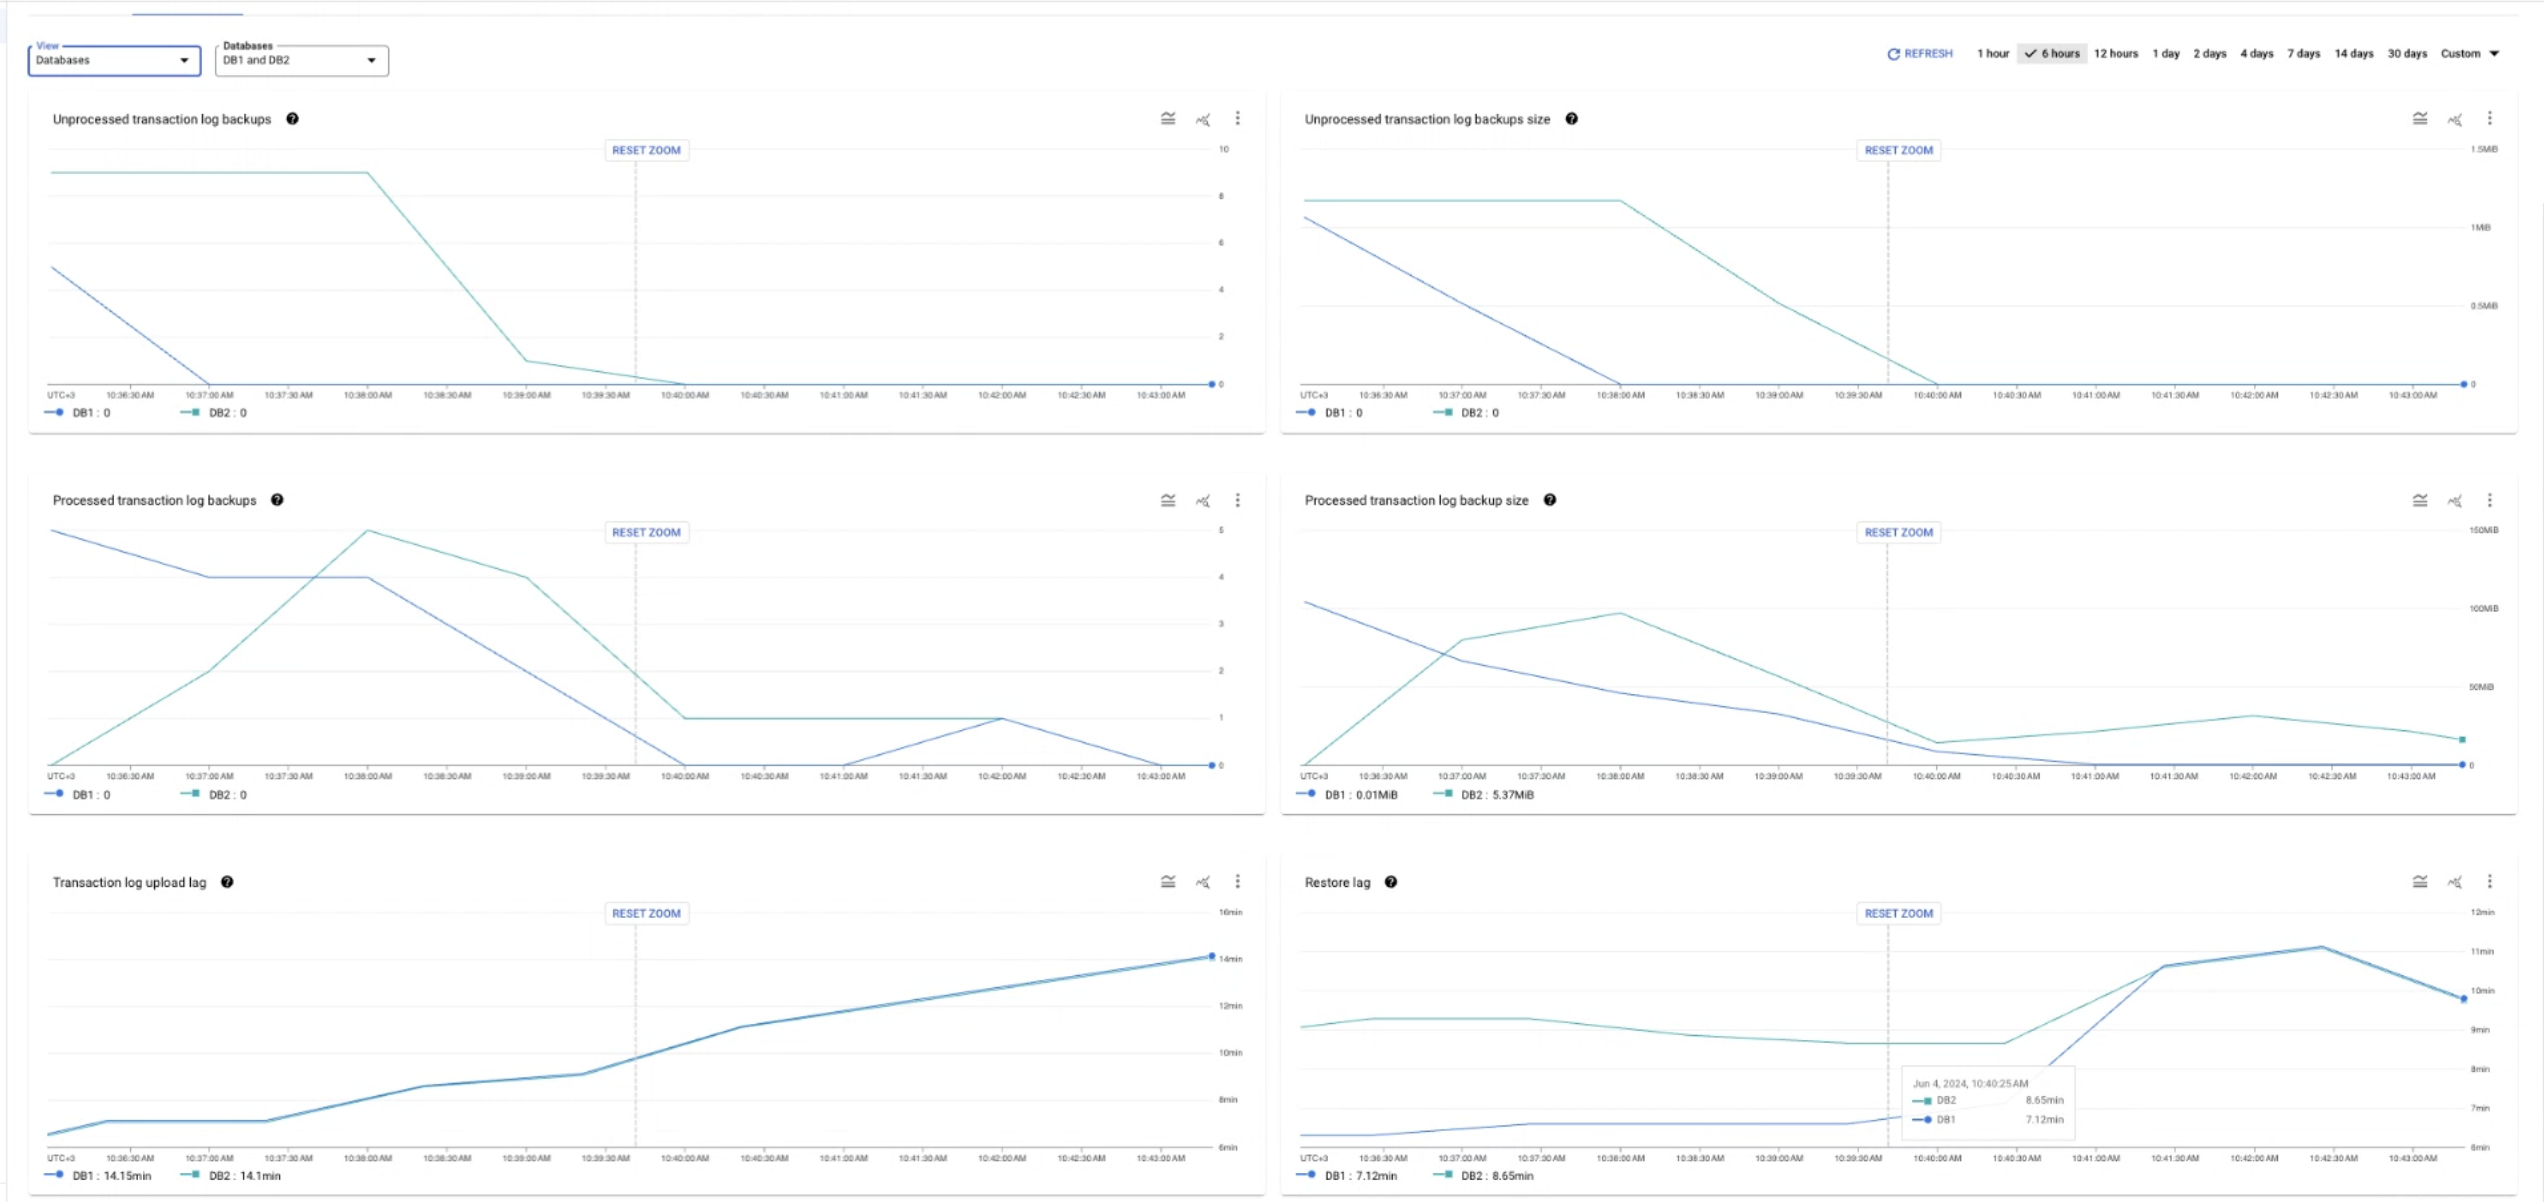
다음 섹션을 펼쳐 각 다이어그램과 연결된 측정항목에 대해 자세히 알아보세요.
복원 지연
복원 지연 다이어그램은 migration_job/max_replica_sec_lag 측정항목을 사용하여 백업 파일 시점 (파일 이름에서 파생됨)과 Cloud SQL 대상 인스턴스에서 해당 파일이 완전히 복원된 시점 간의 시간 차이를 나타냅니다. 이 측정항목은 마이그레이션 작업에 사용하는 모든 유형의 백업 및 트랜잭션 로그 파일 (즉, 전체 백업, 차등 백업 또는 트랜잭션 로그 파일)을 모니터링합니다. 이 정보를 사용하여 평균 데이터 복제 속도를 추정하거나 연속 데이터 복제와 관련된 문제를 해결할 수 있습니다.
이 측정항목은 마이그레이션 작업에 포함된 각 데이터베이스와 마이그레이션 작업에 포함된 모든 데이터베이스의 복원 지연을 보여주는 집계 보기에서 사용할 수 있습니다.
트랜잭션 로그 백업 업로드 지연
트랜잭션 로그 백업 업로드 지연 다이어그램은 migration_job/sqlserver/transaction_log_upload_sec_lag 측정항목을 사용하여 현재와 Cloud Storage에 업로드한 마지막 트랜잭션 로그 파일의 타임스탬프 간에 경과한 시간 (초)을 보여줍니다.
이 측정항목을 사용하여 거래 로그 파일의 자동 업로드와 관련된 문제를 모니터링할 수 있습니다. 시간 차이가 크면 거래 로그 파일이 Cloud Storage 버킷에 업로드되지 않고 있음을 나타낼 수 있습니다.
이 측정항목은 마이그레이션 작업에 포함된 각 데이터베이스와 마이그레이션 작업에 포함된 모든 데이터베이스 중 가장 지연 시간이 긴 데이터베이스를 보여주는 집계 보기에서 사용할 수 있습니다.
처리된 트랜잭션 로그 백업
처리된 트랜잭션 로그 백업 다이어그램은 migration_job/sqlserver/processed_file_count 측정항목을 사용하여 Database Migration Service에서 처리하고 Cloud SQL로 가져온 트랜잭션 로그 백업 파일 수를 나타냅니다.
이 정보는 트랜잭션 로그가 완전히 처리된 후에 업데이트되므로 다이어그램에 표시되는 선은 점진적으로 감소하는 대신 더 큰 폭으로 이동합니다.
이 측정항목을 모니터링하여 증분 로드 단계의 진행 상황을 추적할 수 있습니다. 값이 0보다 크면 이전 작업이 초기 로드 단계를 완료하고 현재 증분 로드 단계에 있음을 나타냅니다.
이 측정항목은 마이그레이션 작업에 포함된 각 데이터베이스와 마이그레이션 작업에 포함된 모든 데이터베이스의 요약을 보여주는 집계 보기에서 사용할 수 있습니다.
처리된 트랜잭션 로그 백업 크기
처리된 트랜잭션 로그 백업 크기 다이어그램은 migration_job/sqlserver/processed_file_bytes_count 측정항목을 사용하여 Database Migration Service가 Cloud SQL 대상 인스턴스에 복제한 트랜잭션 로그 데이터의 크기 (바이트)를 보여줍니다.
이 정보는 트랜잭션 로그가 완전히 처리된 후에 업데이트되므로 다이어그램에 표시되는 선은 점진적으로 감소하는 대신 더 큰 폭으로 이동합니다.
이 측정항목은 마이그레이션 작업에 포함된 각 데이터베이스와 마이그레이션 작업에 포함된 모든 데이터베이스의 요약을 보여주는 집계 보기에서 사용할 수 있습니다.
처리되지 않은 트랜잭션 로그 백업
처리되지 않은 트랜잭션 로그 백업 다이어그램은 migration_job/sqlserver/unprocessed_files 측정항목을 사용하여 Database Migration Service가 소스 Cloud Storage 버킷에서 감지했지만 아직 Cloud SQL 대상 인스턴스에 복제하지 않은 트랜잭션 로그 백업 파일 수를 나타냅니다. 이 정보는 트랜잭션 로그가 완전히 처리된 후에 업데이트되므로 다이어그램에 표시되는 선은 점진적으로 감소하는 대신 더 큰 폭으로 이동합니다.
이 측정항목은 마이그레이션 작업을 완료할 시기를 결정할 때 확인할 수 있습니다.
이전 작업을 승격할 때는 처리되지 않은 트랜잭션 로그 백업 값이 0이 되고 Cloud Storage에 업로드할 트랜잭션 로그 파일이 더 없는 경우입니다.
이 측정항목은 마이그레이션 작업에 포함된 각 데이터베이스와 마이그레이션 작업에 포함된 모든 데이터베이스의 요약을 보여주는 집계 보기에서 사용할 수 있습니다.
처리되지 않은 트랜잭션 로그 백업 크기
처리되지 않은 트랜잭션 로그 백업 크기 다이어그램은 migration_job/sqlserver/unprocessed_file_bytes 측정항목을 사용하여 Database Migration Service가 소스 Cloud Storage 버킷에서 감지했지만 아직 Cloud SQL 대상 인스턴스로 복제하지 않은 데이터의 크기 (바이트)를 보여줍니다. 이 정보는 트랜잭션 로그가 완전히 처리된 후에 업데이트되므로 다이어그램에 표시되는 선은 점진적으로 감소하는 대신 더 큰 폭으로 이동합니다.
이 측정항목은 마이그레이션 작업을 완료할 시기를 결정할 때 확인할 수 있습니다.
이전 작업을 승격할 때는 처리되지 않은 트랜잭션 로그 백업 크기 값이 0이 되고 Cloud Storage에 업로드할 트랜잭션 로그 파일이 더 없는 경우입니다.
이 측정항목은 마이그레이션 작업에 포함된 각 데이터베이스와 마이그레이션 작업에 포함된 모든 데이터베이스의 요약을 보여주는 집계 보기에서 사용할 수 있습니다.
총 대상 스토리지 사용량
총 대상 스토리지 사용량 다이어그램은 Cloud SQL database/disk/bytes_used 측정항목을 사용하여 대상 Cloud SQL 인스턴스의 모든 데이터베이스에 저장된 데이터의 양(바이트)을 보여줍니다. 이 정보를 사용하여 이전 작업의 진행률을 추정할 수 있습니다.
이 측정항목은 집계된 뷰에서만 사용할 수 있습니다. 데이터베이스별 총 디스크 사용량은 필터링할 수 없습니다.
[[["이해하기 쉬움","easyToUnderstand","thumb-up"],["문제가 해결됨","solvedMyProblem","thumb-up"],["기타","otherUp","thumb-up"]],[["이해하기 어려움","hardToUnderstand","thumb-down"],["잘못된 정보 또는 샘플 코드","incorrectInformationOrSampleCode","thumb-down"],["필요한 정보/샘플이 없음","missingTheInformationSamplesINeed","thumb-down"],["번역 문제","translationIssue","thumb-down"],["기타","otherDown","thumb-down"]],["최종 업데이트: 2025-09-05(UTC)"],[[["\u003cp\u003eDatabase Migration Service provides metrics on the migration job details page and in Cloud Monitoring to help track the health and progress of data migration.\u003c/p\u003e\n"],["\u003cp\u003eThe migration job details page includes diagrams like Restore lag, Transaction log backup upload lag, Processed transaction log backups, and Unprocessed transaction log backups, all of which update after a transaction log is processed.\u003c/p\u003e\n"],["\u003cp\u003eKey metrics such as \u003ccode\u003emigration_job/max_replica_sec_lag\u003c/code\u003e (Restore lag) and \u003ccode\u003emigration_job/sqlserver/transaction_log_upload_sec_lag\u003c/code\u003e (Transaction log backup upload lag) are available for each database and in aggregated views.\u003c/p\u003e\n"],["\u003cp\u003eUnprocessed transaction log backups and size metrics can help determine the optimal time to finalize a migration job, which is when these values reach zero and no more files need to be uploaded.\u003c/p\u003e\n"],["\u003cp\u003eCloud Monitoring offers a detailed set of metrics, including \u003ccode\u003emigration_job/max_replica_bytes_lag\u003c/code\u003e and \u003ccode\u003emigration_job/sqlserver/unprocessed_file_bytes\u003c/code\u003e, which can be used to create custom charts and monitor various aspects of the migration process, such as replication lag and unprocessed file data.\u003c/p\u003e\n"]]],[],null,["# Migration job metrics\n\nDatabase Migration Service collects and displays migration job metrics that represent the\nhealth and progress of your data migration process. This page describes the\nfollowing areas associated with migration job metrics:\n\n- [Metrics available on the migration job details page](#job-details-page) covers the\n observability information you can view directly in Database Migration Service\n on the migration job details page.\n\n- [Metrics available in Cloud Monitoring](#monitoring-view) describes all metrics\n related to migration job performance, including the metrics surfaced from\n the Cloud SQL for SQL Server destination instance.\n\nMetrics available on the migration job details page\n---------------------------------------------------\n\nThe migration job details page shows several diagrams that can help you understand\nthe current state and progress of your migration job. You can filter the\ninformation in these diagrams for each database included in your migration job.\n[](#lightbox-trigger) **Figure 1.** Sample observability diagrams in Database Migration Service. (click to enlarge)\n\nExpand the following sections to learn more about each diagram and its associated\nmetric. \n\n#### Restore lag\n\nThe **Restore lag** diagram uses the\n[`migration_job/max_replica_sec_lag`](/monitoring/api/metrics_gcp_d_h#datamigration/migration_job/max_replica_sec_lag) metric to represent the\ntime difference between the backup file epoch (derived from the file name),\nand the moment when that file is fully restored in your Cloud SQL\ndestination instance. This metric monitors all types of backup and transaction\nlog files that you use for a migration job (that is, a full backup, a differential\nbackup, or a transaction log file). You can use this information to estimate\nyour average data replication speed, or to troubleshoot possible issues with\ncontinuous data replication.\n\nThis metric is available for each database included in your migration job,\nand in the aggregated view where it shows restore lag across all\ndatabases included in your migration job. \n\n#### Transaction log backup upload lag\n\nThe **Transaction log backup upload lag** diagram uses the [`migration_job/sqlserver/transaction_log_upload_sec_lag`](/monitoring/api/metrics_gcp_d_h#datamigration/migration_job/sqlserver/transaction_log_upload_sec_lag)\nmetric to show how much time (in seconds) has passed between now and\nthe timestamp of the last transaction log file you uploaded to\nCloud Storage.\nYou can use this metric to monitor possible issues with automated uploads\nof transaction log files: a big time difference could indicate\nthat your transaction log files aren't being uploaded to the Cloud Storage\nbucket.\n\nThis metric is available for each database included in your migration job,\nand in the aggregated view where it shows the highest lag\nacross all databases included in your migration job. \n\n#### Processed transaction log backups\n\nThe **Processed transaction log backups** diagram uses the [`migration_job/sqlserver/processed_file_count`](/monitoring/api/metrics_gcp_d_h#datamigration/migration_job/sqlserver/processed_file_count) metric\nto represent how many transaction log backup files Database Migration Service\nhas processed and imported to Cloud SQL.\nThis information updates after a\ntransaction log is fully processed, so the line displayed on the diagram moves\nin bigger jumps rather than gradual decreases.\n\nYou can monitor this metric to track the progress of the incremental load\nphase. A value greater than 0 indicates that your migration job finished the\ninitial load phase and is now in the incremental load phase.\n\nThis metric is available for each database included in your migration job,\nand in the aggregated view where it shows a summary for all\ndatabases included in your migration job. \n\n#### Processed transaction log backups size\n\nThe **Processed transaction log backups size** diagram uses the\n[`migration_job/sqlserver/processed_file_bytes_count`](/monitoring/api/metrics_gcp_d_h#datamigration/migration_job/sqlserver/processed_file_bytes_count) metric\nto show how much transaction log data (in bytes) Database Migration Service\nhas replicated to your Cloud SQL destination instance.\nThis information updates after a\ntransaction log is fully processed, so the line displayed on the diagram moves\nin bigger jumps rather than gradual decreases.\n\nThis metric is available for each database included in your migration job,\nand in the aggregated view where it shows a summary for all\ndatabases included in your migration job. \n\n#### Unprocessed transaction log backups\n\nThe **Unprocessed transaction log backups** diagram uses the\n[`migration_job/sqlserver/unprocessed_files`](/monitoring/api/metrics_gcp_d_h#datamigration/migration_job/sqlserver/unprocessed_files) metric\nto represent how many transaction log backup files Database Migration Service has detected\nin your source Cloud Storage bucket but has not yet replicated to\nyour Cloud SQL destination instance. This information updates after a\ntransaction log is fully processed, so the line displayed on the diagram moves\nin bigger jumps rather than gradual decreases.\n\nYou can watch this metric when you want to determine when to finalize your\nmigration job. A good time to\n[promote the migration job](/database-migration/docs/sqlserver/finalize-migration) would be when the value of\n**Unprocessed transaction log backups** reaches zero and you don't\nhave more transaction log files to upload to Cloud Storage.\n\nThis metric is available for each database included in your migration job,\nand in the aggregated view where it shows a summary for all\ndatabases included in your migration job. \n\n#### Unprocessed transaction log backups size\n\nThe **Unprocessed transaction log backups size** diagram uses the\n[`migration_job/sqlserver/unprocessed_file_bytes`](/monitoring/api/metrics_gcp_d_h#datamigration/migration_job/sqlserver/unprocessed_file_bytes) metric\nto show how much data (in bytes) Database Migration Service has detected\nin your source Cloud Storage bucket but has not yet replicated to\nyour Cloud SQL destination instance. This information updates after a\ntransaction log is fully processed, so the line displayed on the diagram moves\nin bigger jumps rather than gradual decreases.\n\nYou can watch this metric when you want to determine when to finalize your\nmigration job. A good time to\n[promote the migration job](/database-migration/docs/sqlserver/finalize-migration) would be when the value of\n**Unprocessed transaction log backups size** reaches zero and you don't\nhave more transaction log files to upload to Cloud Storage.\n\nThis metric is available for each database included in your migration job,\nand in the aggregated view where it shows a summary for all\ndatabases included in your migration job. \n\n#### Total destination storage usage\n\nThe **Total destination storage usage** diagram uses the Cloud SQL\n[`database/disk/bytes_used`](/monitoring/api/metrics_gcp_c#cloudsql/database/disk/bytes_used) metric to show how much data\n(in bytes) is stored in all the databases in your destination\nCloud SQL instance. You can use this information to estimate the progress\nof your migration job.\n\nThis metric is only available in the aggregated view. You can't filter the\ntotal disk usage per database. \n\n#### Replication delay\n\nThe **Replication delay** diagram uses the Cloud SQL\n[`per_database/postgresql/external_sync/replication_byte_lag`](/monitoring/api/metrics_gcp_c#cloudsql/per_database/postgresql/external_sync/replication_byte_lag)\nmetric to show the difference (in bytes) between the time an operation was executed on\nthe source and when it was applied to the destination instance.\n\nYou can use this information to ensure data consistency between the source and the destination instance.\n\nThis metric is available for each database included in your migration job,\nand in the aggregated view where it shows a summary for all\ndatabases included in your migration job.\n\n### View metrics on the migration job details page\n\nTo view metric diagrams on the migration job details page, perform the following\nsteps:\n\n1. In the Google Cloud console, go to the **Migration jobs** page.\n\n [Go to Migration jobs](https://console.cloud.google.com/dbmigration/migrations)\n2. In the **Jobs** tab, click the display name of your migration job.\n\n The migration job details page opens.\n3. In the **Databases** section, you can view **Restore lag** and **Unprocessed transaction log backups size** numerical data for each database included in your migration job.\n4. Click the **Monitoring** tab to see the metrics diagrams.\n - You can use the **View** menu to show aggregated data for all databases included in your migration job, or filter the information for specific databases.\n - You can also view each diagram directly in Cloud Monitoring. Click more_vert**More chart options\n \\\u003e View in Metrics Explorer**.\n\nMetrics available in Cloud Monitoring\n-------------------------------------\n\nThe following table describes all migration job metrics you can use to\n[create charts in Metrics Explorer](/monitoring/charts/metrics-explorer)\nfor SQL Server migrations. The\n[complete metrics Database Migration Service metrics reference](/monitoring/api/metrics_gcp)\nlists several additional metrics, but they are not available for SQL Server\nmigrations.\n\nYou can also use the\n[Cloud SQL `cloudsql/database/disk/bytes_used` metric](/monitoring/api/metrics_gcp_c#cloudsql/database/disk/bytes_used)\nand compare it with the total size of your source databases to estimate\nthe migration job progress."]]