Database Migration Service raccoglie e mostra le metriche dei job di migrazione che rappresentano lo stato e l'avanzamento del processo di migrazione dei dati. Questa pagina descrive le seguenti aree associate alle metriche dei job di migrazione:
Metriche disponibili nella pagina dei dettagli del job di migrazione copre le informazioni di osservabilità che puoi visualizzare direttamente in Database Migration Service nella pagina dei dettagli del job di migrazione.
Metriche disponibili in Cloud Monitoring descrive tutte le metriche relative al rendimento del job di migrazione, incluse le metriche visualizzate dal cluster di destinazione PostgreSQL.
Metriche disponibili nella pagina dei dettagli del job di migrazione
La pagina dei dettagli del job di migrazione mostra diversi diagrammi che possono aiutarti a comprendere lo stato attuale e l'avanzamento del job di migrazione. Alcuni diagrammi forniscono informazioni a livello di database, mentre altri si concentrano sui dati a livello di tabella.
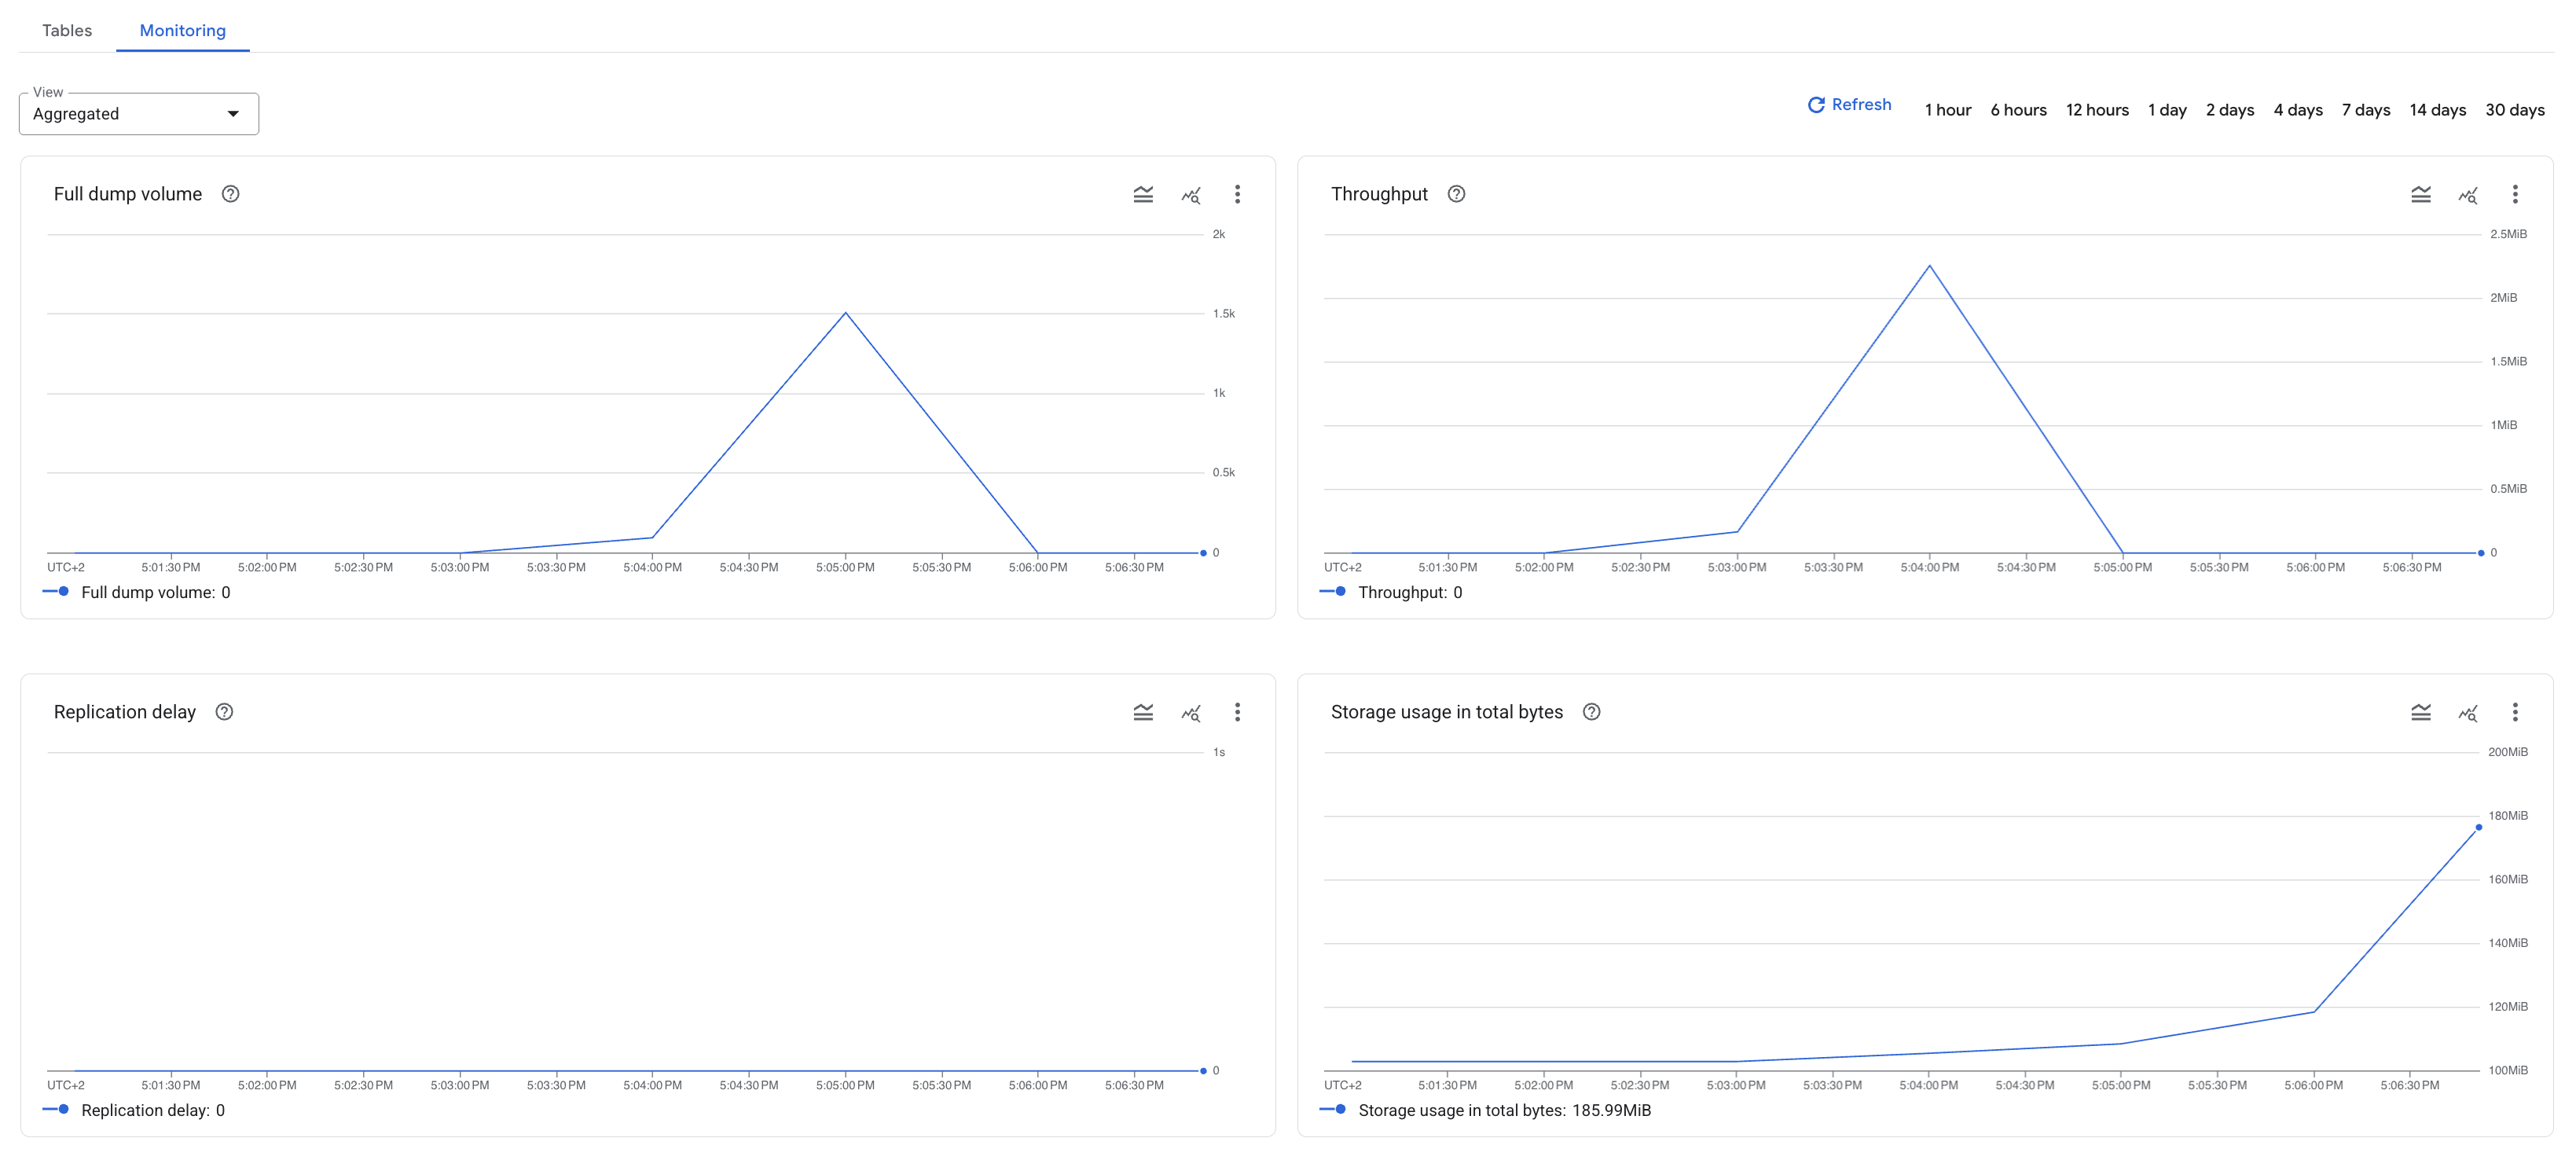
Espandi le sezioni seguenti per saperne di più su ciascun diagramma e sulla relativa metrica.
Throughput
Il diagramma Throughput utilizza la metrica
migration_job/write_bytes_count per rappresentare la quantità di dati (in byte) che Database Migration Service ha scritto nel database di destinazione. Questa metrica viene campionata ogni 60 secondi. Puoi utilizzarlo per osservare
la velocità di scrittura della migrazione.
Questa metrica è disponibile nella visualizzazione aggregata, nonché separatamente per ogni tabella inclusa nel job di migrazione.
Volume del dump completo
Il diagramma Volume di dump completo mostra l'avanzamento della fase di dump completo espresso come percentuale dei dati di dump completo totali di cui è stata eseguita la migrazione. Questa metrica è disponibile nella visualizzazione aggregata, nonché separatamente per ogni tabella inclusa nel job di migrazione.
- Il diagramma della visualizzazione aggregata utilizza la metrica
migration_job/fulldump_progress_percentage. - I diagrammi a livello di tabella utilizzano la metrica
migration_job/fulldump_progress_percentage_per_object.
Utilizzo dello spazio di archiviazione in byte totali
Il diagramma Utilizzo dello spazio di archiviazione in byte totali utilizza la metrica Cloud SQL per PostgreSQL
database/disk/bytes_used per mostrare la quantità di dati
(in byte) archiviati nel database di cui è stata eseguita la migrazione nell'istanza Cloud SQL per PostgreSQL di destinazione. Puoi utilizzare queste informazioni per stimare l'avanzamento
del job di migrazione.
Ritardo di replica
Il diagramma Ritardo di replica utilizza la metrica
migration_job/max_replica_sec_lag per rappresentare
la differenza di tempo tra il momento in cui Database Migration Service inizia
a leggere le informazioni Change Data Capture (CDC) nell'origine e il momento
in cui queste informazioni vengono replicate completamente nella destinazione.
Puoi utilizzare queste informazioni per stimare quando
promuovere il job di migrazione
(vuoi iniziare il processo di interruzione quando il ritardo di replica è minimo).
Visualizzare le metriche nella pagina dei dettagli del job di migrazione
Per visualizzare i diagrammi delle metriche nella pagina dei dettagli del job di migrazione, segui questi passaggi:
- Nella console Google Cloud , vai alla pagina Job di migrazione.
- Nella scheda Job, fai clic sul nome visualizzato del job di migrazione.
Viene visualizzata la pagina dei dettagli del job di migrazione.
-
Nella sezione Monitoraggio, utilizza il menu Visualizza per modificare i diagrammi da visualizzare:
- Per visualizzare le metriche aggregate per l'intero job di migrazione, fai clic su Visualizza > Aggregato.
- Per visualizzare le metriche a livello di tabella, fai clic su Visualizza > Tabelle, quindi seleziona le tabelle.
Metriche disponibili in Cloud Monitoring
La seguente tabella descrive tutte le metriche dei job di migrazione che puoi utilizzare per creare grafici in Esplora metriche per le migrazioni Oracle eterogenee. Il riferimento completo alle metriche di Database Migration Service elenca diverse metriche aggiuntive, ma non sono disponibili per le migrazioni Oracle eterogenee.
Puoi anche utilizzare la
metrica database/disk/bytes_used di Cloud SQL per PostgreSQL
e confrontarla con le dimensioni totali dei database di origine per stimare
l'avanzamento del job di migrazione.
| Tipo di metrica Fase di lancio Nome visualizzato |
|
|---|---|
| Tipo, Tipo, Unità Risorse monitorate |
Descrizione Etichette |
migration_job/fulldump_progress_percentage
BETA
(progetto)
Percentuale di avanzamento del dump completo |
|
GAUGE, DOUBLE, %
datamigration.googleapis.com/MigrationJob |
Percentuale di avanzamento del fulldump iniziale del job di migrazione. Campionamento eseguito ogni 60 secondi. Dopo il campionamento, i dati non sono visibili per un massimo di 180 secondi. |
migration_job/fulldump_progress_percentage_per_object
BETA
(progetto)
Percentuale di avanzamento del dump completo per oggetto |
|
GAUGE, DOUBLE, %
datamigration.googleapis.com/MigrationJob |
Percentuale di avanzamento del dump completo iniziale di una singola tabella in un job di migrazione. Campionamento eseguito ogni 60 secondi. Dopo il campionamento, i dati non sono visibili per un massimo di 180 secondi. |
migration_
BETA
Conteggio byte di scrittura |
|
DELTA, INT64, By
datamigration.googleapis.com/MigrationJob |
Numero di byte scritti nella destinazione. Campionamento eseguito ogni 60 secondi. Dopo il campionamento, i dati non sono visibili per un massimo di 180 secondi.
database: il nome del database.
|
migration_
BETA
Byte di ritardo massimi dei dati del job di migrazione. |
|
GAUGE, INT64, By
datamigration.googleapis.com/MigrationJob |
Ritardo di replica attuale, aggregato in tutti i dati del job di migrazione. Campionamento eseguito ogni 60 secondi. Dopo il campionamento, i dati non sono visibili per un massimo di 180 secondi.
database: il nome del database.
|
migration_
BETA
Ritardo massimo in secondi dei dati del job di migrazione |
|
GAUGE, INT64, s
datamigration.googleapis.com/MigrationJob |
Ritardo di replica attuale, aggregato in tutti i dati del job di migrazione. Campionamento eseguito ogni 60 secondi. Dopo il campionamento, i dati non sono visibili per un massimo di 180 secondi.
database: il nome del database.
|
migration_job/unsupported_events_count
BETA
(progetto)
Conteggio eventi non supportati |
|
DELTA, INT64, By
datamigration.googleapis.com/MigrationJob |
Numero di eventi non supportati per migrazione e per tabella. Campionamento eseguito ogni 60 secondi. Dopo il campionamento, i dati non sono visibili per un massimo di 180 secondi. |