마이그레이션 작업 세부정보 페이지에는 마이그레이션 작업의 현재 상태와 진행 상황을 이해하는 데 도움이 되는 여러 다이어그램이 표시됩니다. 마이그레이션 작업에 포함된 각 데이터베이스에 대해 이러한 다이어그램의 정보를 필터링할 수 있습니다.
그림 1. Database Migration Service의 샘플 관측 가능성 다이어그램
(확대하려면 클릭)
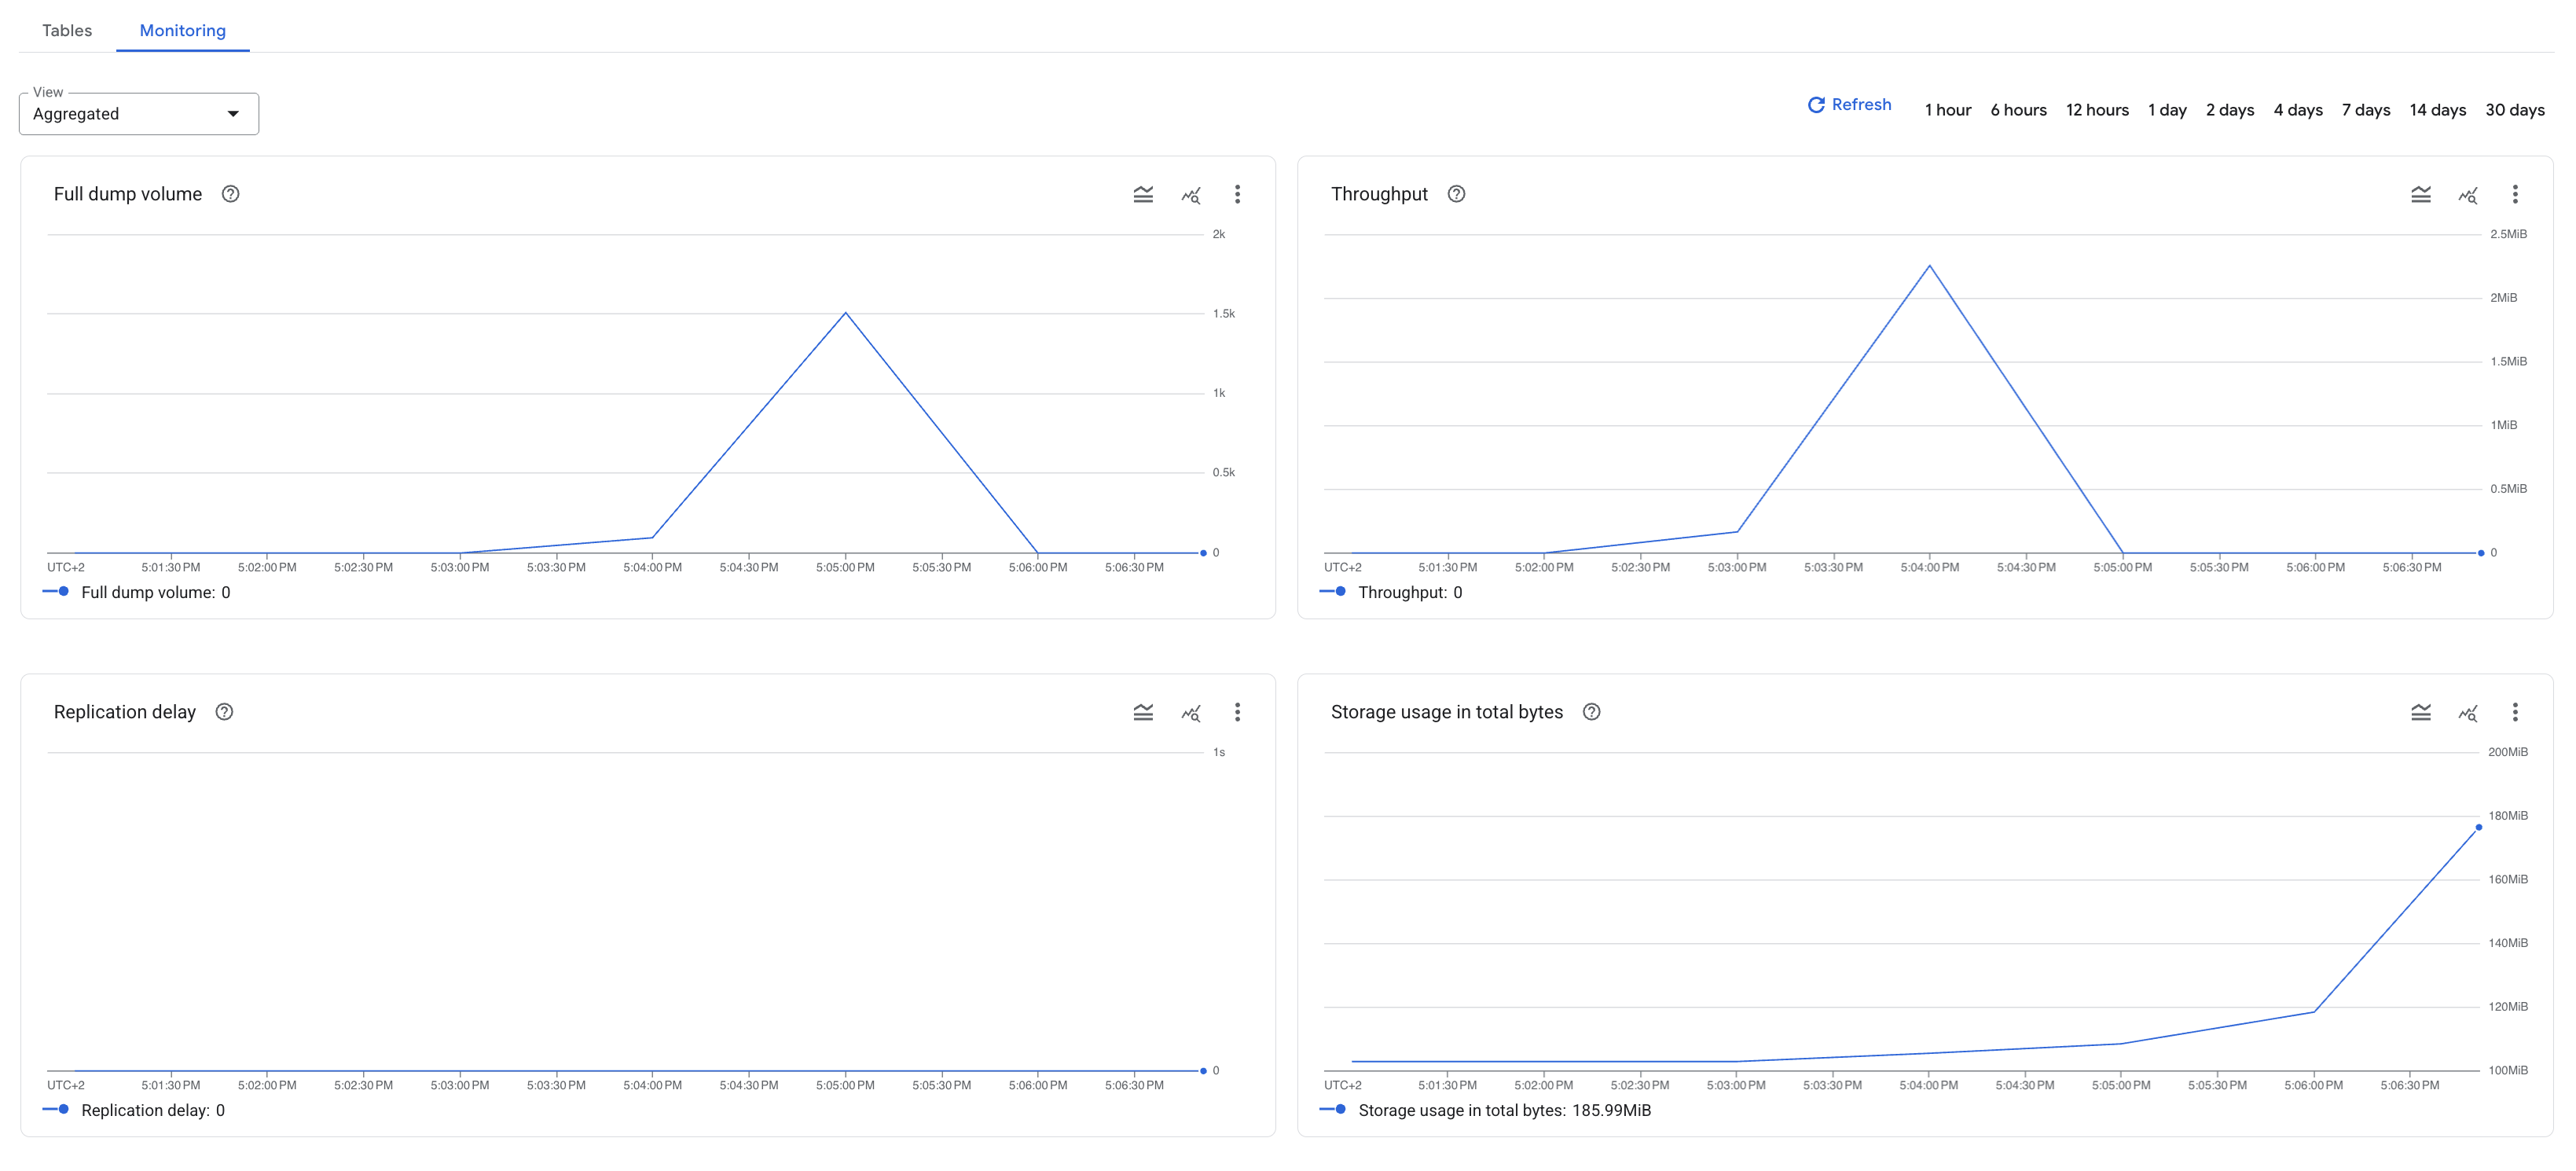
다음 섹션을 펼쳐 각 다이어그램과 연결된 측정항목에 대해 자세히 알아보세요. Database Migration Service는 이기종 Oracle 마이그레이션의 경우 단일 데이터베이스를 마이그레이션합니다. 각 측정항목은 마이그레이션하는 데이터베이스와 관련된 데이터를 나타냅니다.
처리량
처리량 다이어그램은 migration_job/write_bytes_count 측정항목을 사용하여 Database Migration Service가 대상 데이터베이스에 쓴 데이터의 양 (바이트)을 나타냅니다. 이 측정항목은 60초마다 샘플링됩니다. 이를 사용하여 마이그레이션의 쓰기 속도를 관찰할 수 있습니다.
총 스토리지 사용량(바이트)
총 바이트 단위 스토리지 사용량 다이어그램은 Cloud SQL database/disk/bytes_used 측정항목을 사용하여 대상 Cloud SQL 인스턴스의 이전된 데이터베이스에 저장된 데이터의 양(바이트)을 보여줍니다. 이 정보를 사용하여 마이그레이션 작업의 진행 상황을 추정할 수 있습니다.
복제 지연
복제 지연 다이어그램은 migration_job/max_replica_sec_lag 측정항목을 사용하여 Database Migration Service가 소스에서 변경 데이터 캡처 (CDC) 정보 읽기를 시작한 시점과 해당 정보가 대상에 완전히 복제된 시점 간의 시간 차이를 나타냅니다.
이 정보를 사용하여
마이그레이션 작업을 승격할 시점을 추정할 수 있습니다(복제 지연 시간이 가장 낮을 때 차단 프로세스를 시작하는 것이 좋습니다).
[[["이해하기 쉬움","easyToUnderstand","thumb-up"],["문제가 해결됨","solvedMyProblem","thumb-up"],["기타","otherUp","thumb-up"]],[["이해하기 어려움","hardToUnderstand","thumb-down"],["잘못된 정보 또는 샘플 코드","incorrectInformationOrSampleCode","thumb-down"],["필요한 정보/샘플이 없음","missingTheInformationSamplesINeed","thumb-down"],["번역 문제","translationIssue","thumb-down"],["기타","otherDown","thumb-down"]],["최종 업데이트: 2025-09-05(UTC)"],[[["\u003cp\u003eDatabase Migration Service provides metrics to monitor the health and progress of data migration jobs.\u003c/p\u003e\n"],["\u003cp\u003eThe replication delay metric is crucial for continuous migrations, indicating the lag between source and target databases.\u003c/p\u003e\n"],["\u003cp\u003eA replication delay of zero is necessary at the time of promotion to prevent data loss during a continuous migration.\u003c/p\u003e\n"],["\u003cp\u003eThe replication delay metric is only applicable during the incremental load phase of the migration.\u003c/p\u003e\n"]]],[],null,["Database Migration Service collects and displays migration job metrics that represent the\nhealth and progress of your data migration process. This page describes the\nfollowing areas associated with migration job metrics:\n\n- [Metrics available on the migration job details page](#job-details-page) covers the\n observability information you can view directly in Database Migration Service\n on the migration job details page.\n\n- [Metrics available in Cloud Monitoring](#monitoring-view) describes all metrics\n related to migration job performance, including the metrics surfaced from\n the PostgreSQL destination cluster.\n\nMetrics available on the migration job details page\n\nThe migration job details page shows several diagrams that can help you understand\nthe current state and progress of your migration job. Some diagrams provide\ndatabase-level information, while others focus on table-level data.\n[](#lightbox-trigger) **Figure 1.** Sample observability diagrams in Database Migration Service. (click to enlarge)\n\nExpand the following sections to learn more about each diagram and its associated\nmetric. \n\nThroughput\n\nThe **Throughput** diagram uses the\n[`migration_job/write_bytes_count`](/monitoring/api/metrics_gcp_d_h#datamigration/migration_job/write_bytes_count) metric to represent\nhow much data (in bytes) Database Migration Service has written to your destination\ndatabase. This metric is sampled every 60 seconds. You can use it to observe\nthe write speed of your migration.\n\nThis metric is available in the aggregated view, as well as separately\nfor each table included in your migration job.\n\nFull dump volume\n\nThe **Full dump volume** diagram shows the progress of the full dump phase\nexpressed as the percentage of total full dump data migrated.\nThis metric is available in the aggregated view, as well as separately\nfor each table included in your migration job.\n\n- The aggregated view diagram uses the `migration_job/fulldump_progress_percentage` metric.\n- The table-level diagrams use the `migration_job/fulldump_progress_percentage_per_object` metric.\n\nStorage usage in total bytes\n\nThe **Storage usage in total bytes** diagram uses the Cloud SQL for PostgreSQL\n[`database/disk/bytes_used`](/monitoring/api/metrics_gcp_c#cloudsql/database/disk/bytes_used) metric to show how much data\n(in bytes) is stored in the migrated database in your destination\nCloud SQL for PostgreSQL instance. You can use this information to estimate the progress\nof your migration job.\n\nReplication delay\n\nThe **Replication delay** diagram uses the\n[`migration_job/max_replica_sec_lag`](/monitoring/api/metrics_gcp_d_h#datamigration/migration_job/max_replica_sec_lag) metric to represent\nthe time difference between the moment when Database Migration Service starts\nreading Change Data Capture (CDC) information in your source, and the moment\nwhen that information is fully replicated in your destination.\nYou can use this information to estimate when to\n[promote the migration job](/database-migration/docs/oracle-to-postgresql/finalize-migration)\n(you want to begin the cutoff process when replication lag is the lowest).\n\nView metrics on the migration job details page\n\nTo view metric diagrams on the migration job details page, perform the following\nsteps:\n\n1. In the Google Cloud console, go to the **Migration jobs** page.\n\n [Go to Migration jobs](https://console.cloud.google.com/dbmigration/migrations)\n2. In the **Jobs** tab, click the display name of your migration job.\n\n The migration job details page opens.\n3. In the **Monitoring** section, use the **View** menu to adjust\n which diagrams you want to display:\n\n - To view metrics aggregated for the whole migration job, click **View** \\\u003e **Aggregated**.\n - To view table-level metrics, click **View** \\\u003e **Tables**, and then select your tables.\n\nMetrics available in Cloud Monitoring\n\nThe following table describes all migration job metrics you can use to\n[create charts in Metrics Explorer](/monitoring/charts/metrics-explorer)\nfor heterogeneous Oracle migrations. The\n[complete metrics Database Migration Service metrics reference](/monitoring/api/metrics_gcp)\nlists several additional metrics, but they are not available for\nheterogeneous Oracle migrations.\n\nYou can also use the\n[Cloud SQL for PostgreSQL `database/disk/bytes_used` metric](/monitoring/api/metrics_gcp_c#cloudsql/database/disk/bytes_used)\nand compare it with the total size of your source databases to estimate\nthe migration job progress.\n\n| Metric type ^Launch stage^ Display name ||\n| Kind, Type, Unit Monitored resources | *Description* Labels |\n|-------------------------------------------------------------------------------------------------------------------------------------------------|-----------------------------------------------------------------------------------------------------------------------------------------------------------------------------------------------|\n| `migration_job/fulldump_progress_percentage` ^BETA^ ***(project)*** Fulldump progress percentage ||\n| `GAUGE`, `DOUBLE`, `%` **[datamigration.googleapis.com/MigrationJob](/monitoring/api/resources#tag_datamigration.googleapis.com/MigrationJob)** | *Progress percentage of the initial fulldump of the migration job.. Sampled every 60 seconds. After sampling, data is not visible for up to 180 seconds.* |\n| `migration_job/fulldump_progress_percentage_per_object` ^BETA^ ***(project)*** Fulldump progress percentage per object ||\n| `GAUGE`, `DOUBLE`, `%` **[datamigration.googleapis.com/MigrationJob](/monitoring/api/resources#tag_datamigration.googleapis.com/MigrationJob)** | *Progress percentage of the initial fulldump of a single table in a migration job. Sampled every 60 seconds. After sampling, data is not visible for up to 180 seconds.* |\n| `migration_``job/``write_``bytes_``count` ^BETA^ Write Bytes Count ||\n| `DELTA`, `INT64`, `By` **[datamigration.googleapis.com/MigrationJob](/monitoring/api/resources#tag_datamigration.googleapis.com/MigrationJob)** | *Number of bytes written to the destination. Sampled every 60 seconds. After sampling, data is not visible for up to 180 seconds.* `database`: Database name. |\n| `migration_``job/``max_``replica_``bytes_``lag` ^BETA^ Max lag bytes of the migration job data. ||\n| `GAUGE`, `INT64`, `By` **[datamigration.googleapis.com/MigrationJob](/monitoring/api/resources#tag_datamigration.googleapis.com/MigrationJob)** | *Current replication lag, aggregated across all of the migration job's data. Sampled every 60 seconds. After sampling, data is not visible for up to 180 seconds.* `database`: Database name. |\n| `migration_``job/``max_``replica_``sec_``lag` ^BETA^ Max lag in seconds of the migration job data ||\n| `GAUGE`, `INT64`, `s` **[datamigration.googleapis.com/MigrationJob](/monitoring/api/resources#tag_datamigration.googleapis.com/MigrationJob)** | *Current replication lag, aggregated across all of the migration job's data. Sampled every 60 seconds. After sampling, data is not visible for up to 180 seconds.* `database`: Database name. |\n| `migration_job/unsupported_events_count` ^BETA^ ***(project)*** Unsupported Events Count ||\n| `DELTA`, `INT64`, `By` **[datamigration.googleapis.com/MigrationJob](/monitoring/api/resources#tag_datamigration.googleapis.com/MigrationJob)** | *Number of unsupported events per migration and per table. Sampled every 60 seconds. After sampling, data is not visible for up to 180 seconds.* |"]]