To create a dashboard from a Look or an Explore:
Open a Look or an Explore.
Click on the gear in the dashboard content navigation bar. A menu will open.
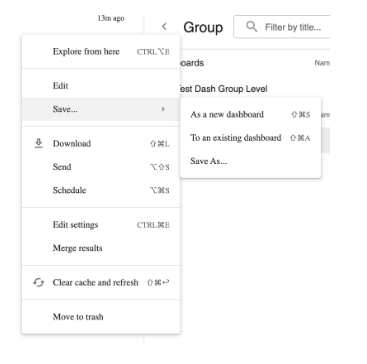
Select Save from the menu.
Select As new dashboard from the submenu.
This opens a Save as a new Dashboard window.
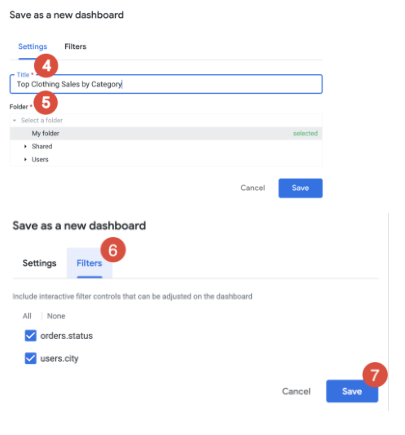
On the Settings tab in the Title field, enter a name for your new dashboard.
The name that you enter applies to both the tile and the dashboard. You can modify title names at any time. To change the tile name for a query tile, see the Editing a query tile title subsection on the Editing user-defined dashboards documentation page. To change the dashboard name, enter edit mode on the dashboard.
Select the folder where you want to save your dashboard. You must have the Manage Access, Edit access level for the folder.
On the Filters tab, select whether to use the Look's or Explore's filters as the dashboard filters. Custom filters can't become dashboard filters, but they do remain as tile filters.
Click Save.
The Look or Explore will be saved as a query tile on the dashboard.
Adding tiles and text to a dashboard
Once you've created a dashboard, the next step is to add tiles and text to the dashboard.
The first tile you add to a dashboard takes up the entire width of the dashboard. Additional tiles you add are sized to one-third of the dashboard's width and are added horizontally under the first tile. Additional rows of tiles are added as necessary. You can move and resize tiles however you like. You can also edit tiles once you've created them to adjust the names of the tiles, the visualizations, or the underlying queries or Looks.
For any new tiles that are added to a dashboard, if they were created from the same Explore as a dashboard filter, the dashboard filter is automatically applied to that tile.
Types of dashboard tiles
There are two types of tiles you can add to a dashboard:
Look-linked tiles
Text tiles
Look-linked tiles
Look-linked tiles are added to a dashboard from a Look.
A Look-linked tile links the tile's underlying query to a Look. That Look is used when creating the tile and every time the dashboard is refreshed. The Look and the dashboard must be in the same folder. If you want to add Looks from a different folder, first copy the Look into the same folder as the dashboard.
A Look-linked tile is a good choice if you want to create, change, and test a query in one place but use it in multiple dashboards. If the Look changes, any tiles linked to that Look change. If the Look is deleted, dashboards show an error for the tile.
Text tiles
Text tiles are built directly within a dashboard.
You can use text tiles to define visual sections on a dashboard and to add descriptions. Text tiles in dashboards are designed to have flexible formatting and to default to look more like headings and descriptions than tiles.
There are two types of text tiles, each of which offers a different editing experience but results in the same kind of tile:
Text: a dashboard text tile that provides a visual editing experience
Markdown: our pre-existing text tile option, which lets you use some HTML and a subset of the Markdown markup language to style the output of the tile