Advancing cancer research with public imaging datasets from the National Cancer Institute Imaging Data Commons
Andrey Fedorov, PhD
Associate Professor in Radiology, Brigham and Women’s Hospital, Harvard Medical
Alicia Williams
Developer Advocate, Google Cloud
Get started with the National Cancer Institute Imaging Data Commons data, hosted by the Google Cloud Public Dataset Program.
Medical imaging offers remarkable opportunities in research for advancing our understanding of cancer, discovering new non-invasive methods for its detection, and improving overall patient care. Advancements in artificial intelligence (AI), in particular, have been key in unlocking our ability to use this imaging data as part of cancer research. Development of AI-powered research approaches, however, requires access to large quantities of high quality imaging data.
The US National Cancer Institute (NCI) has long prioritized collection, curation, and dissemination of comprehensive, publicly available cancer imaging datasets. Initiatives like The Cancer Genome Atlas (TCGA) and Human Tumor Atlas Network (HTAN) (to name a few) work to make robust, standardized datasets easily accessible to anyone interested in contributing their expertise: students learning the basics of AI, engineers developing commercial AI products, researchers developing innovative proposals for image analysis, and of course the funders evaluating those proposals.
Even so, there continue to be challenges that complicate sharing and analysis of imaging data:
Data is spread across a variety of repositories, which means replicating data to bring it together or within reach of tooling (such as cloud-based resources).
Images are often stored in vendor-specific or specialized research formats which complicates analysis workflows and increases maintenance costs.
Lack of a common data model or tooling make capabilities such as search, visualization, and analysis of data difficult and repository- or dataset-specific.
Achieving reproducibility of the analysis workflows, a critical function in research, is challenging and often lacking in practice.
Introducing Imaging Data Commons
To address these issues, as part of the Cancer Research Data Commons (CRDC) initiative that establishes the national cancer research ecosystem, NCI launched the Imaging Data Commons (IDC), a cloud-based repository of publicly available cancer imaging data with several key advantages:
Colocation: Image files are curated into Google Cloud Storage buckets, side-by-side with on-demand computational resources and cloud-based tools, making it easier and faster for you to access and analyze.
Format: Images, annotations and analysis results are harmonized into the standard DICOM (Data Imaging and Communications and Medicine) format to improve interoperability with tools and support uniform processing pipelines.
Tooling: IDC maintains tools that - without having to download anything - allow you to explore and search the data, and visualize images and annotations. You can easily access IDC data from the cloud-based tools available in Google Cloud, such as Vertex AI, Colab, or deploy your own tools in highly configurable virtual environments.
Reproducibility: Sharing reproducible analysis workflows is streamlined through maintaining persistent versioned data that you can use to precisely define cohorts used to train or validate algorithms, which in turn can be deployed in virtual environments that can provide consistent software and hardware configuration.
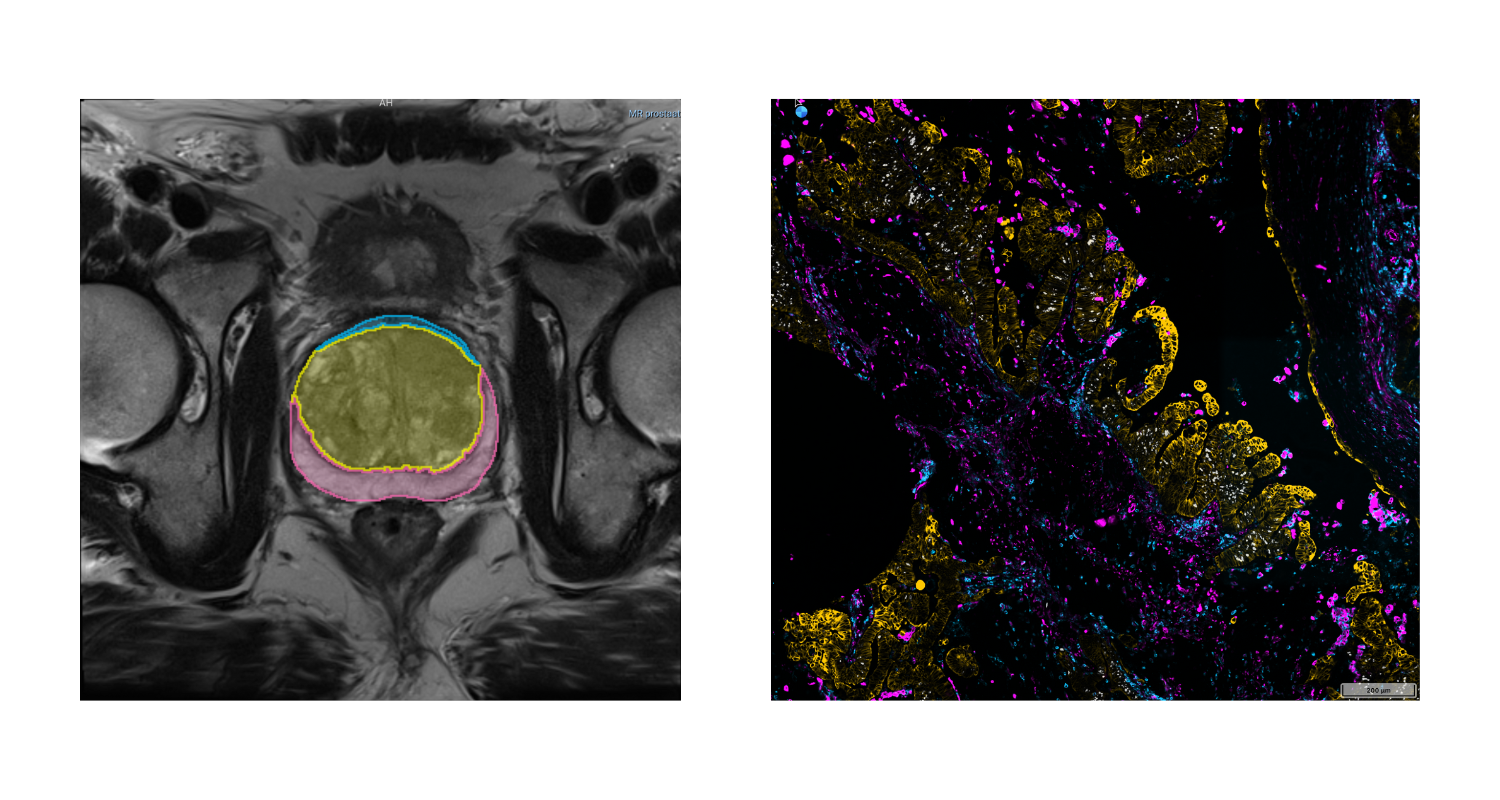
IDC ingests and harmonizes de-identified data from a growing list of repositories and initiatives, spanning a broad range of image types and scales, cancer types, and manufacturers. A significant portion of these images are accompanied by annotations and clinical data.
For a quick summary of what is available in IDC, check the IDC Portal or this Looker Studio dashboard!
Exploring the IDC data
IDC Portal
A great place to start exploring the data is the IDC Portal. From this in-browser portal, you can use some of the key metadata attributes to navigate the images and visualize them.
As an example, here are the steps you can follow to find slide microscopy images for patients with lung cancer:
From the IDC Portal, proceed to “Explore images”.
In the top right portion of the exploration screen, use the summary pie chart to select Chest primary site (you could alternatively select Lung, noting that annotation of cancer location can use different terms).
In the same pie chart summary section, navigate to Modality and select Slide Microscopy.
In the right-hand panel, scroll to the Collections section, which will now list all collections containing relevant images. Select one or more collections using the checkboxes.
Navigate to the Selected Cases section just below, where you will find a list of patients within the selected collections that meet the search criteria.
Next, select a given patient using the checkbox. Navigating to the Selected Studies section just below will now show the list of studies - think of these as specific imaging exams available for this patient. Click the “eye” icon on the far right which will open the viewer allowing you to see the images themselves.
BigQuery Public Dataset
When it's time to search and select the subsets (or cohorts) of the data that you need to support your analysis more precisely, you'll head to the public dataset in BigQuery. This dataset contains the comprehensive set of metadata available for the IDC images (beyond the subset contained in the IDC portal), which you can use to precisely define your target data subset with a custom, standard SQL query.
You can run these queries from the in-browser BigQuery Console by creating a BigQuery sandbox. The BigQuery sandbox enables you to query data within the limits of the Google Cloud free tier without needing a credit card. If you decide to enable billing and go above the free tier threshold, you are subject to regular BigQuery pricing. However, we expect most researchers' needs will fit within this tier.
To get started with an exploratory query, you can select studies corresponding to the same criteria you just used in your exploration of the IDC Portal:
Alright now you're ready to write a query that creates precisely defined cohorts. This time we'll shift from exploring digital pathology images to subsetting Computed Tomography (CT) scans that meet certain criteria.
The following query selects all files, identified by their unique storage path in the gcs_url column, and corresponding to CT series that have SliceThickness between 0 and 1 mm. It also builds a URL in series_viewer_url that you can follow to visualize the series in the IDC Portal viewer. For the sake of this example, the results are limited to only one series.
As you start to write more complex queries, it will be important to familiarize yourself with the DICOM format, and how it is connected with the IDC dataset. This getting started tutorial is a great place to start learning more.
What can you do with the results of these queries? For example:
You can build the URL to open the IDC Portal viewer and examine individual studies, as we demonstrated in the second query above.
You can learn more about the patients and studies that meet this search criteria by exploring what annotations or clinical data available accompanying these images. The getting started tutorial provides several example queries along these lines.
You can link DICOM metadata describing imaging collections with related clinical information, which is linked when available. This notebook can help in navigating clinical data available for IDC collections.
Finally, you can download all images contained in the resulting studies. Thanks to the support of Google Cloud Public Dataset Program, you are able to download IDC image files from Cloud Storage without cost.
Integrating with other Cloud tools
There are several Cloud tools we want to mention that can help in your explorations of the IDC data:
Colab: Colab is a hosted Jupyter notebook solution that allows you to write and share notebooks that combine text and code, download images from IDC, and execute the code in the cloud with a free virtual machine. You can expand beyond the free tier to use custom VMs or NVIDIA GPUs, while still controlling costs with fixed monthly pricing plans. Notebooks can easily be shared with colleagues (such as readers of your academic manuscript). Check out these example Colab notebooks to help you get started.
Vertex AI: Vertex AI is a platform to handle all the steps of the ML workflow. Again, it includes managed Jupyter notebooks, but with more control over the environment and hardware you use. As part of Google Cloud, it also comes with enterprise-grade security, which may be important to your use case, especially if you are joining in your own proprietary data. Its Experiments functionality allows you to automatically track architectures, hyperparameters, and training environments, to help you discover the optimal ML model faster.
Looker Studio: Looker Studio is a platform for developing and sharing custom interactive dashboards. You can create dashboards that are focused on a specific subset of metadata accompanying the images and cater to the users that prefer interactive interface over the SQL queries. As an example, this dashboard provides a summary of IDC data, and this dashboard focuses on the preclinical datasets within the IDC.
Cloud Healthcare API: IDC relies on Cloud Healthcare API to extract and manage DICOM metadata with BigQuery, and to maintain DICOM stores that make IDC data available via the standard DICOMweb interface. IDC users can utilize these tools to store and provide access to the artifacts resulting from the analysis of IDC images. As an example, DICOM store can be populated with the results of image segmentation, which could be visualized using a user-deployed Firebase-hosted instance of OHIF Viewer (deployment instructions are available here).
Next Steps
The IDC dataset is a powerful tool for accelerating data-driven research and scientific discovery in cancer prevention, treatment, and diagnosis. We encourage researchers, engineers, and students alike to get started by following the onboarding steps we laid out in this post: familiar yourselves with the data by heading to the IDC portal, tailor your cohorts using the BigQuery public dataset, and then download the images to analyze with your on-prem tools, or with Google Cloud services or Colab. Getting started with the IDC notebook series should help you get familiar with the resource.
For questions, you can reach the IDC team at support@canceridc.dev, or join the IDC community and post your questions. Also, see the IDC user guide for more details, including official documentation.