Visualize Cloud DNS public zone queries using log-based metrics and Cloud Monitoring
Paarth Mahajan
Google Cloud Network Specialist
Maddy Soleimanian
Technical Solutions Engineer
When logging is enabled, Cloud DNS logs all DNS queries for a public zone from external sources. The logs contain useful information such as the query name, query type, response code, and source IP address. Users can query the data in Cloud Logging to find specific information or to troubleshoot an ongoing issue. However, Cloud DNS does not publish any metrics for public zones, and there is no direct way to visualize all the logged data.
This blog post will show you how to create a log-based metric using Cloud DNS public zone logs data. We'll then use Cloud Monitoring to create a custom dashboard to view the data.
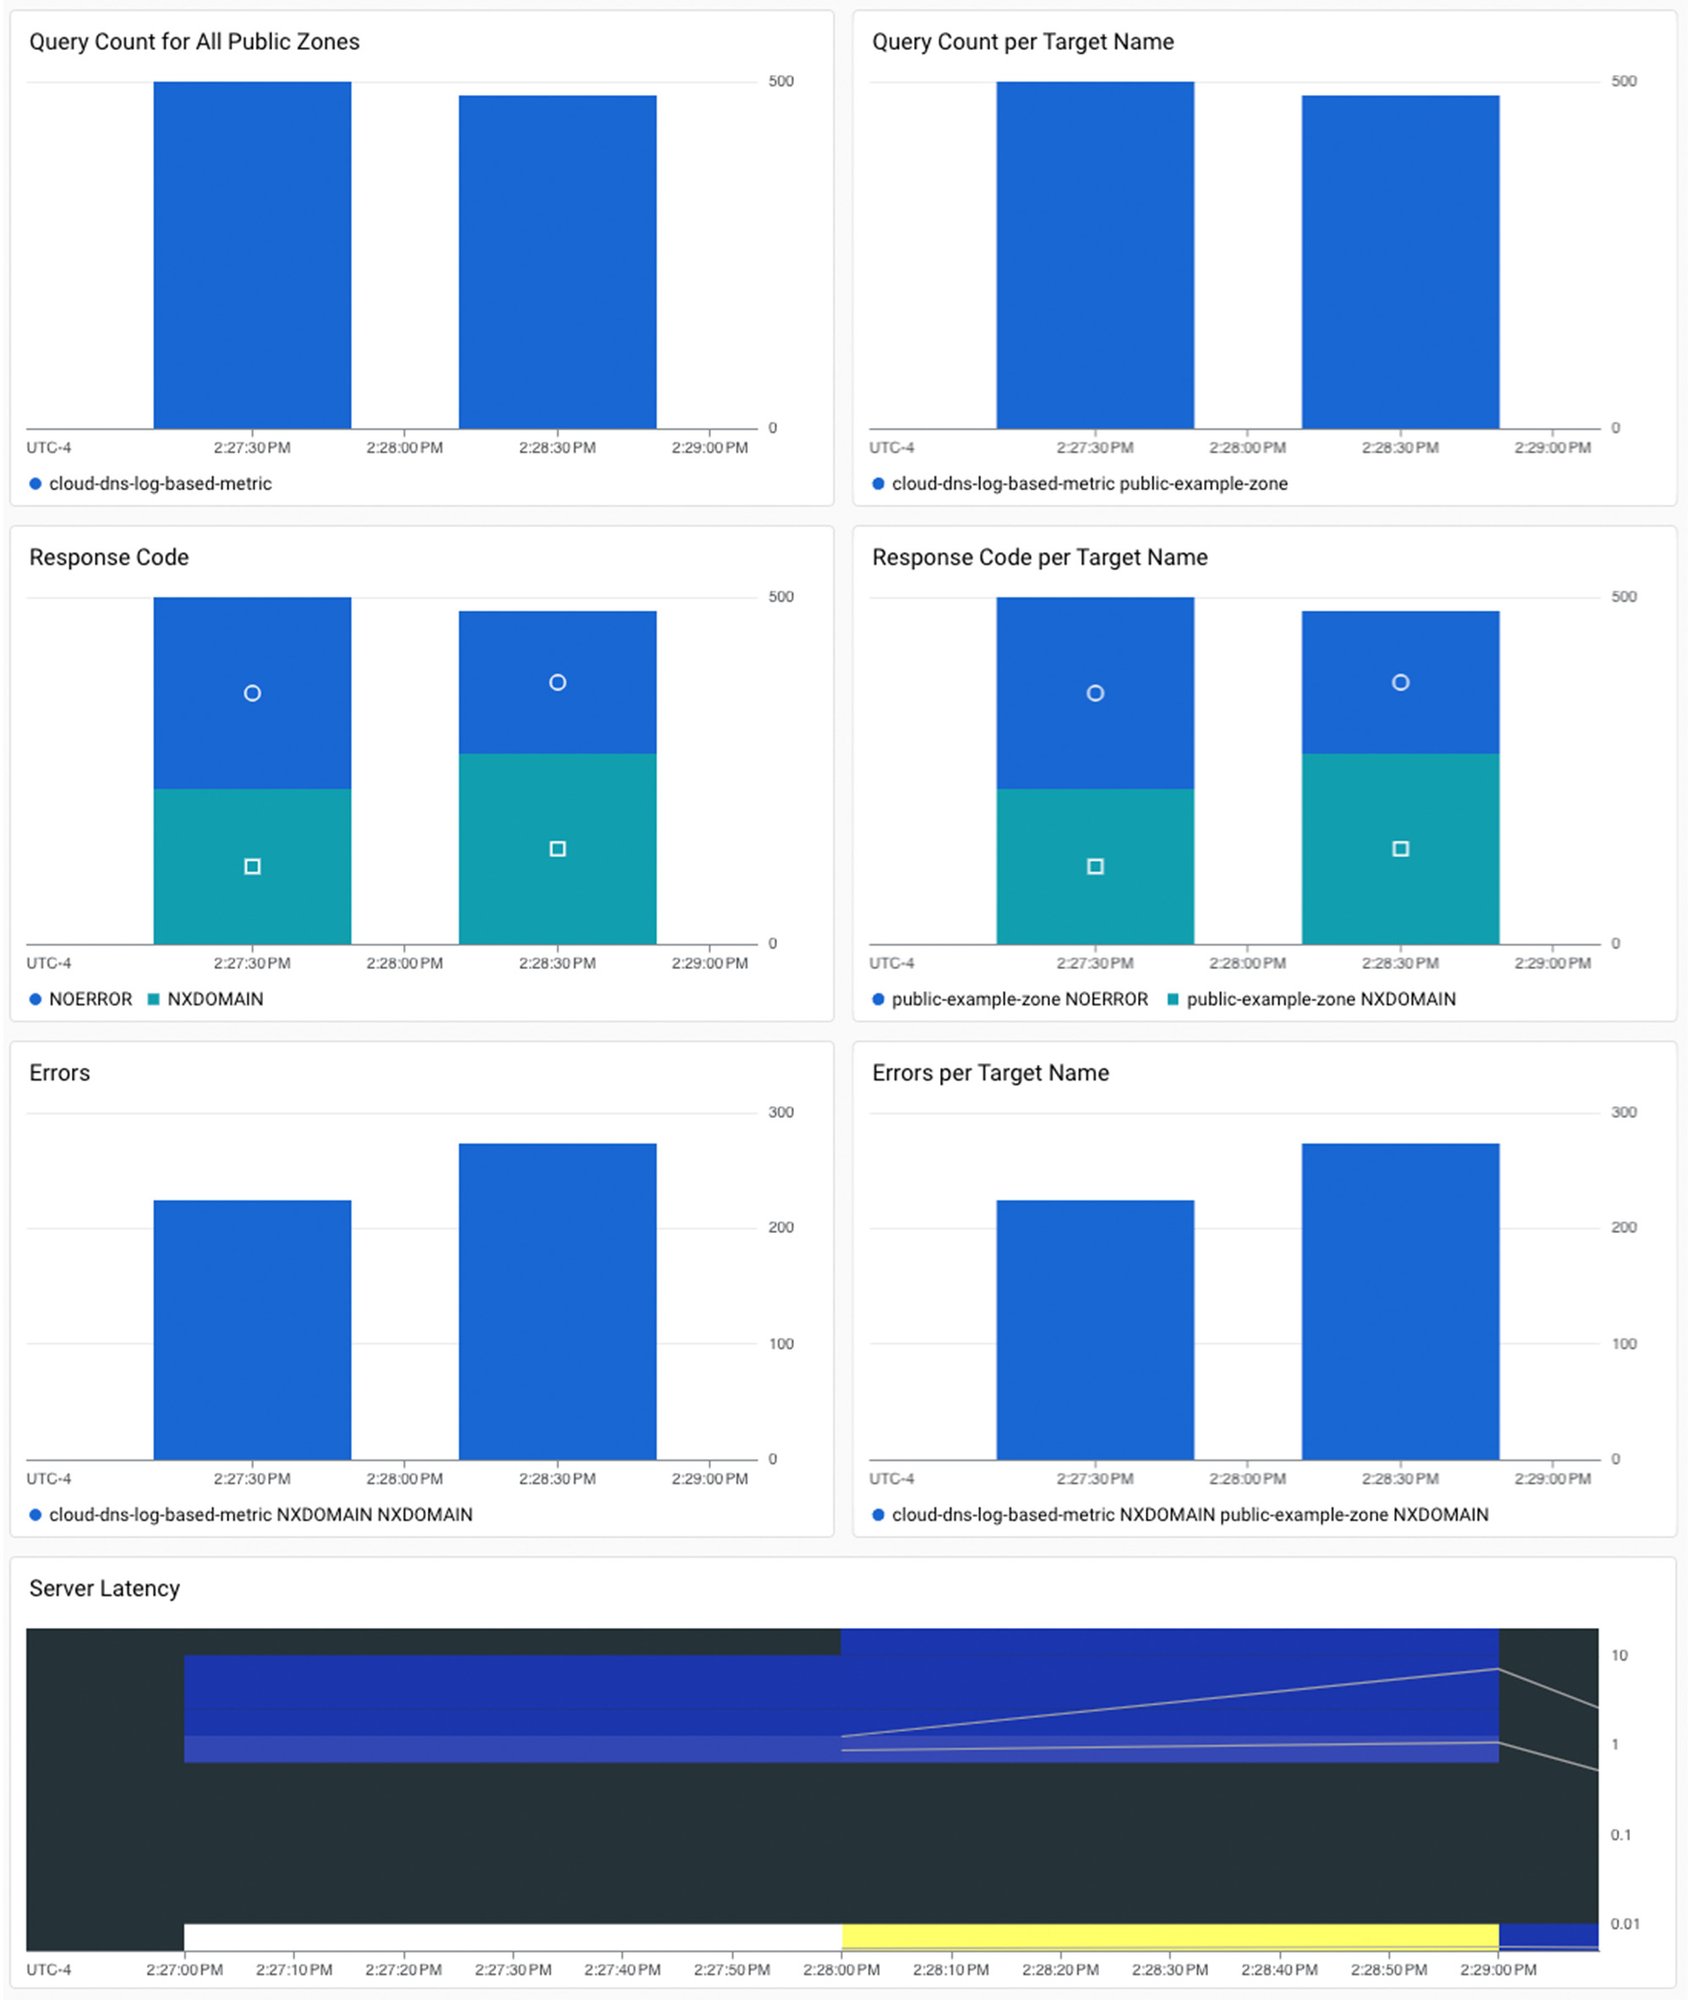
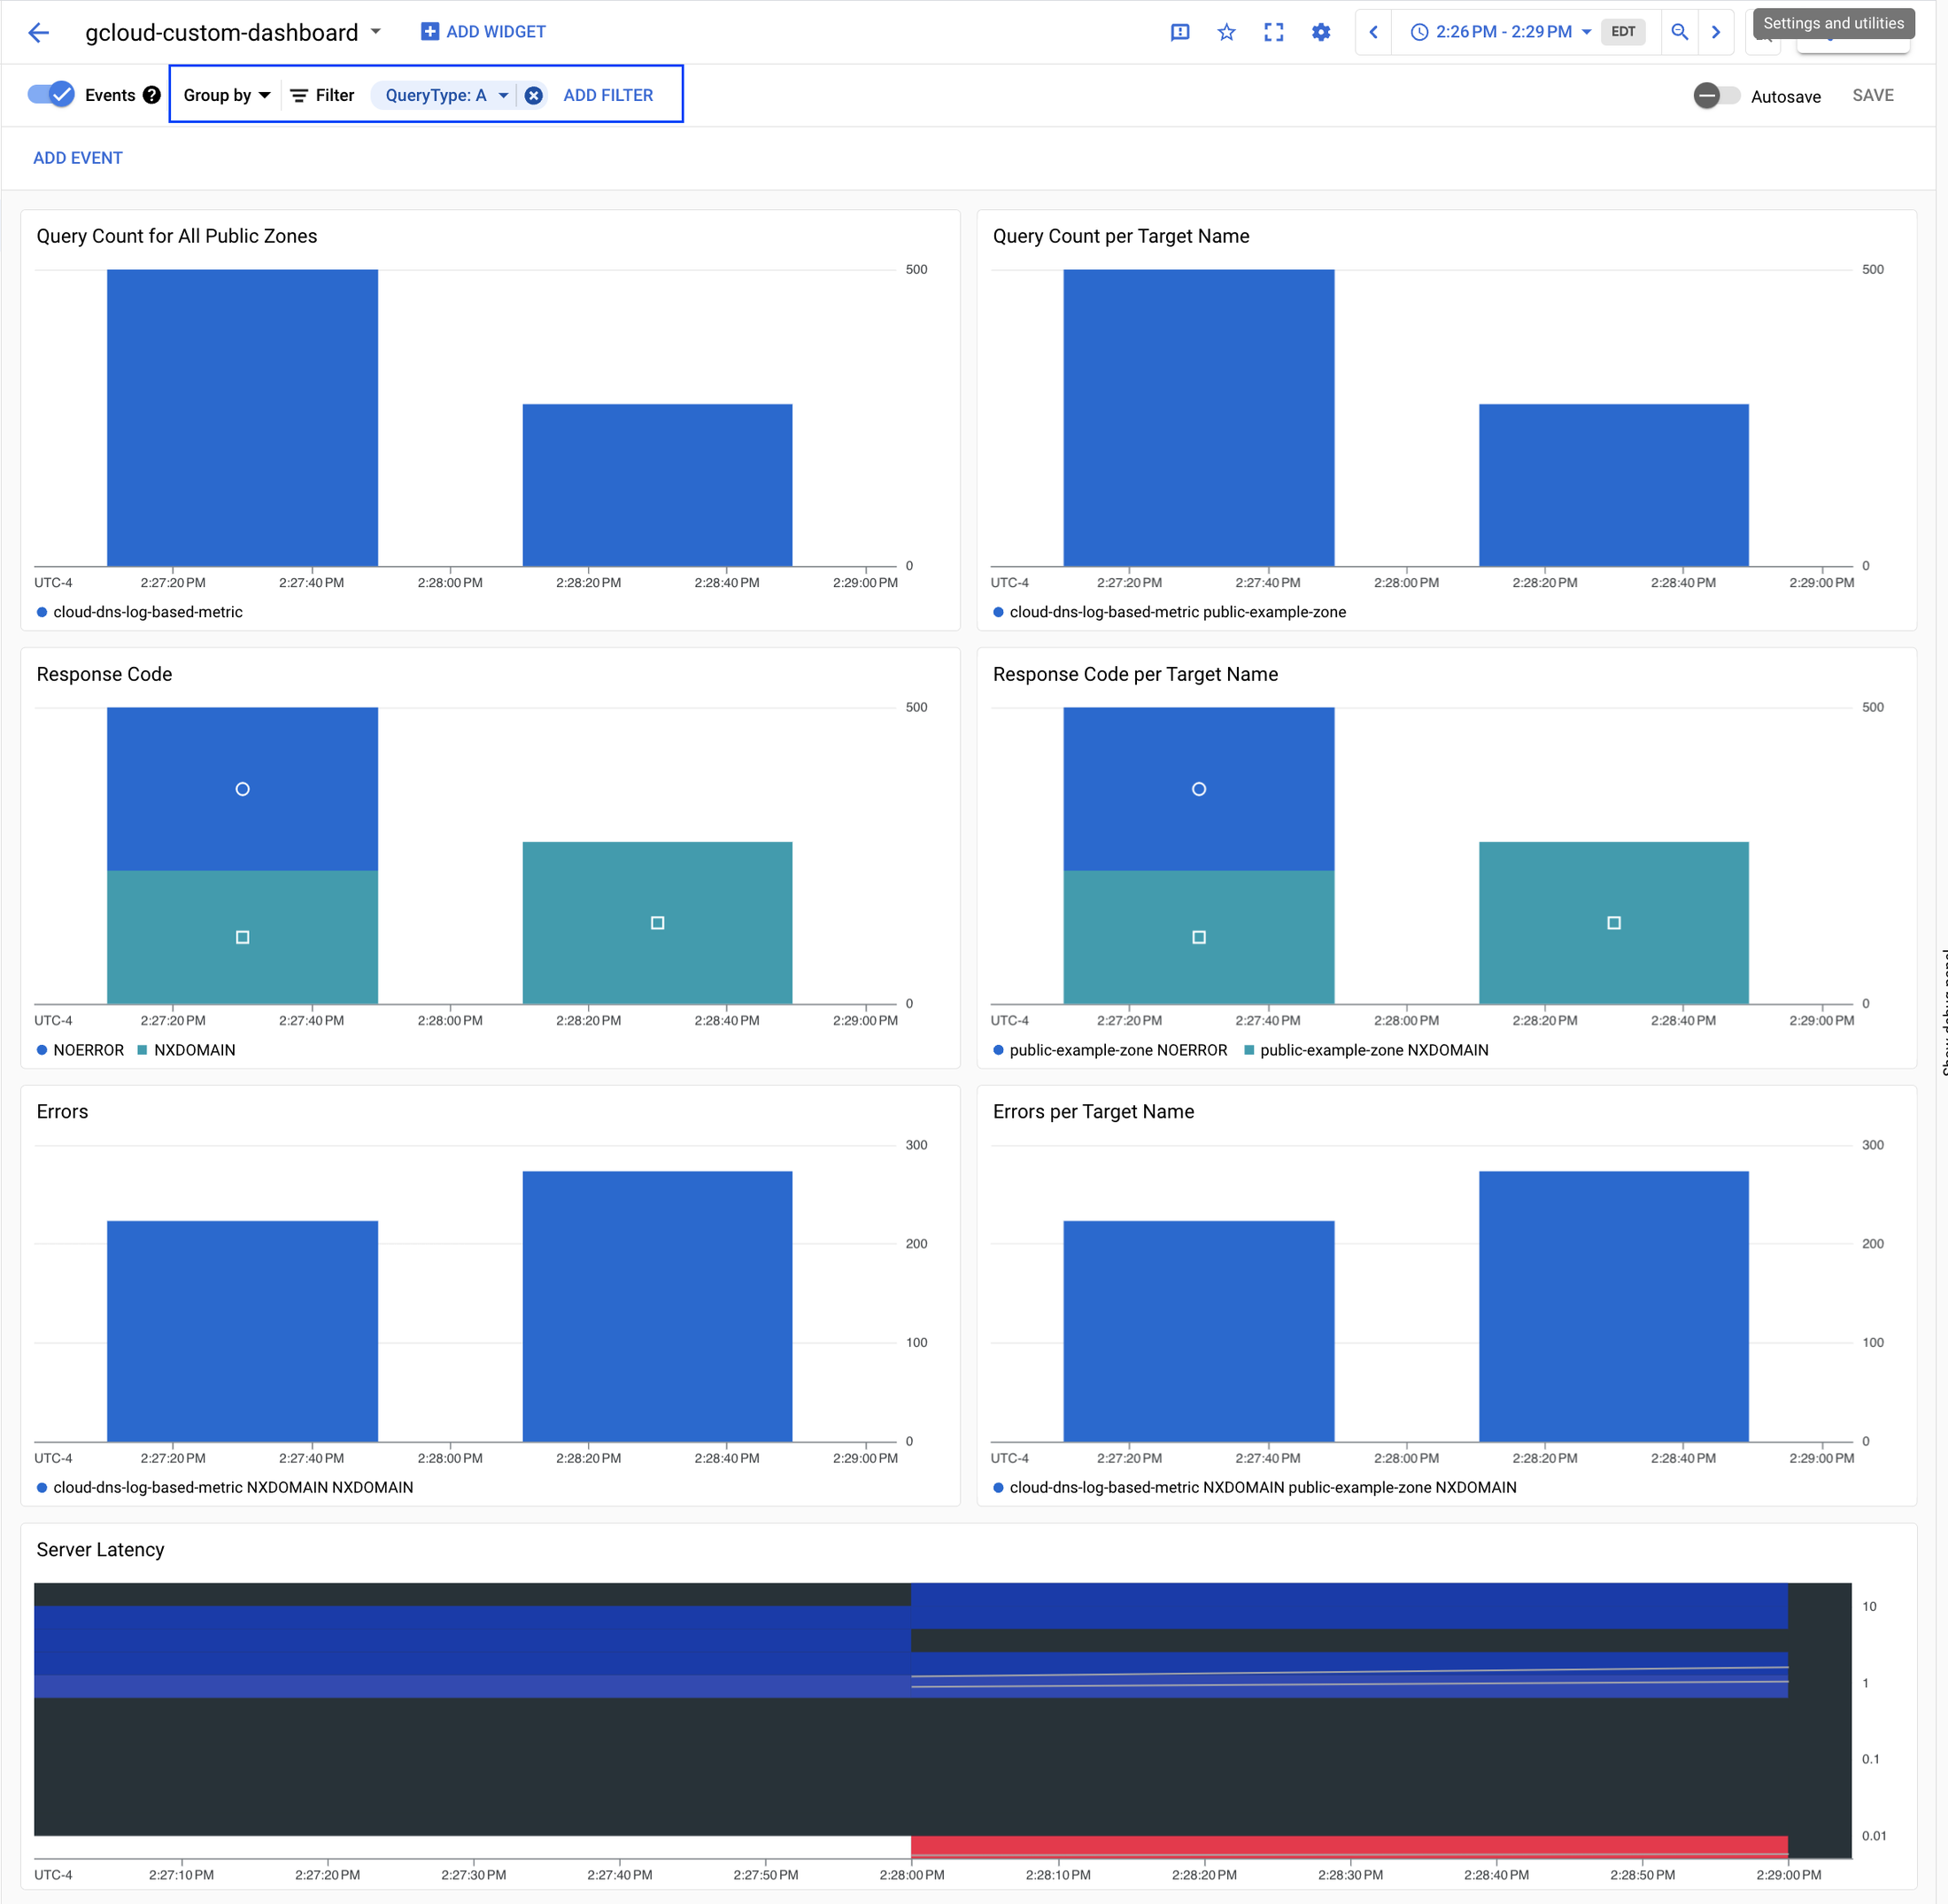
The pre-configured dashboard will provide the following information:
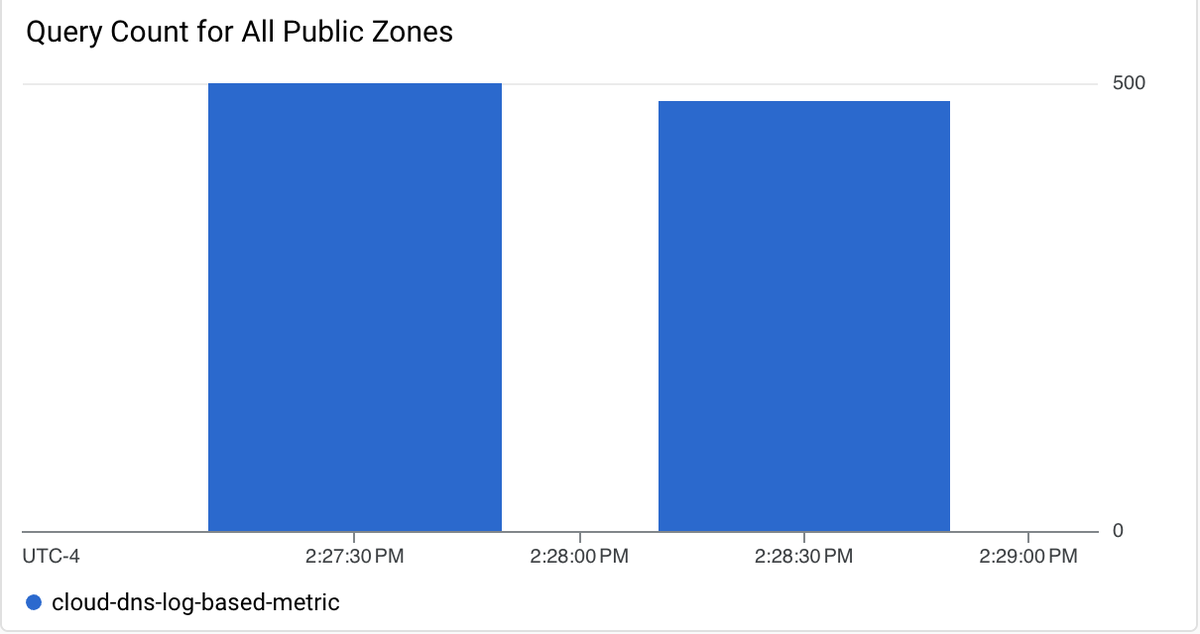
Query Count for All Public Zones: Total number of DNS queries received for all public zones during a specified time period.
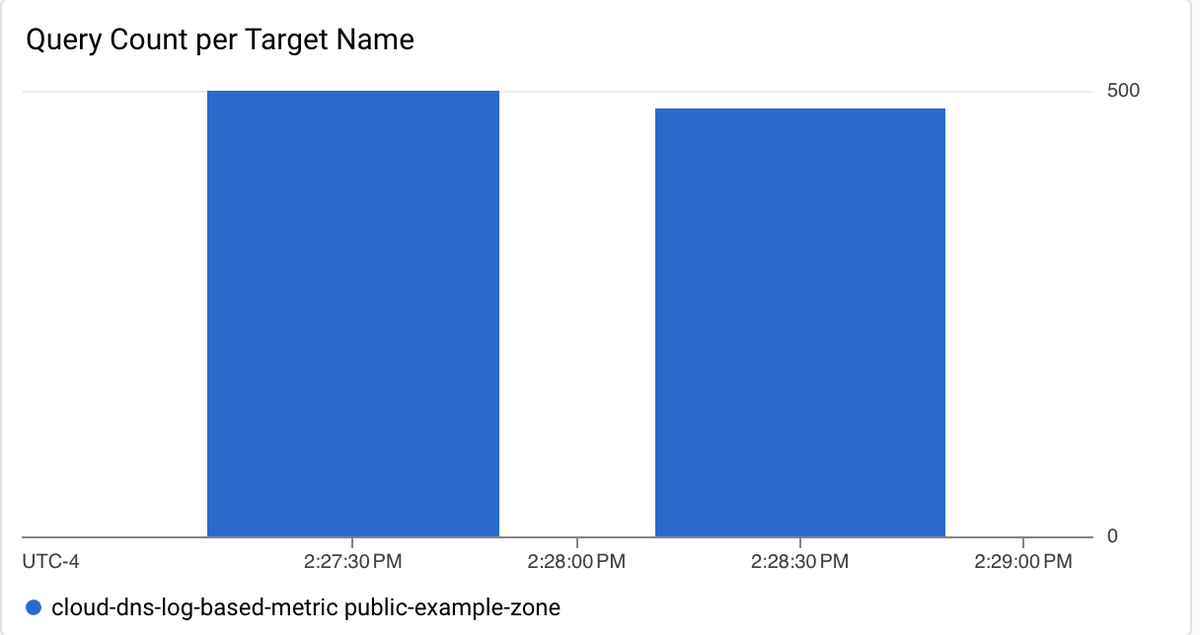
Query Count per Target Name: The number of DNS queries received per public zone during a specified time period.
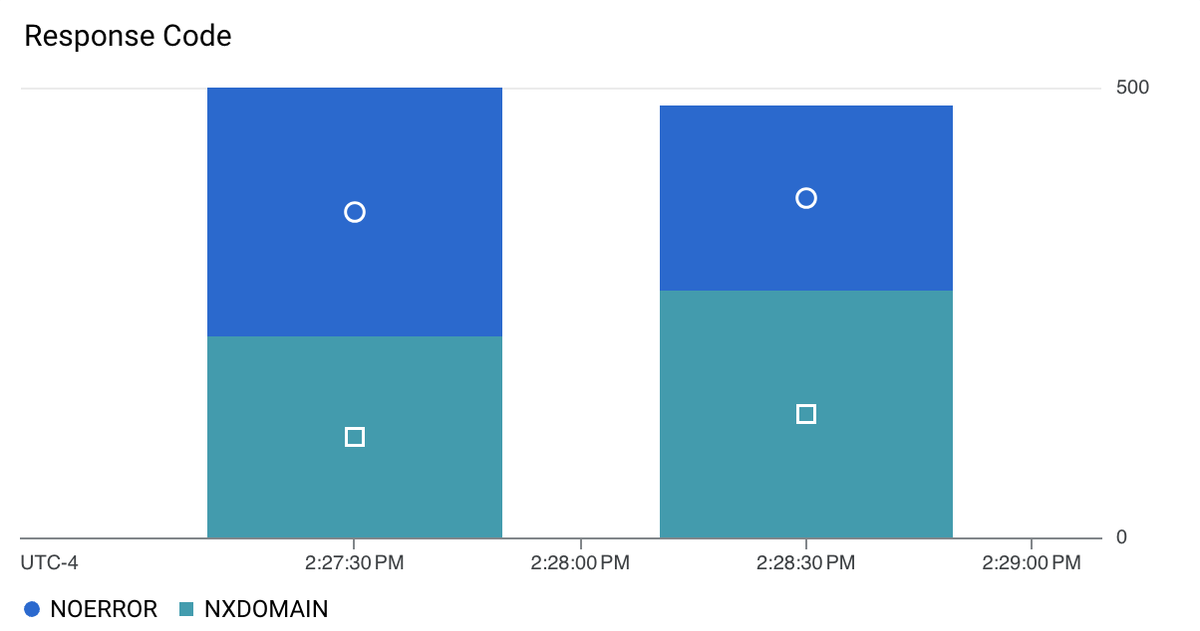
Response Code: The total number of occurrences of a specific response code for all public zones during a specified time period.
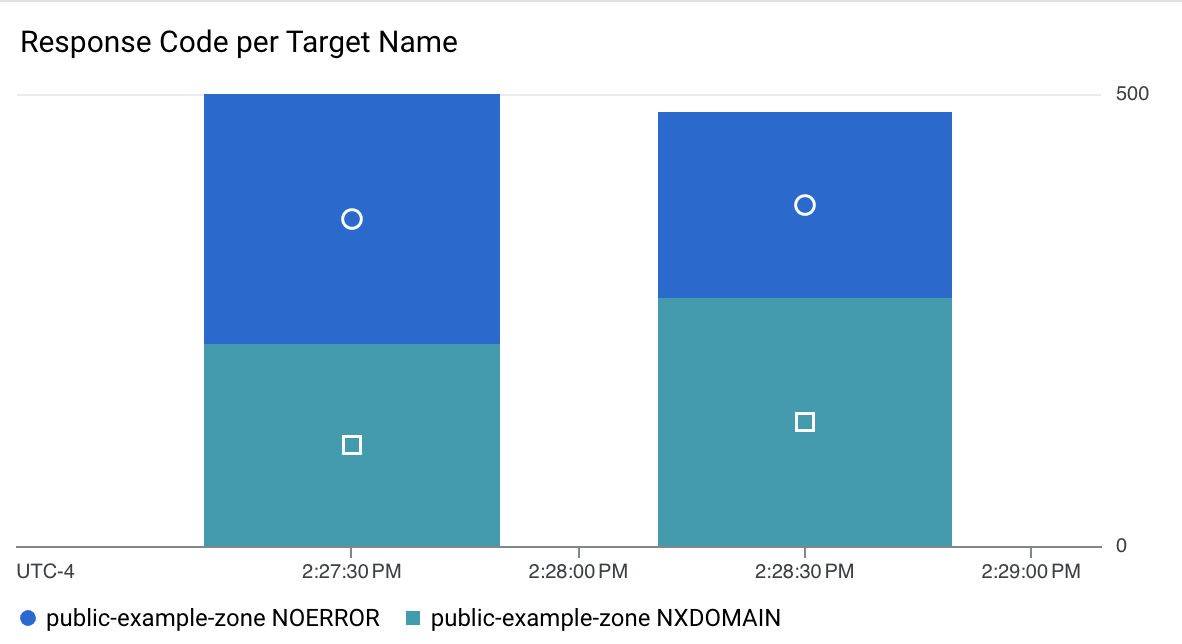
Response Code per Target Name: The number of times a specific response code was returned, grouped by public zone.
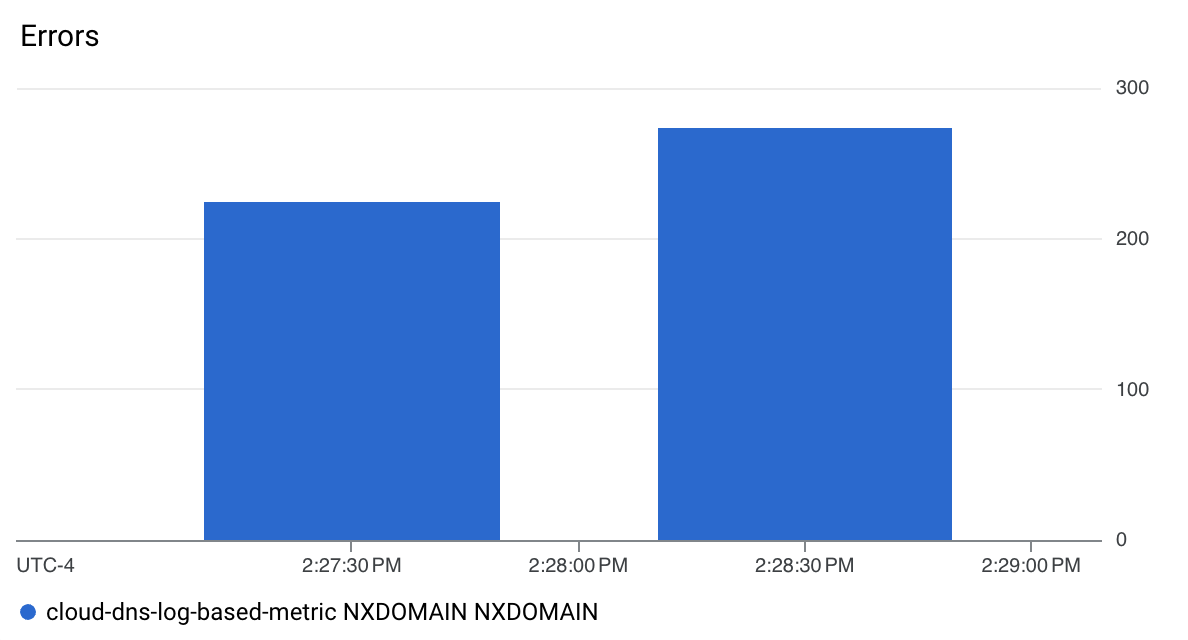
Errors: The total number of response codes excluding NoError for all public zones during a specified time period.
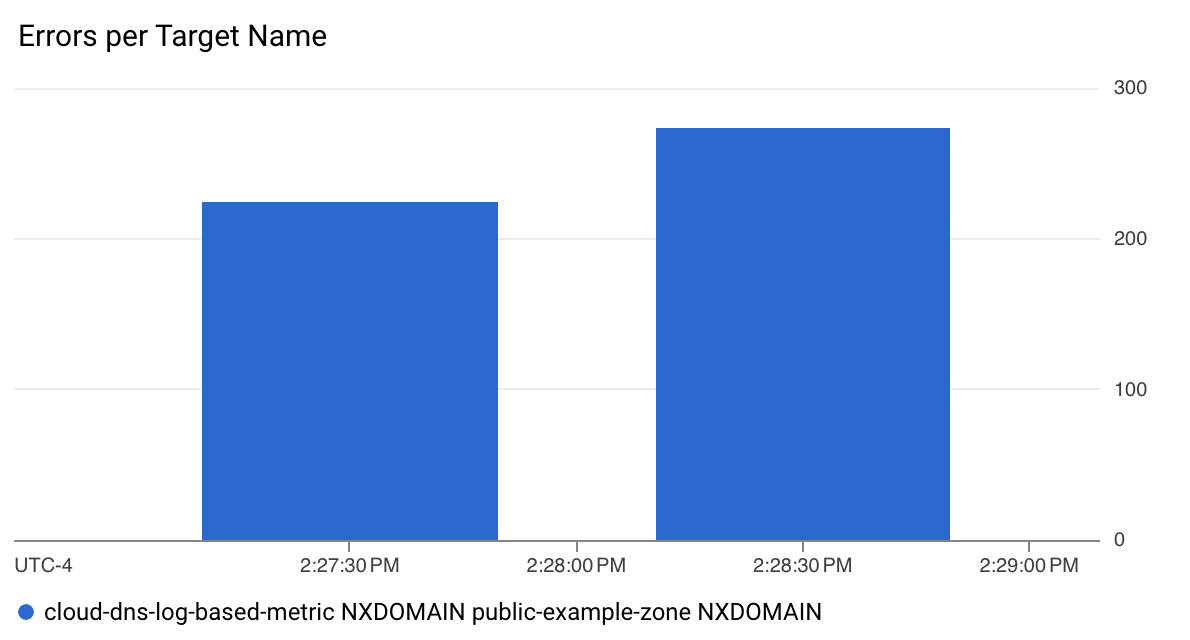
Errors per Target Name: The total number of response codes excluding NoError, grouped by public zone.
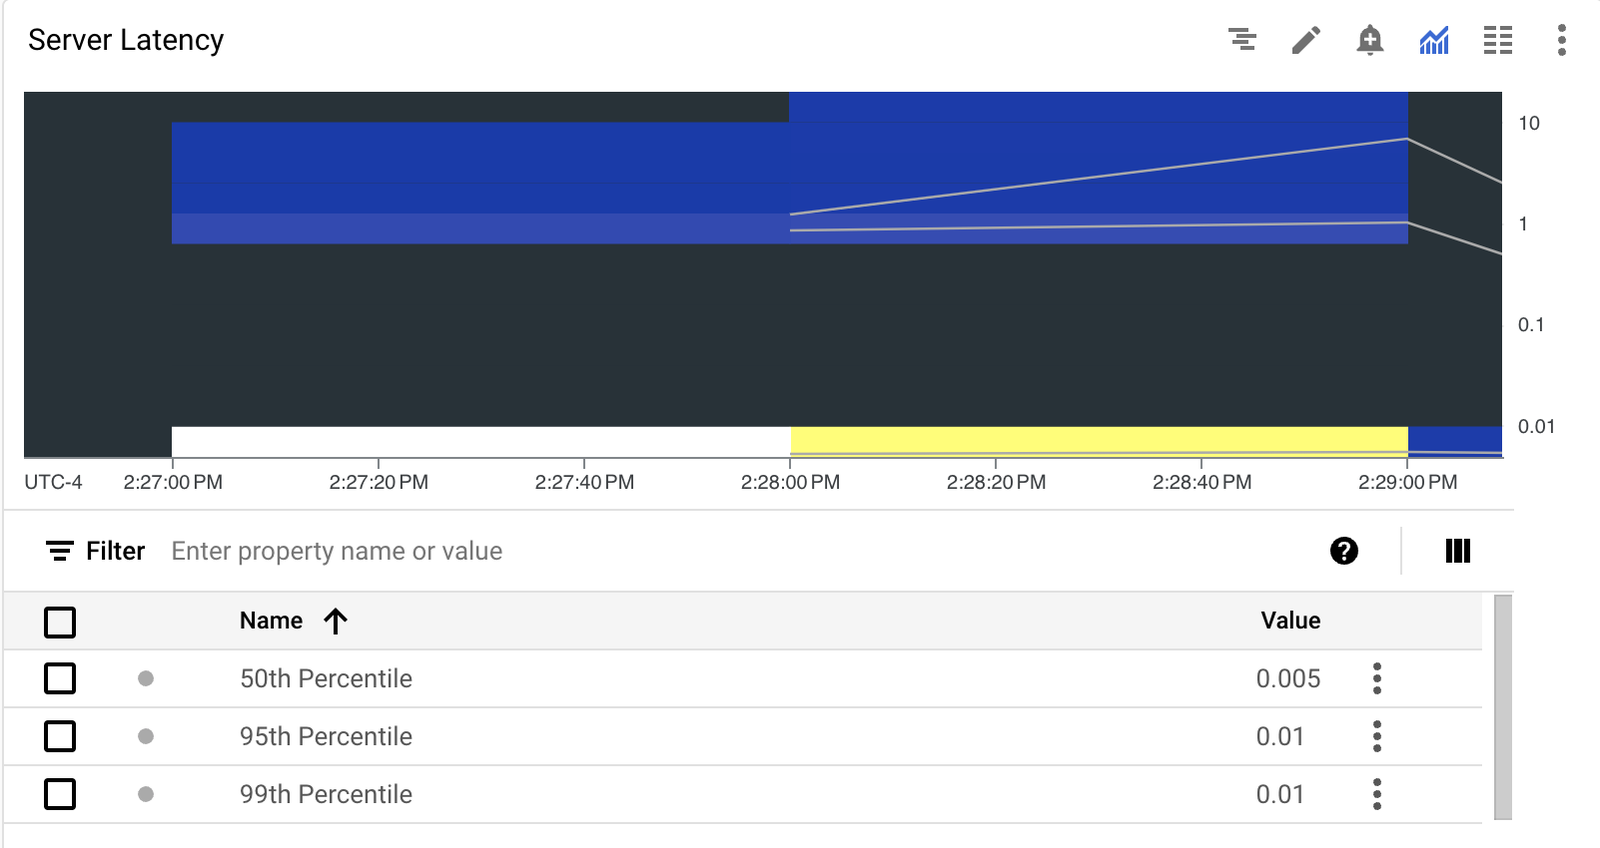
Server Latency: This distribution metric reports statistical data on request latencies, not individual values. A heat map chart shows the 50th, 95th, and 99th percentiles of server latency. The 50th percentile is the median latency. The 95th percentile is the value that 95% of requests took longer than. The 99th percentile is the value that 99% of requests took longer than. See the official documentation for details on how to interpret heat map charts.
Steps to create Cloud DNS custom dashboard
The following steps will be performed:
- Enable logging on public zones
- Understanding the log entry for public zone
- Create log-based metrics
- Create the custom dashboard
1. Enable logging on public zones
Unlike private zones, where logging is enabled or disabled by the DNS server policy on the client network, logging for public zones is enabled or disabled at the zone level. To enable logging for an existing public zone, use the following command:
Command
Note: Cloud DNS only logs queries that reach its name servers. Queries that are answered from caches are not logged.
2. Understanding the log entry for public zone
You can review a table of all the fields in the Cloud DNS logging and monitoring documentation. This section will review the fields that will be used later to create the log-based metrics.
The following fields will be used to create the log-based metrics:
queryName: The DNS query name, eg www.example.com.
queryType: DNS query type eg A, AAAA, SOA, NS, etc. In the sample log entry provided below, the query is for an A record.
sourceIP: IP address of the DNS resolver from which Cloud DNS received the query
responseCode: DNS response codes, eg NOERROR, NXDOMAIN, SERVFAIL, REFUSED, etc.
project_id: Google Cloud project ID for the project which owns the public zone.
target_type: Type of target resolving the DNS query: public-zone, private-zone, forwarding-zone, forwarding-policy, peering-zone, internal, external.
target_name: The target name, for example, zone name, policy name, internal zone name, external domain name
3. Create the log-based metrics
We require the creation of two distinct log-based metrics: a counter metric and a distribution metric.
- We will use the counter metric to count the number of log entries for a specific DNS query name, query type, or response code.
- We will use the distribution metric to extract the distribution of server latency.
To create log-based metrics, use the gcloud logging metrics create command. Logging metrics configuration can be passed to gcloud using a .yaml file.
Note: All user-defined log-based metrics are a class of Cloud Monitoring custom metrics and are subject to charges. For pricing information, please refer to Cloud Logging pricing: Log-based metrics. The retention period for log-based metrics is six weeks. Please refer to the data retention documentation for details.
Create the counter metric
1. Download the config.yaml from Github:
2. To create counter metrics, use the gcloud logging metrics create command.
Command
Create the distribution metric
1. Download the latency-config.yaml from Github:
2. To create counter metrics, use the gcloud logging metrics create command.
Command
4. Create the dashboard
1. Download the dashboard.json from Github. We will use this file to import the pre-configured dashboard
2. Use the gcloud monitoring dashboards create command to create the dashboard. This command will create a custom dashboard named gcloud-custom-dashboard.
Command
Access the dashboard
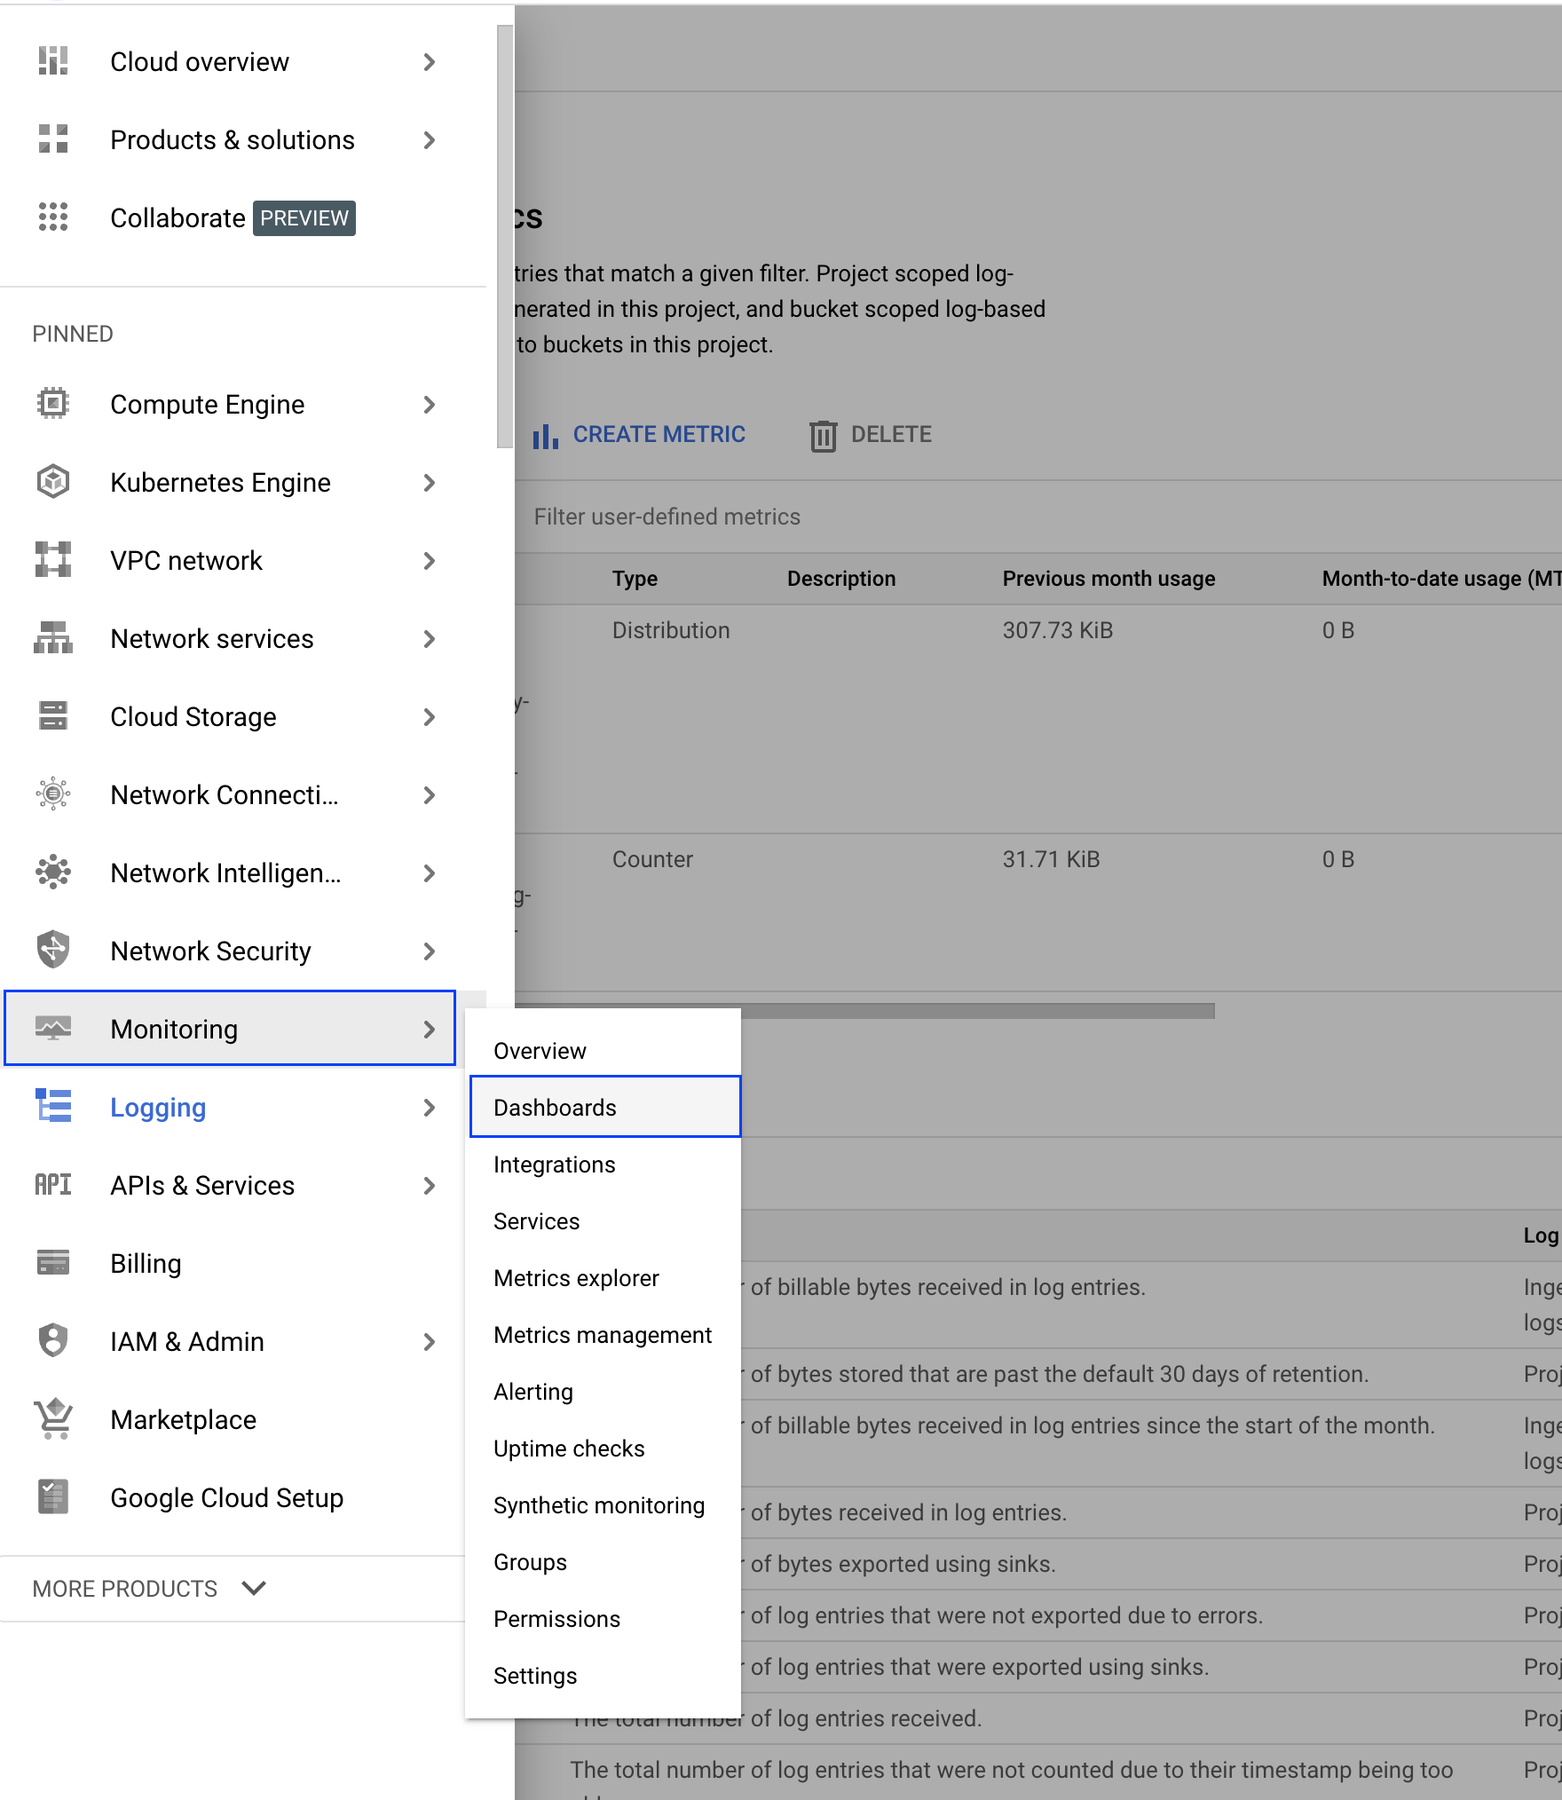
- In your Google Cloud console, click Monitoring and then Dashboards.
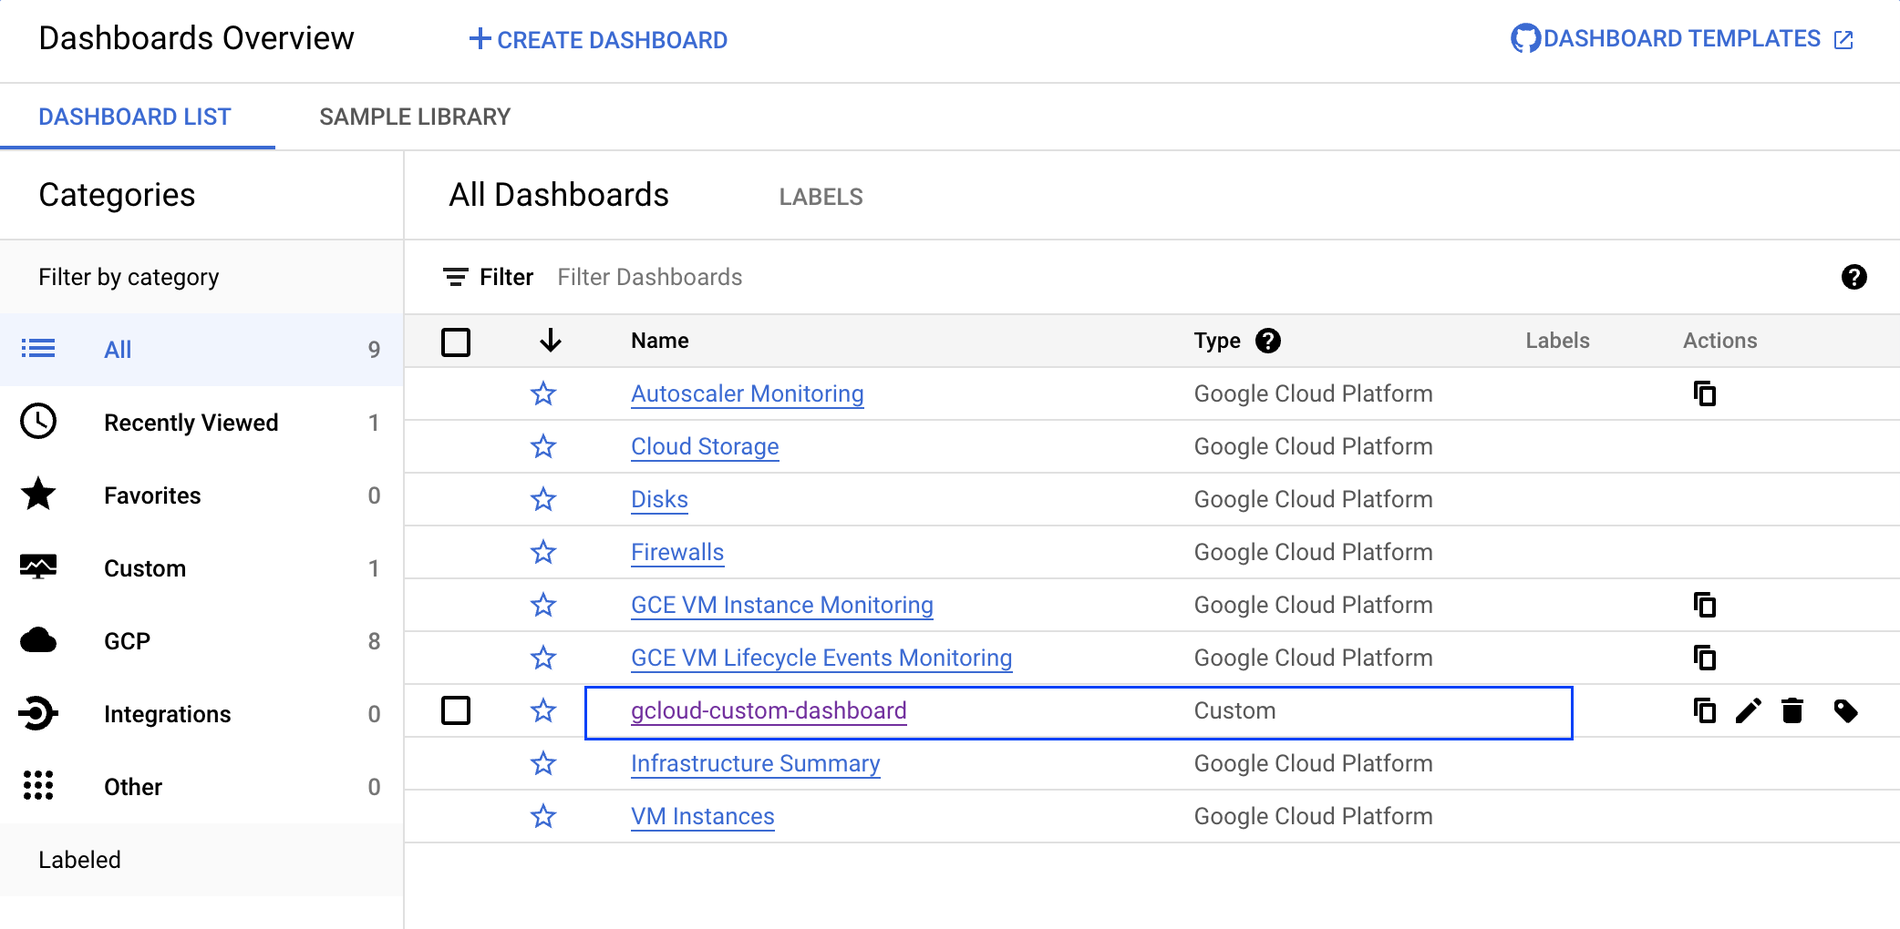
2. Click the custom dashboard named gcloud-custom-dashboard
3. The dashboard can be refined using the Group By and Filter functions. For example, the screenshot below shows a filter that only shows entries where the QueryType is A records.
Considerations
- Log-based metrics have higher ingestion delays than other types of metrics, making them unsuitable for real-time monitoring or highly sensitive alerts.
- Your metric counts may be delayed. The log-based metric could also have delays in displaying the correct log count due to a potential 10-minute delay for log ingestion.
- Users should set the alignment period to at least 5 minutes when configuring alerts for log-based metrics to prevent minor fluctuations from triggering alerts.
Learn More
To learn more about DNS capabilities and customization options, please check out the following:
- Repo: cloud-dns-public-zone-dashboard
- Documentation : Using Cloud DNS Logging
- Documentation : Log-based metrics overview