Using Cilium and GKE Dataplane V2? Be sure to check out Hubble for observability
Ghadeer Shaaya
Cloud Technical Solutions Specialist
Ankita Ojha
Staff Technical Solutions Engineer
Try Gemini 3.1 Pro
Our most intelligent model available yet for complex tasks on Gemini Enterprise and Vertex AI
Try nowAs a Kubernetes platform engineer, you've probably followed the buzz around eBPF and its revolutionary impact on Kubernetes networking. Perhaps you've explored Cilium, a popular solution leveraging eBPF, and wondered how Google Kubernetes Engine (GKE) harnesses this power. That curiosity may have led you to GKE Dataplane V2. And you've undoubtedly noticed that where eBPF goes, enhanced observability follows.
In this article, we'll shine a light on a tool that you can leverage with GKE Dataplane V2: Hubble. This powerful observability tool provides deep visibility with added Kubernetes context into your network packet flow.
GKE Dataplane V2 observability provides a Managed Hubble solution. This includes the following components:
-
Hubble Relay: a service that collects network telemetry data about your pods and nodes
-
Hubble CLI: a command-line interface tool providing live traffic information within the cluster
Enabling Dataplane V2 observability in GKE, either through the Google Cloud console or the gcloud command, triggers the deployment of a dedicated hubble-relay deployment with a single pod. This pod houses both the Hubble Relay and CLI components as dedicated containers, providing immediate access to network telemetry data and command-line tools for analysis.
While the Hubble UI is not included in the initial deployment, you can easily enhance your observability setup by adding it. This web-based interface offers a visual and interactive way to explore and analyze the data collected by Hubble Relay, making it easier to identify trends, spot anomalies, and troubleshoot issues.
With Hubble CLI and UI at our disposal, let's explore how these tools can be used to effectively troubleshoot your Kubernetes environment.
Before you start
-
Make sure you're comfortable using the Hubble CLI (link to documentation).
-
Know how to deploy the Hubble UI binary distribution (link to documentation).
Setting the stage
For this example, we'll use two pods, each deployed in a separate namespace and exposed as a service.


Scenario 1: Tracing a simple request
In this scenario, we observe a basic interaction between a pod and a service.
1. Initiate a request: Execute a curl request from the store-frontend pod to backend-svc service:
$ kubectl exec store-frontend -n fe -it -- curl “backend-svc.be.svc.cluster.local.”
2. Observe with Hubble: Use the Hubble CLI to examine the traffic:
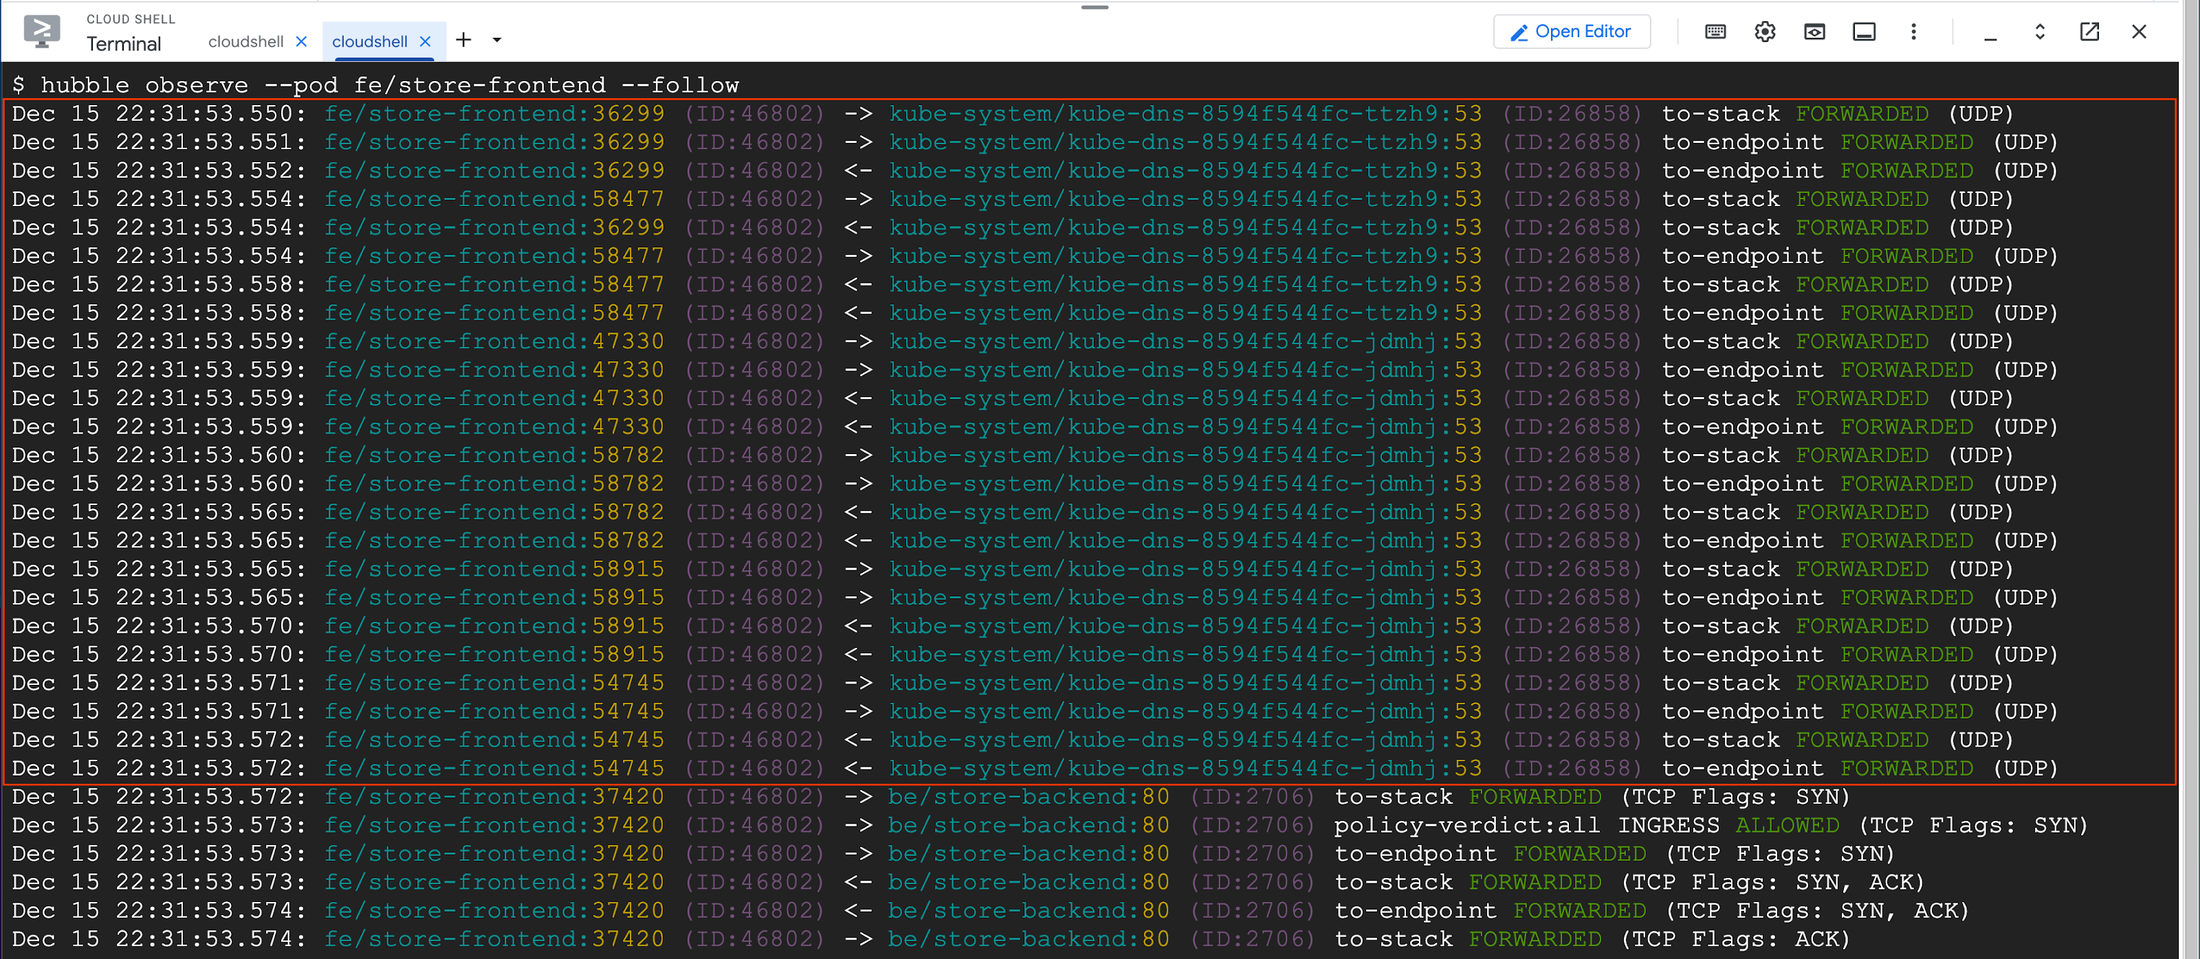
$ hubble observe --pod fe/store-frontend --follow
Hint: For a full list of Hubble filters and flags, run hubble observe --help


Hubble captures the entire flow: the store-frontend pod contacting kube-dns for service name resolution, followed by the TCP connection to the store-backend pod. See how Hubble adds the namespace and pod names to the packets? This Kubernetes-aware insight makes it much easier to understand and analyze your network traffic.
Scenario 2: When DNS goes wrong
Let's simulate a scenario where our DNS server is overwhelmed. We deploy an application that floods the cluster with DNS requests, putting significant strain on the kube-dns pods. Then, we replicate the request from Scenario 1.


By examining the timestamps of the DNS request and response in the Hubble CLI output, we can clearly observe a delay of approximately 5 seconds for kube-dns to respond. This highlights the impact of the overloaded DNS server and explains the latency observed in our system.
Let's intensify the load on our DNS server even further, pushing it to the point where DNS requests fail outright due to an inability to resolve service names.
$ kubectl exec -it store-frontend -n fe -- curl "backend-svc.be.svc.cluster.local."curl: (6) Could not resolve host: backend-svc.be.svc.cluster.local.


In this extreme scenario, the Hubble drop reveals that our DNS queries are simply not being answered, indicating a complete breakdown in name resolution.
We finally will make the kube-dns pods unavailable by taking them down.


Hubble's flow logs provide a clear picture of what's happening. You can see that the store-frontend pod attempts to reach the kube-dns service, but the request fails because there are no healthy kube-dns pods to handle it.
Hubble CLI isn't just a troubleshooting tool; it's also powerful for optimization. For example, while running the first scenario, you may have noticed a surprisingly high number of DNS requests generated from a single curl command:


A quick investigation reveals the root cause: a missing trailing dot in the service name, and the pod's resolv.conf being configured with ndots:5. This combination meant the query wasn't treated as absolute and was instead expanded with all five search domains listed in resolv.conf, resulting in six DNS requests for every single curl call.
Scenario 3: Network policy mishap!
It appears there was a slight oversight with a new Ingress NetworkPolicy. Let's just say Monday mornings and network policies don't always mix…! The front-end application was accidentally left out of the allowlist.


Communications between the front-end and the back-end applications hang and timeout. The front-end engineer rushes to Hubble CLI. Hubble shows that the front-end application traffic is being denied and dropped by a network policy.
Thankfully, the Hubble CLI allows you to filter events by type using the --type flag. For instance, --type policy-verdict shows only events related to network policies. You can further refine this by using --verdict DROPPED to see only events where traffic was dropped due to a policy.


Hubble UI
While the Hubble CLI is undeniably powerful, the Hubble UI offers a complementary and equally valuable perspective. Beyond replicating the CLI's functionality, the UI provides a visual map of your cluster's network traffic. This allows you to easily grasp how pods and Services connect, both internally and to the outside world. With filtering options like namespaces and labels, you can quickly isolate specific traffic flows and troubleshoot potential problems.


Explore the depths of GKE Dataplane V2 with Hubble
This exploration of Hubble, while introductory, provides a solid foundation for understanding its capabilities. Remember that far more intricate queries and filters can be crafted to gain deeper insights into specific network issues. Simply knowing about Hubble and how to access it is a significant first step towards effectively operating and troubleshooting Cilium-based Dataplane V2 clusters. As you dive deeper into Hubble's capabilities, you'll discover its full potential for observability and optimization within your GKE environment.
