Monitor the health of your VM fleets in the Compute Engine console
Yanqiu (Alice) Wang
Product Manager
Dave Raffensperger
Sr. Software Engineer
Many Infrastructure Operators need to manage large fleets of VMs. This task often involves gathering various key signals, identifying outliers, drilling down to find root causes, and fixing issues. This is usually a time-consuming process for operators since they need to switch between multiple pages to gather necessary information.
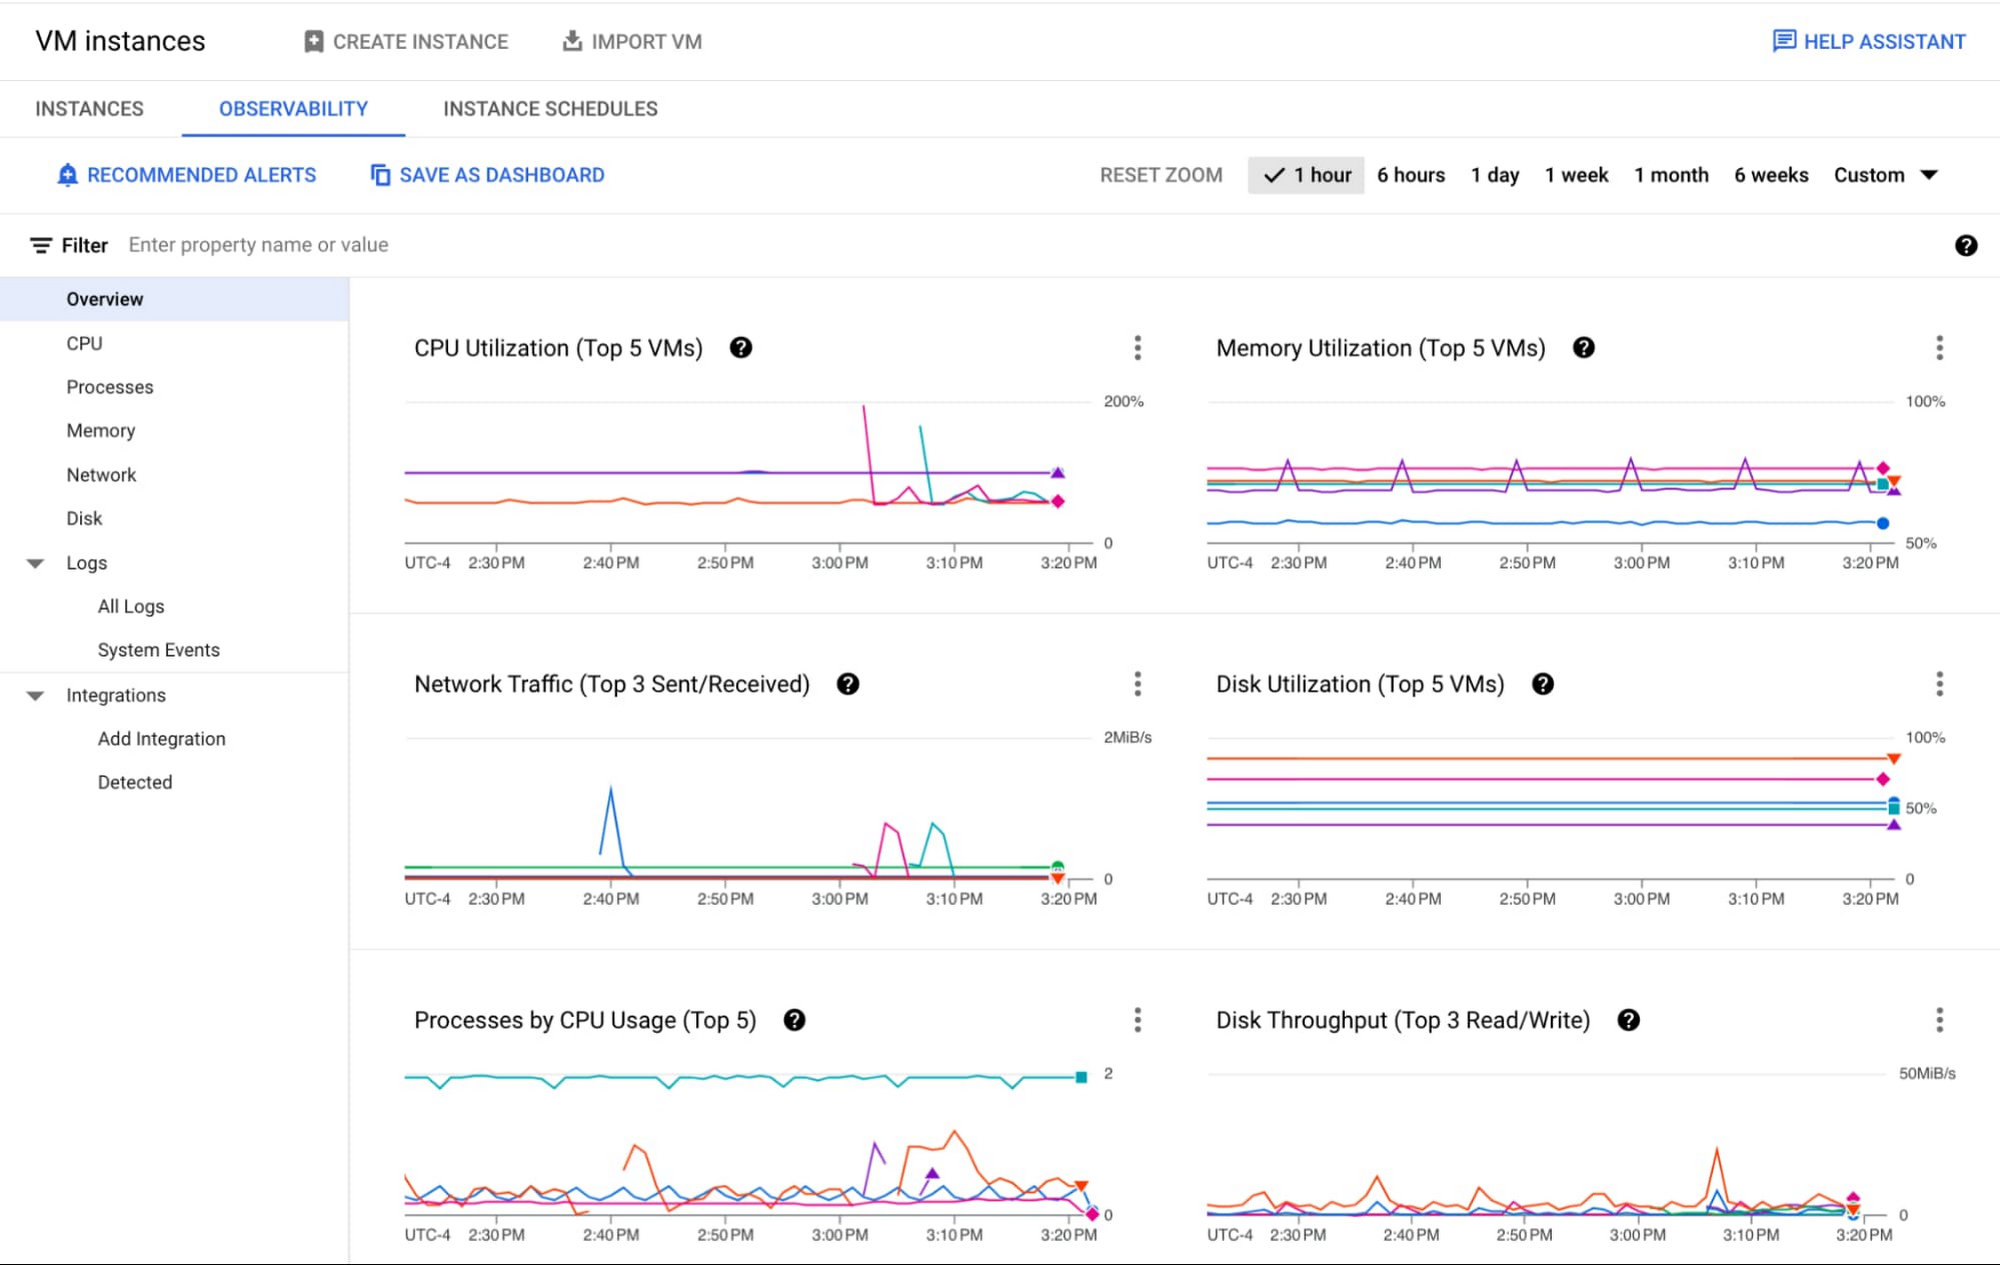
We are excited to announce that the Observability tab in the Compute Engine console VM List page has reached General Availability. The new Observability tab is an easy way to monitor and troubleshoot the health of your fleet of VMs — it offers key health metrics and logs out-of-the-box and highlights anomalies across your fleet. You can quickly gain insights into CPU, memory, network, disk, live processes, system events and live logs within one UI.
Observability-in-context at a fleet level
This new fleet level view lets you understand your VMs more holistically by 1) identifying VM outliers based on key metrics such as CPU, memory, and 2) seeing cross-fleet trends around high-resource processes or network latencies by destination.

Metrics
The Observability tab helps you visualize key health metrics without configuration. Here are all the metrics offered out-of-the-box and their example use cases:
CPU
CPU Utilization, vCPU Core Usage: Troubleshoot application performance issues by identifying VMs running out of CPU resources. See Troubleshooting VM Performance
Processes by CPU Usage: Identify top processes by CPU usage for pinning down the root cause of an issue or to identify optimization opportunities.
System Load per vCPU: If the number is close to 1, it could indicate a need to scale up your VM to prevent performance issues
Unused vCPU Cores: Discover cost saving opportunities from VMs that are underusing CPU resources
Processes
Live processes by CPU Usage, Memory Usage, Disk Throughput: Identify top processes by CPU, Memory, or Disk Throughput to find optimization opportunities or unexpected resource consumers.
Live processes by CPU per VM, Processes by Memory per VM, Processes by Disk Throughput per VM: Find sample VMs that are running the top CPU/Memory/Disk-consuming processes
Memory
Memory Utilization, Memory Bytes Used: Troubleshoot application performance issues by identifying VMs running out of Memory
Memory Bytes Unused: Discover cost saving opportunities from VMs that are underusing Memory resources
Processes by Memory: Identify top processes by Memory usage
Memory by State (across VMs): Learn aggregated sizes of free, used, cached, buffer, and slab memory across your fleet
Network
Network Traffic: Identify “top talkers” across your fleet for optimizing costs (see Network costs)
Sent Traffic by Destination Type (GCP/External/Google), Sent External (or different project), Sent Cross-region and cross-zone: Discover top network cost contributors (see Network costs)
RTT by Destination Type (GCP/External/Google): Troubleshoot application performance issues by identifying abnormal latency (RTT)
Firewall Packets Denied (Highest Variance): Discover anomalies in incoming traffic (e.g. a sudden surge in denied traffic)
Disk
Disk Utilization: Troubleshoot application performance issues by identifying VMs running out of Disk space
Disk Throughput, Disk IOPS: Monitor disk performance by seeing outliers VMs across throughput and IOPS.
I/O Size, I/O Latency, Queue length, CPU I/O Wait %: Dive deeper into Disk I/O performance issues by seeing I/O size, latency and queue length. See Optimizing persistent disk performance for how to tune your workloads for maximum performance across these dimensions.
Note: Many of the metrics such as CPU and network are provided for free and automatically collected by the Compute Engine infrastructure. Other metrics such as memory, disk utilization, and processes require the Ops Agent and may be chargeable (see Cloud Monitoring Non-chargeable and Chargeable Metrics).
Logs
The Logs section provides out-of-the-box logs from your VM fleet, and you can easily filter the logs by keywords, VM ID, severity level, or suggested queries. You can also gain insights into important system events, such as host machine maintenance events (Live Migrations or host errors), Spot VMs preemptions, and so on.
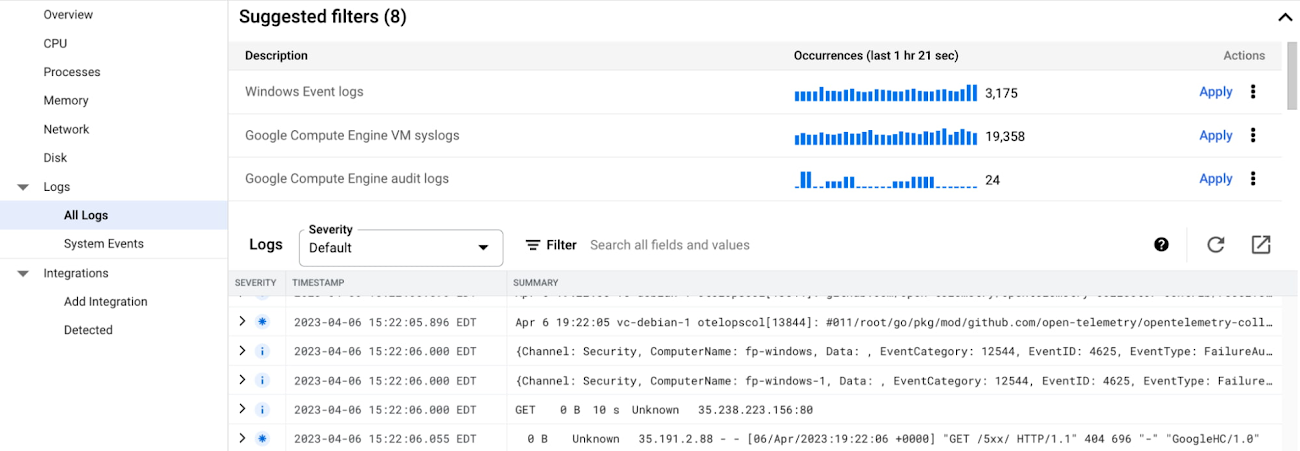

If you need more advanced log analysis, simply click on the top-right icon to navigate to Cloud Logging - the fully managed, real-time log management with storage, search, analysis and alerting at exabyte scale.
Drilling down into a single VM
To troubleshoot a specific VM, you can click a chart to pin the hover card and then click on the VM you want to investigate, as shown below:
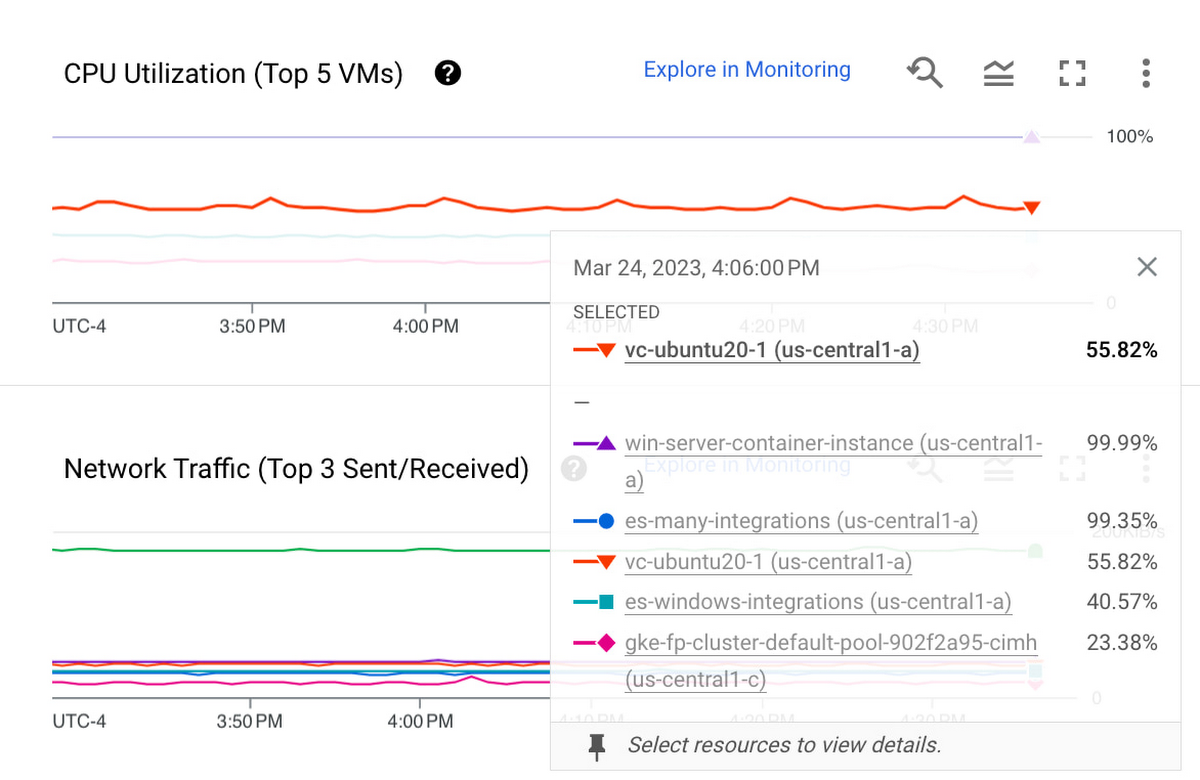

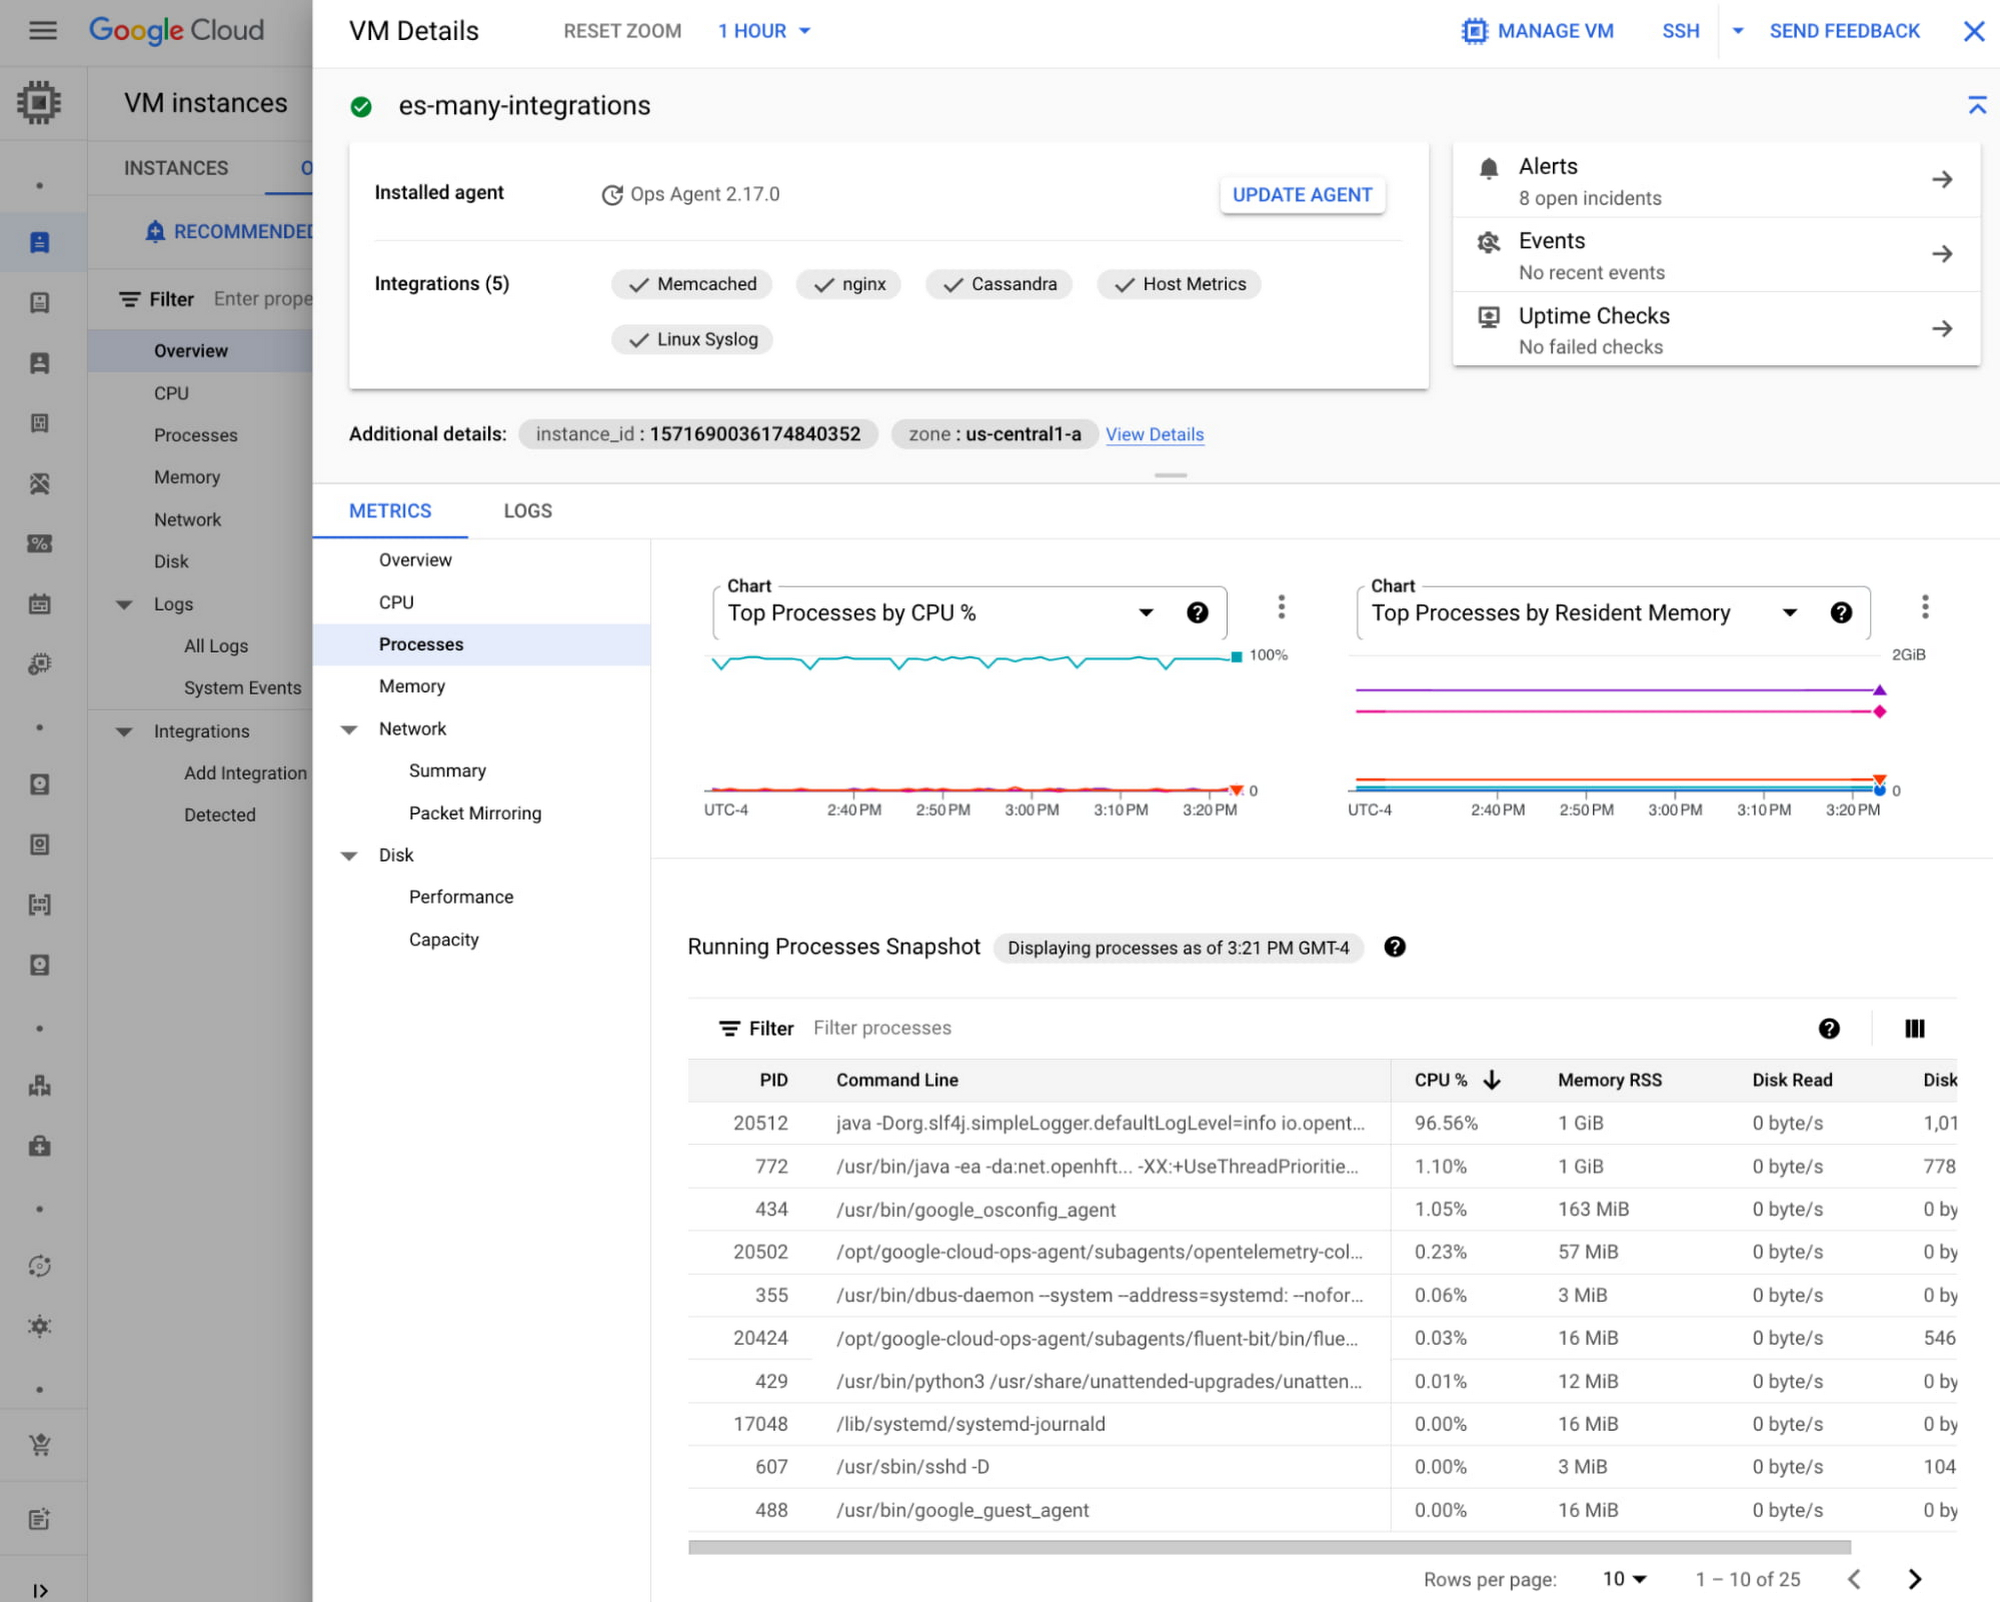
After clicking on the VM, you will find the following VM details - metrics, logs, processes, open incidents, uptime check, shortcuts to SSH to or manage the VM, and so on.

Discover Application Integrations
On top of infrastructure, you can also start monitoring your applications such as NGINX or MySQL here in the Observability tab. The Application Integrations section guides you to monitor third-party applications using the Ops Agent. For each of the integrations, you can find out more about its collected metrics, configuration guides, and related sample dashboards.
Discover Recommended Alert Policies
Do you want to get notified when something goes off the rail with your VMs? The Recommended Alerts section provides out-of-the-box alert policy templates on key health metrics, such as CPU and memory utilization. You can set up these policies across your fleet with only a few clicks.
Get started today
Check out the new Observability tab by navigating to Compute Engine > VM Instances and click into the Observability tab. We also recommend installing the Ops Agent on your Compute Engine VMs to get the most out of this new tab.
We really look forward to your feedback and suggestions! You can share your thoughts both via the Send Feedback feature at the top-right corner of the console or via our Google Cloud Community – Cloud Operations page. Your feedback will go a long way to help us build the right product.
