Monitoring for every runtime: Managed Service for Prometheus now works with Cloud Run
Lee Yanco
Senior Product Manager
Sagar Randive
Product Manager, Google Cloud Serverless
Regardless of whether your application runs on virtual machines, Kubernetes, or a serverless runtime, you need to be able to monitor critical business and application metrics. In recent years Prometheus has emerged as a popular choice for monitoring and metrics, although running it at scale is challenging. Our Managed Service for Prometheus takes the pain out of running Prometheus at scale and across environments, with support for applications running on Google Kubernetes Engine (GKE), Compute Engine, on-premises — and even other clouds. Today, we’re excited to announce that Managed Service for Prometheus now also supports Cloud Run, Google Cloud’s serverless runtime.
Customers who are curious about deploying their applications in Cloud Run, but don’t want to give up the robust metrics and observability best practices of Prometheus and the Prometheus community, can now get the best of both worlds. With this officially supported way to export native time-series data and user-defined metrics out of Cloud Run, organizations can continue to use the Prometheus ecosystem while exploring the simplicity and ease of use of Cloud Run. Plus, for companies that prefer the OpenTelemetry ecosystem, this release supports exporting OTLP metrics from Cloud Run as well.
Prometheus metrics for every deployment and runtime
With the release of this feature, you can instrument an application with Prometheus or OTLP metrics once, deploy it on Compute Engine, GKE, or Cloud Run, and then query and alert on the data all together with a single line of PromQL in either Cloud Monitoring or Grafana. If you also configure Managed Service for Prometheus to collect metrics from outside of Google Cloud using managed collection or OpenTelemetry, then you can even query Prometheus metric data across multiple environments, including on-prem and other clouds.
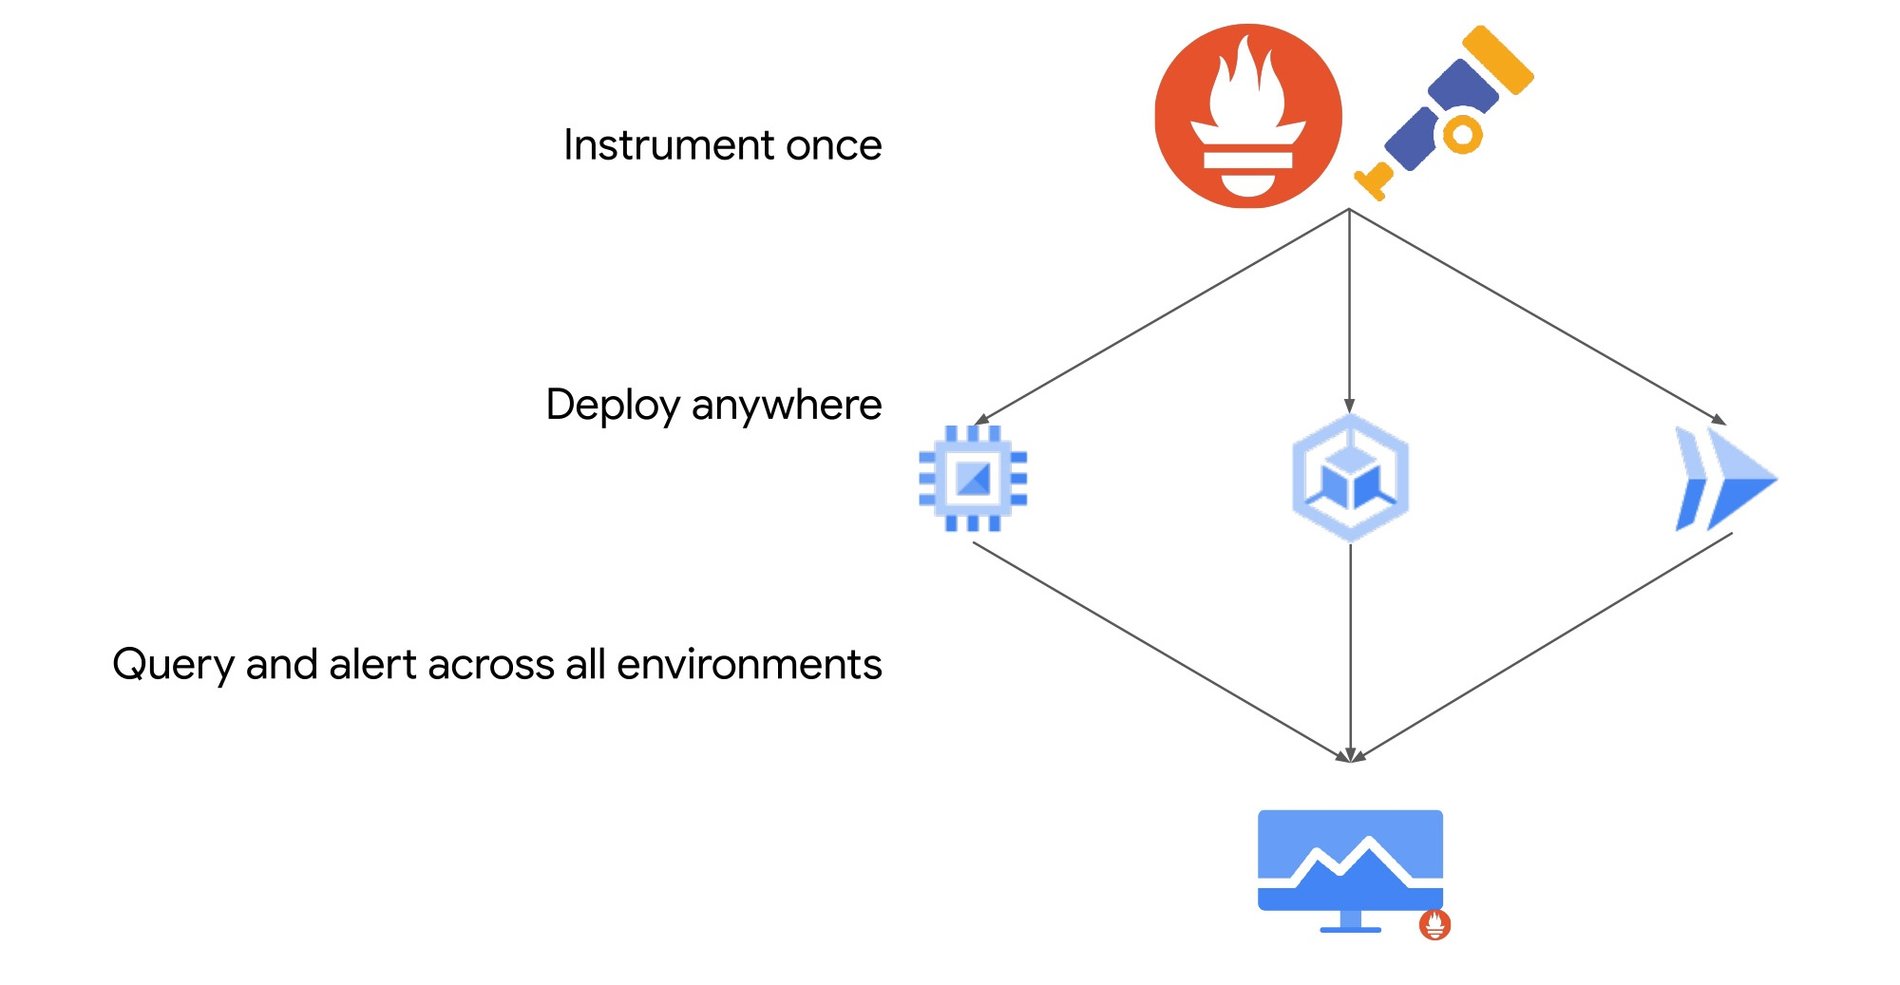

Easy cross-environment, cross-runtime, cross-cloud monitoring using Managed Service for Prometheus.
By combining the power and flexibility of Cloud Run sidecars with the simplicity of Managed Service for Prometheus, metrics coming from Cloud Run can be ingested without requiring complicated collection configuration. You simply add the collector sidecar image to your Cloud Run Service and Google Cloud handles the rest. If you collect the same Prometheus metric in GKE or Compute Engine, then you can easily and intuitively query that metric across all your environments.
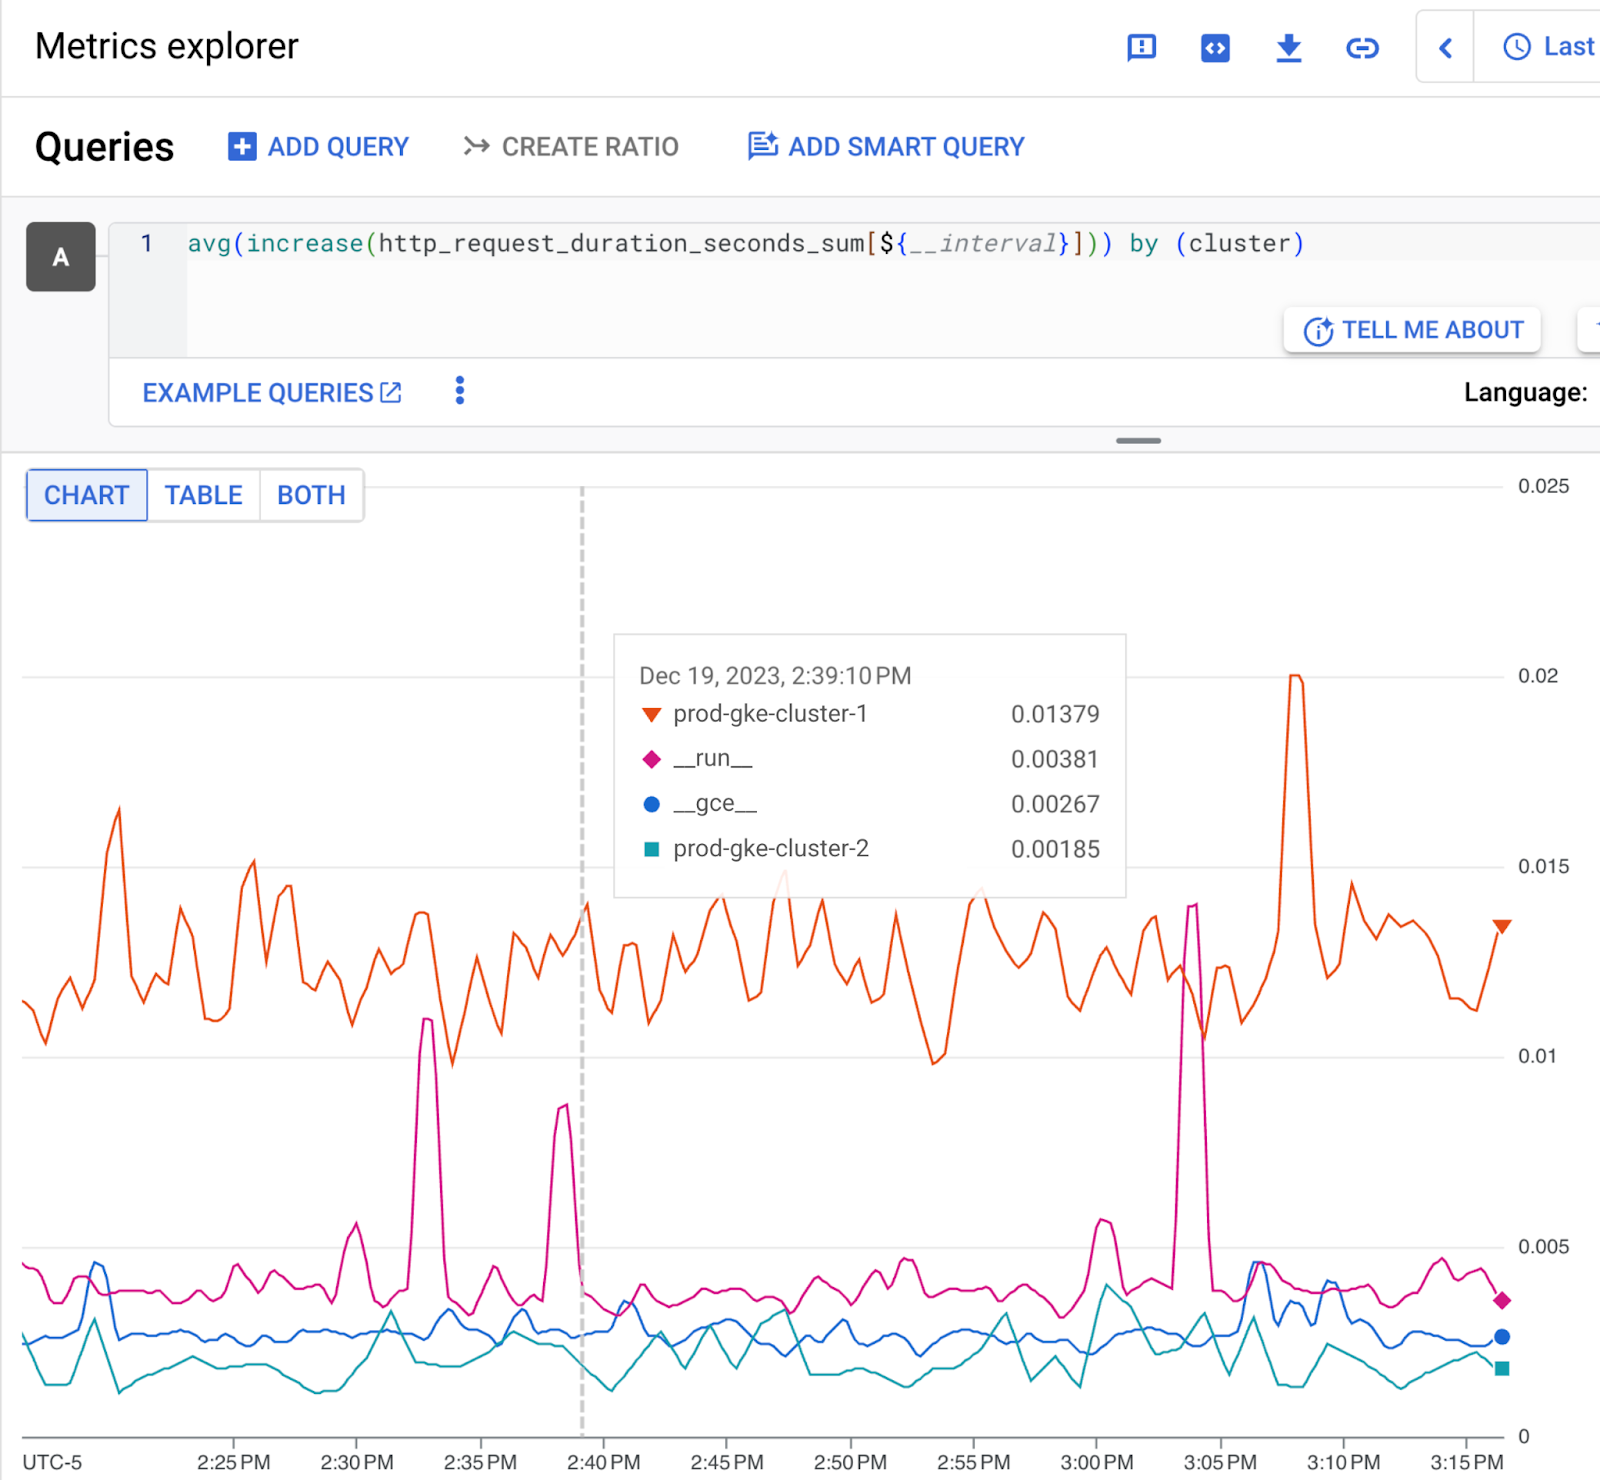

Querying the same metric across runtimes using a single line of PromQL in the Cloud Monitoring UI.
Better observability for serverless environments
Many Cloud Run customers use the out-of-the-box Cloud Run metrics in Cloud Monitoring. However, while those metrics give good information about the performance of a service, they do not expose any information that comes from inside the application itself and cannot be customized by end users. With support for Managed Service for Prometheus in Cloud Run, you can now monitor and alert on business metrics, runtime metrics, or anything else that can be exposed as a time series from within a Cloud Run deployment.
Supporting Prometheus metrics on Cloud Run also makes it easier for you to migrate from Kubernetes to Cloud Run. Prometheus has emerged as the de-facto standard for monitoring Kubernetes and is being used by 86% of the Cloud Native community. With this release, users can deploy the same applications to either Cloud Run or GKE based on their preferences without having to rewrite their metrics, give up the wealth of resources created by the open-source community, or change any of their monitoring, querying, or alerting practices. You can use the same exact metrics packages, charts and dashboards, and real-time alerts that you already have in place, regardless of the runtime environments you choose to use.
This release supports Prometheus conventions and “pull” (scraped by a server) metrics. For customers who prefer OpenTelemetry conventions or “push” (directly exported to a server) metrics, Cloud Run also supports writing OTLP metrics using an OpenTelemetry sidecar.
Getting started
This feature is available and ready to use in all Cloud Run deployments. For more information and instructions, please review the “Use the Prometheus sidecar for Cloud Run” section of the Managed Service for Prometheus documentation.
If you’d like to learn more, join us for our webinar Instrumenting Cloud Run with Prometheus or OpenTelemetry metrics on March 5th, 2024 to learn more!
