How to build a BI dashboard using Google Data Studio and BigQuery
Pradnya Khadapkar
Technical Program Manager, Google Cloud
Building BI dashboards on GCP is easy with this simple solution.
For as long as business intelligence (BI) has been around, visualization tools have played an important role in helping analysts and decision-makers quickly get insights from data.
In our current era of big data analytics, that premise still holds. To provide an integrated platform for building BI dashboards on top of big data, GCP offers the combination of Google BigQuery, a cloud-native data warehouse that helps you analyze petabytes of data quickly, and Google Data Studio, a free tool that helps you quickly create beautiful reports. (Google partners such as Looker, Tableau and Zoomdata also provide paid visualization tools on top of BigQuery, but that’s a topic for a different time.)
In this post, you’ll learn how to build a BI dashboard with Data Studio as the front end, and powered by BigQuery on the back end (with some help from Google App Engine for added efficiency). It assumes some familiarity with those products; for more information, review the background docs (BigQuery concepts, Data Studio overview, App Engine concepts).
Use case and solution overview
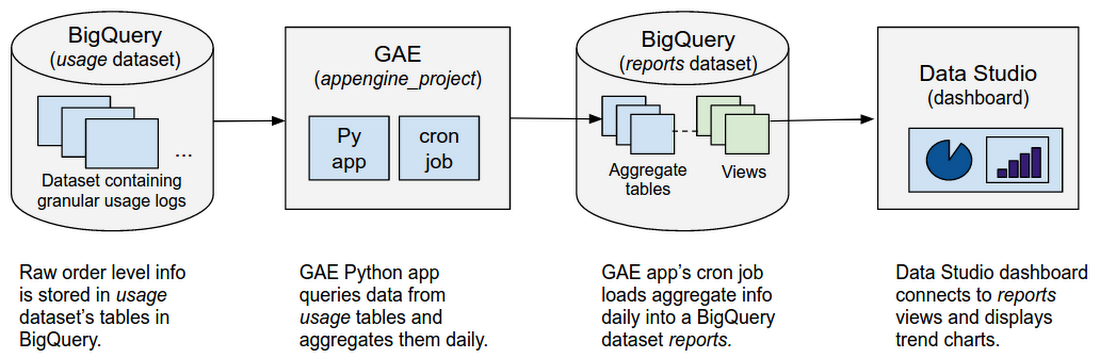
Imagine that you work for an online retailer that bases important decisions on customer interaction data in the form of large amounts (multiple TBs) of usage logs stored as date-partitioned tables in a BigQuery dataset called usage. To get business value out of that data as quickly as possible, you want to build a dashboard for analysts that will provide visualizations of trends and patterns in your data.The good news is that a connector is available that lets you query data stored in BigQuery directly from Data Studio. Even though Data Studio caches the results, if the dashboard editor refreshes the dashboard or a user filters dashboard results that are not available in cache, another query will run. In our example, this situation could be expensive, as the usage dataset stores granular logs and thus will end up querying multiple TBs of data.
Fortunately, this solution works around that issue. Typically, a dashboard shows an aggregated view of usage — it doesn’t need details all the way to the level of an order ID for instance. So here, to reduce query costs, you'll first aggregate usage logs into another dataset called reports. Then, you'll query the reports dataset from the Data Studio dashboard. This way, when your dashboard is refreshed, the reporting dataset queries process less data. Plus, since usage logs from the past never change, you'll only refresh new usage data into the reports dataset.
Next, you’ll learn how to build this solution step by step.
Step 1: Create a reports dataset in BigQuery to store aggregate metrics.
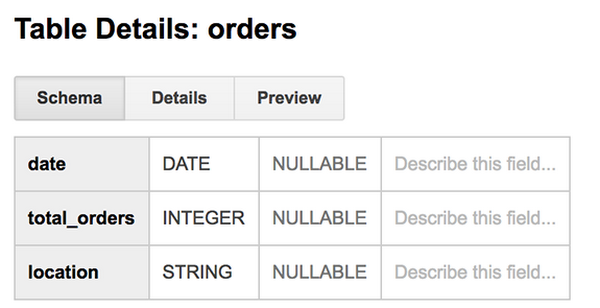
Using the BigQuery Web UI, create a new dataset called reports in the same project as the usage dataset. A separate reports dataset has a couple of benefits. It reduces the amount of data queried by the dashboard. And, cuts unnecessary access to your source datasets, by users who are only interested in aggregated data. Once you figure out what usage metrics you want to display on the dashboard, create the respective tables in the reporting dataset. Use the BigQuery Web UI to create the tables.For e.g., we created reports.orders table, which stores aggregate orders by date and location.
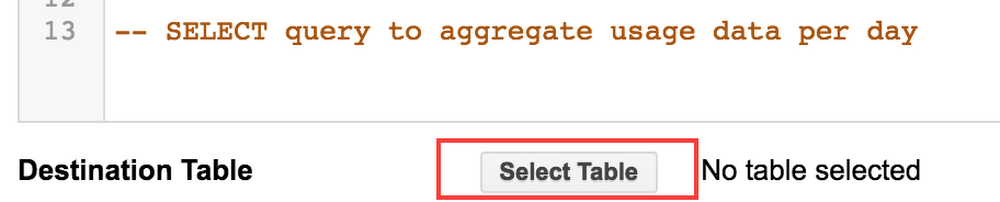
After creating the dataset and table, run a one-time query that will get the aggregate usage from usage logs dataset and write it into the reports dataset table. For example, the query below will get total orders completed each day for the last 180 days by location.
In the BigQuery Web UI used to write the query, select the reports dataset table as the Destination Table.
After writing historical usage to the reporting dataset table for the first time, you only need to update it with the latest usage data daily. The next step explains how to do that using App Engine.
Step 2: Create an App Engine app that queries the usage dataset and loads results into the reporting dataset.
BigQuery doesn’t provide a mechanism for scheduling queries. Instead, you can do that by creating an App Engineapp that runs a query and loads results into the reporting dataset. A cron job will schedule this app run daily, and the Authorized Views feature in BigQuery will restrict access to these datasets as needed.
Step 2a: Let’s start by writing the query to get yesterday’s usage summary from usage dataset. First, you'll write the query in BigQuery Web UI to verify that it works as expected. This is a simple query that only accounts for total orders that were completed on a given day. If an order is processing today but completes tomorrow, it will be accounted for in tomorrow’s total_orders.
Create a view from this query and save it in the reports dataset, called reports.daily_order_summary. Grant Authorized View access for the reports.daily_order_summary view on the usage dataset.
Step 2b: Next, create an App Engine app. You can either create a new project or use an existing project ID. (If you need more details on creating an app, see this example.)
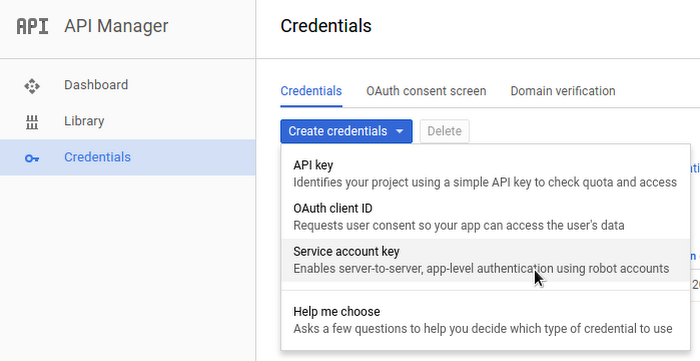
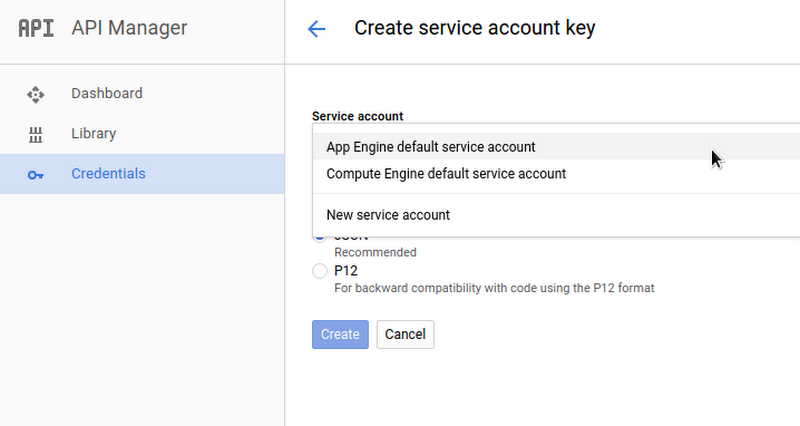
Step 2c: Go to Cloud Console API Manager and create an App Engine default service account that will be used to run the queries on reports dataset. Note the service account name.
In the BigQuery web UI, grant edit access to this service account on the reports dataset.
Step 2d: Use BigQuery APIs in the App Engine app to run the query from Step 2a, using Application Default Credentials for authentication. In the example below, asynchronous queries are used. The output of the query is also appended into the destination reports table using, writeDisposition: WRITE_APPEND.
Furthermore, you can also use BigQuery DML to backfill historical data in the reports dataset using UPDATE or, to avoid too much historical data in the reports dataset, using DELETE. For example, if you only want to maintain trailing 24 months of data in the reports dataset, you can DELETE records older than 24 months.
Step 2e: Create a cron job to invoke the app daily. For example, add the following to the app’s cron.yaml.
Step 2f: Deploy the app.
Step 3: Create views in the reports dataset with data to be displayed in the dashboard.
Now that you have aggregate data in the reports dataset updated daily, you'll create views for the data to be displayed on the dashboard. Example views include monthly trends of total orders by location, and a monthly scorecard showing total orders placed last month along with the top originating locations for orders.To do that, you would write the queries to extract this information and then create views from these queries (for example, reports.monthly_order_trends and reports.monthly_scorecard). You can then grant read access on these reporting views to relevant users.
Step 4: Create new data sources in Data Studio.
Create data sources for each of the views created in Step 3 in Data Studio.
Step 5: Create a new report in Data Studio.
Create a new report in Data Studio and add the data sources created in Step 4. You can represent monthly trends using bar charts. Use scorecards to highlight the total orders last month, growth % and top order locations. Below is a sample report created in Data Studio for this example.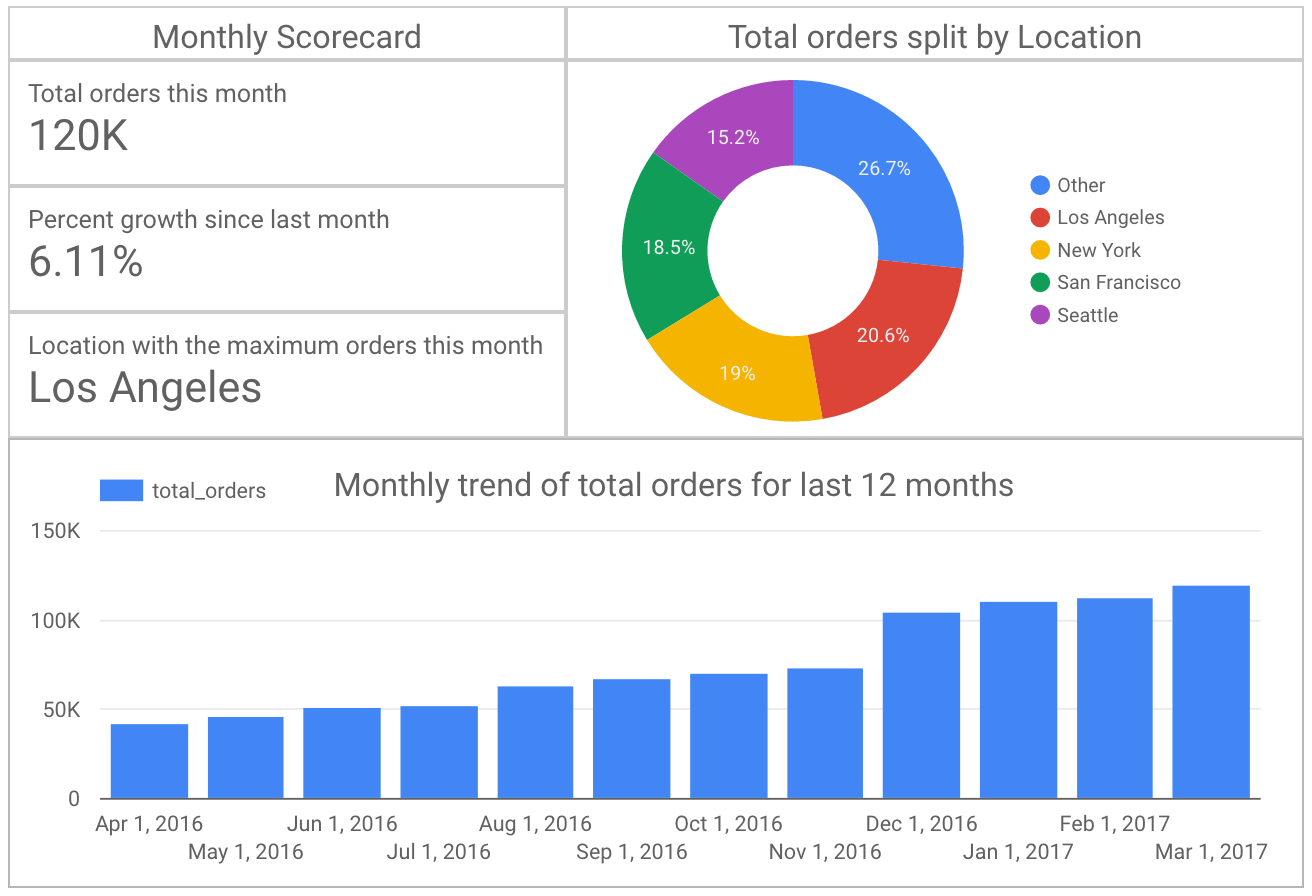
Next steps
Congratulations, you've now learned how to build a BI dashboard for visualizing patterns in your customer data (and with less risk of expensive query volumes).For more information about similar projects, explore the following: