Google Cloud Platform for Data Scientists: Using R with Google BigQuery, Part 2 (storing and retrieving data frames)
Gus Class
Developer Programs Engineer, Google Cloud
In a previous blog post, we talked about how to query public datasets for analysis and visualization in R. This is a great option when you have a dataset available on BigQuery (GCP’s fully-managed data warehouse service).
The natural next question you may have is, "How do I take data that I've processed in R and store it in BigQuery?" By doing that, you can query your data frame from BigQuery or stash analyzed data so your colleagues can import the data into their R projects or create data frames in other data science platforms, such as Python pandas.
In this blog post, you’ll learn (using bigrquery, an open source library for R created by Hadley Wickham) how to create an R data frame and stash it in BigQuery.
Then, you’ll see how to access that data frame later from the BigQuery web interface and RStudio.
Create a data frame to store in BigQuery
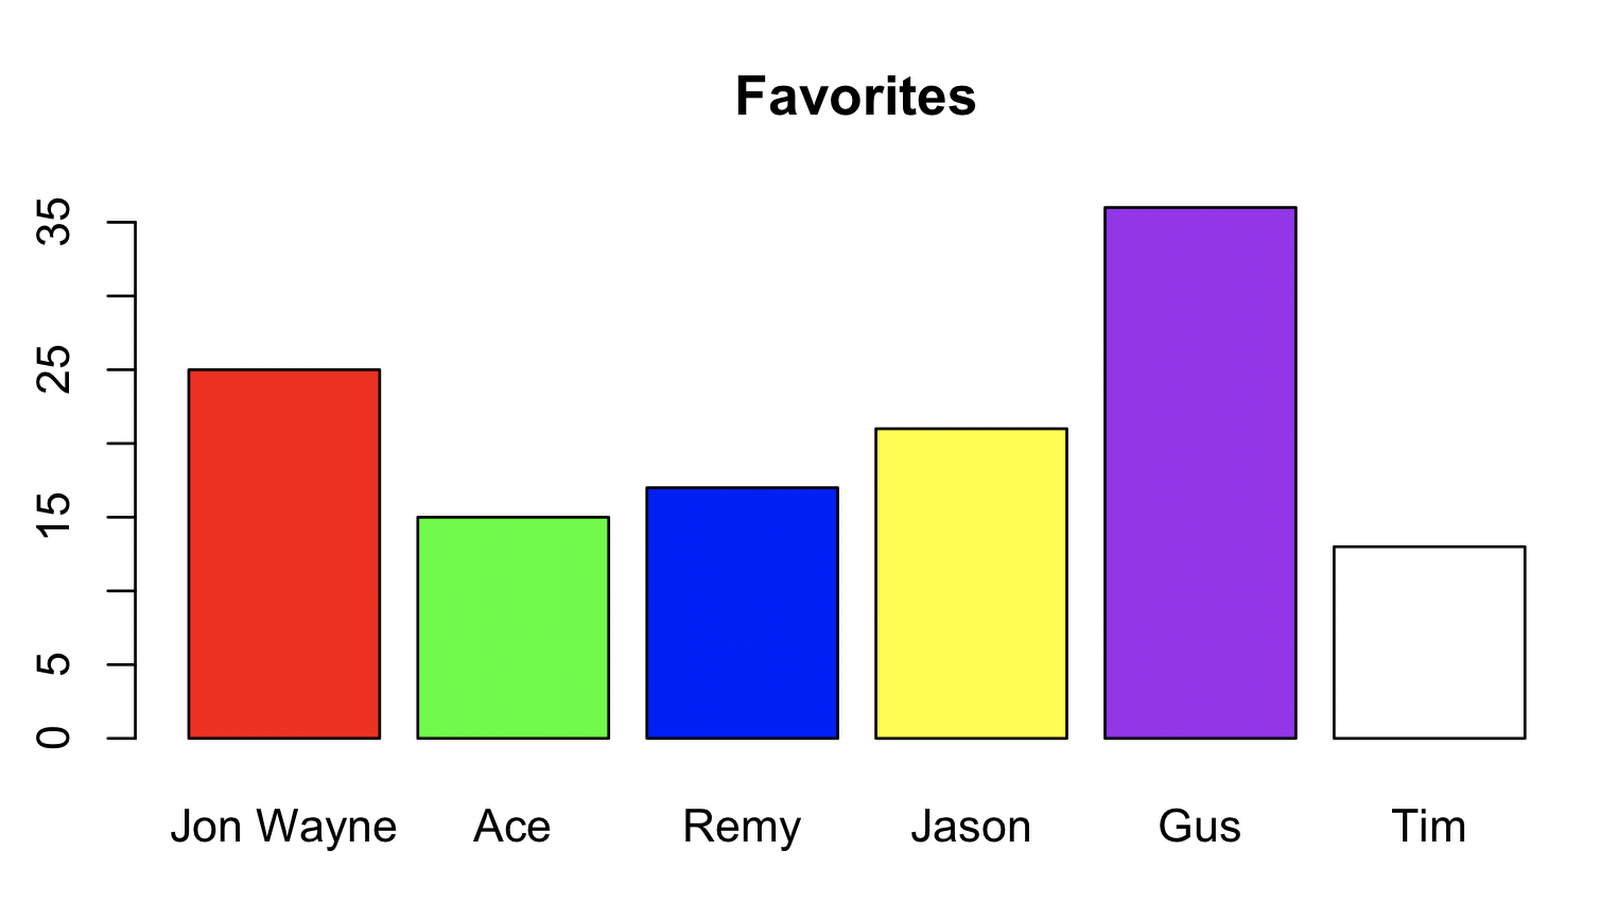
Although you probably already have a data frame that you can use, let's mock up some data that will later be stored in BigQuery. The following code creates a dummy frame from a couple of vectors:Let's inspect the frame:
Let's graph the data so that later we can visually compare the data frame we've created with the one returned from BigQuery.
The following image shows the data we've generated:
Store the data frame in BigQuery
Now that you've generated your test data, it's time to stash that data in BigQuery. First, you must make sure you've enabled BigQuery access using the Google Cloud Console.Next, using the BigQuery web interface, create a new dataset named `test_dataset`.
You're now ready to write data to BigQuery. Noting your project name and cloud project ID, store your data frame into a new table named `data_stash`:
Congratulations, you've now saved your work to the Cloud! Let's verify it's there.
Observing the data using the BigQuery web interface
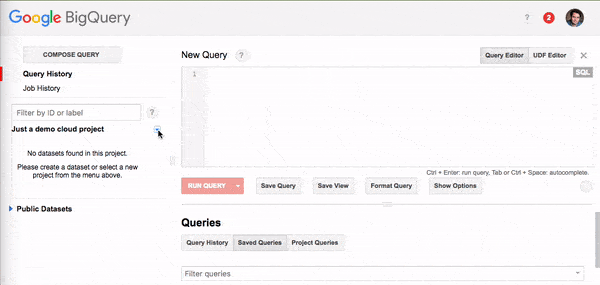
Navigate to the BigQuery web interface and select your dataset and table by clicking the link that appears in the left navigation of the console as shown below.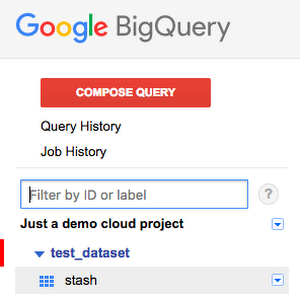
(Note: If your dataset isn't showing, inspect the Job History to see the status of your upload job. The time it takes to appear in BigQuery depends on the size of your upload job.)
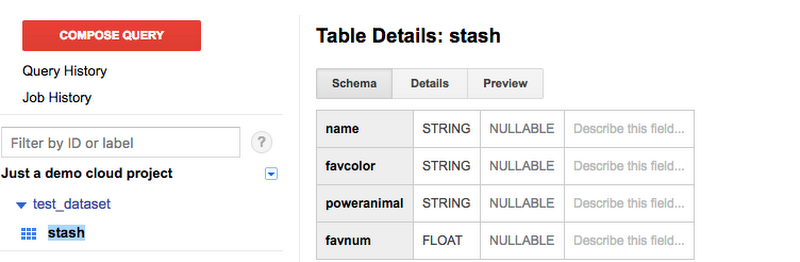
Once the table appears in your datasets, you can see the schema that was calculated based on your data frame by clicking the table (labeled stash in this example) that your upload job created.
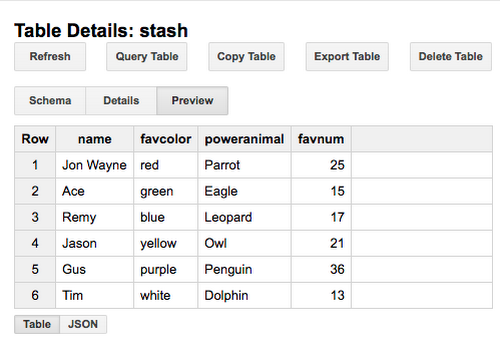
Now, let's preview the data to make sure that our data frames were published correctly by clicking on the preview tab. The data will preview as follows:
Retrieving the data from R
Now that you've stored the data in BigQuery, you can bring it back as a data frame just like we did before by using bigrquery.Inspecting the resulting frame shows the data's still there:
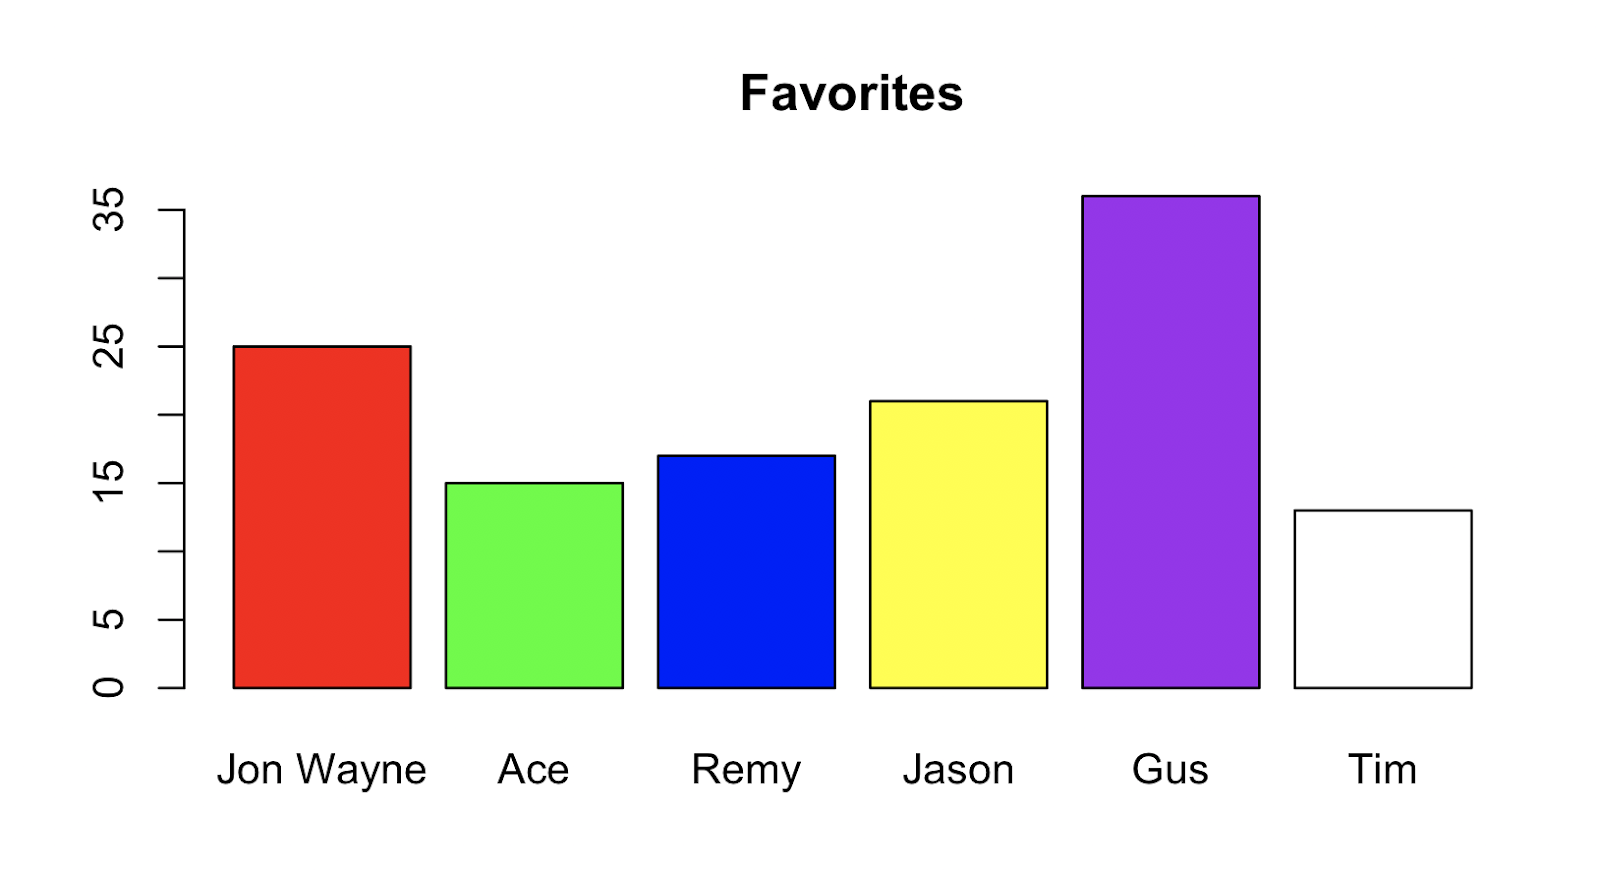
We can even verify the data by plotting just like we did before:
Wrapping up
In our previous post, we queried public data sets and analyzed the response data using R visualization tools. In this blog post, we took a data frame from R and stashed it into BigQuery. You can use this technique to share data with other data scientists, to warehouse your data, or to share data between various tools.For further exploration, you might want to try retrieving the data frame from pandas, using the JavaScript client library and D3.js to plot data, visualizing your data using Google Data Studio, or visualizing your data using Cloud Datalab.