How to set up observability for a multi-tenant GKE solution
Bon Sethi
Strategic Cloud Architect
Many of you have embraced the idea of ‘multi-tenancy’ in your Kubernetes clusters as a way to simplify operations and save money. Multi-tenancy offers a sophisticated solution for hosting applications from multiple teams on a shared cluster, thereby, enabling optimal resource utilization, simplified security and less operational overhead. While this approach presents a lot of opportunities, it comes with risks you need to account for. Specifically, you need to thoughtfully consider how you'll troubleshoot issues, handle a high volume of logs, and give developers the correct permissions to analyze those logs.
If you want to learn how to set up a GKE multi-tenant solution for best observability, this blog post is for you! We will configure multi-tenant logging on GKE using the Log Router, and setup a sink to route a tenant’s logs to their dedicated GCP project, enabling you to define how their logs get stored and analyzed, and set up alerts based on the contents of logs and charts from metrics derived from logs for quick troubleshooting.
Architecture
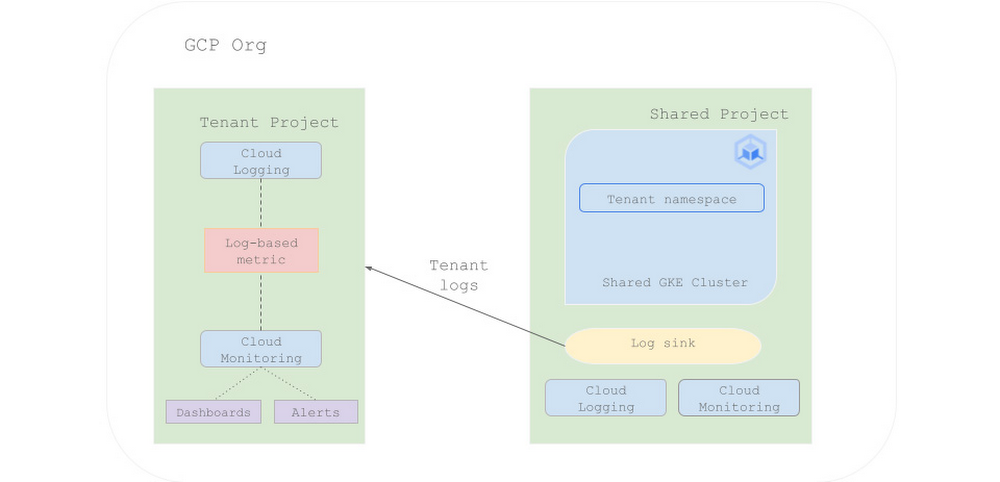
We will set up a GKE cluster shared by multiple tenants and configure a sink to route a tenant’s logs to their dedicated GCP project for analysis. We will then set up a log-based metric to count application errors from incoming log entries and set up dashboards and alerts for quick troubleshooting.
To demonstrate how this works, I am using this GCP repo on Github to simulate a common multi-tenant setup where multiple teams share a cluster, separated by namespace. The app consists of a web frontend and redis backend deployed on a shared GKE cluster. We will route frontend specific logs to the web frontend team’s dedicated GCP project. If you already have a GKE cluster shared by multiple teams, you may skip to the part where we configure a sink to route logs to a tenant’s project and set up charts and alerts. Below is the logical architecture.

Routing Overview
Incoming log entries, on GCP, pass through the Log Router behind the Cloud Logging API. Sinks in the Log Router control how and where logs get routed by checking each log entry against a set of inclusion and exclusion filters (if present). The following sink destinations are supported:
Cloud logging log buckets: Log buckets are the containers that store and organize logs data in GCP Cloud Logging. Logs stored in log buckets are indexed and optimized for real-time analysis in Logs Explorer and optionally for log analysis via Log Analytics.
Other GCP projects: This is what will be showcased in this blog post. We will be exporting a tenant’s logs to their GCP project where they can control how their logs are routed, stored and analyzed.
Pub/Sub topics: This is the recommended approach for integrating Cloud Logging logs with third-party software such as Splunk.
BigQuery datasets: Provides storage of log entries in BigQuery datasets.
Cloud Storage Buckets: To store logs for long term retention and compliance purposes.
Cloud Logging doesn’t charge to route logs to a supported destination, however, the destination charges apply. See Cloud Logging pricing for more information.
Prerequisites
You may skip this section, if you already
have a shared GKE cluster
have a separate project for the tenant to send tenant-specific logs
Set up a shared GKE cluster in the main project
Once the cluster is successfully created, create a separate namespace for the tenant. We will route all tenant-specific logs from this namespace to the tenant’s dedicated GCP project.
I am using this GCP repo to simulate a multi-tenant setup, separated by namespace. I will deploy the frontend in the tenant namespace and redis cluster in the default namespace. You may use another app if you’d like.
Set up a GCP project for the tenant by following this guide.
Sink Configuration
We’ll first create a sink in our main project (where our shared GKE cluster resides) to send all tenant-specific logs to the tenant’s project.
The above command will create a sink, in the main project, that forwards logs in the tenant’s namespace to their own project. You may use a different or more restrictive value for the --log-filter to specify which log entries get exported. See the API documentation here for information about these fields.
Optionally, you may create an exclusion filter in the main project with the GKE cluster to avoid redundant logs from being stored in both the projects. Some DevOps teams prefer this set up as it helps them to focus on the overall system operations and performance, while giving dev teams the autonomy and tooling needed to monitor their applications. To create an exclusion filter, run
The above command will create an exclusion filter for the sink that routes logs to the main project, so that tenant-specific logs only get stored in the tenant project.
Grant permissions to the main project to write logs to the tenant project
The tenant specific logs should now start flowing to the tenant project. To verify,
1. Select the tenant project from the GCP console project picker.
2. Go to the Logs Explorer page by selecting Logging from the navigation menu.
3. Tenant specific logs, routed from the main project, should show up in the Query results pane in the tenant project.
- To verify, you may run the
--log-filtervalue we passed while creating the sink. Runresource.labels.namespace_name="$TENANT_NAMESPACE"in the query-editor field and verify.
Setting up log-based metrics
We can now define log-based metrics to gain meaningful insights from incoming log entries. For example, your dev teams may want to create a log-based metric to count the number of errors of a particular type in their application and set up Cloud Monitoring charts and alert policies to triage quickly. Cloud Logging provides several system-defined metrics out-of-box to collect general usage information, however, you can define your own log-based metrics to capture information specific to your application.
To create a custom log-based metric that counts the number of incoming log entries with an error message, in your tenant project, run:
Creating a chart for a log-based metric
1. Go to the Log-based metrics page in the GCP console.
2. Find the metric you wish to view, and then select View in Metrics Explorer from the menu.
The screenshot below shows the metric being updated in real-time as log entries come in.
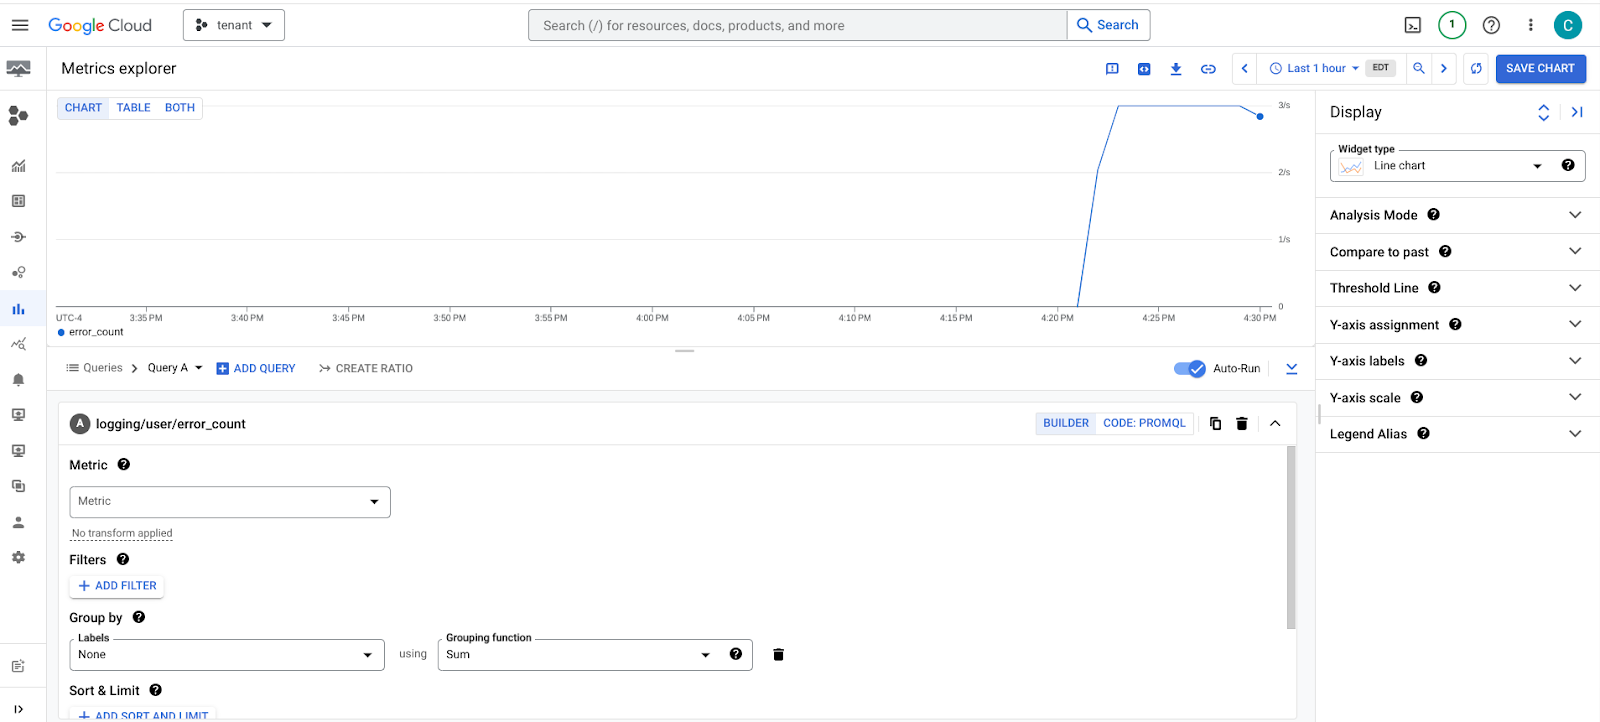

3. Optionally, you can save this chart for future reference by clicking SAVE CHART in the toolbar, and add this chart to an existing or new dashboard. This will help your dev teams monitor trends in their logs as they come in, and triage issues quickly in case of errors.
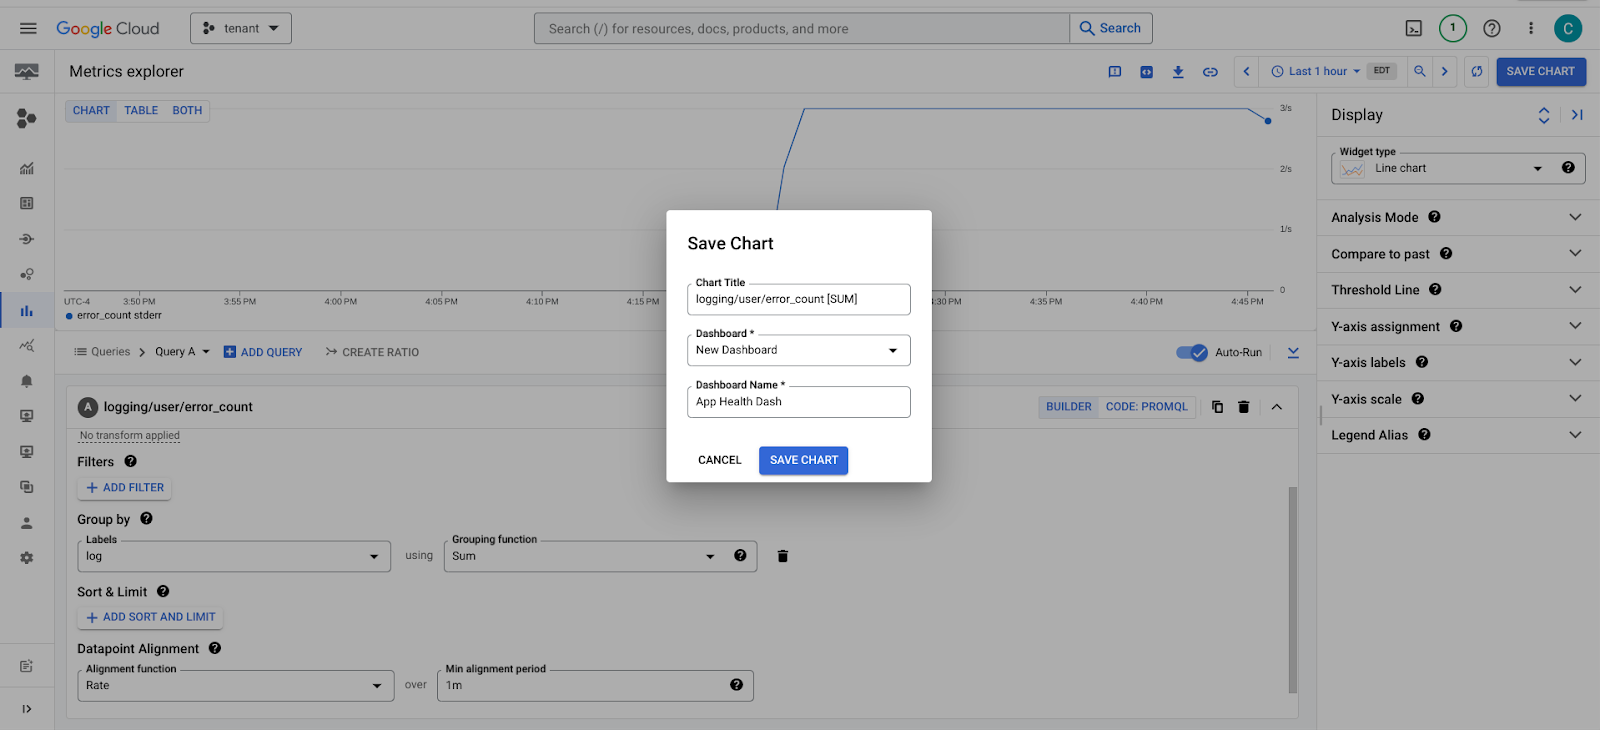

Next, we will set up an alert for our log-based metric so that the application team can catch and fix errors quickly.
Alerting on a log-based metric
Go to the Log-based metrics page in the GCP console.
Find the metric you wish to alert on, and select Create alert from metric from the menu.
Enter a value in the Monitoring filter field. In our case, this will be
metric.type="logging.googleapis.com/user/error_count"Click Next, and enter a Threshold value.
Click Next, and select the Notification channel(s) you wish to use for the alert.
Give this alert policy a name and click Create Policy.
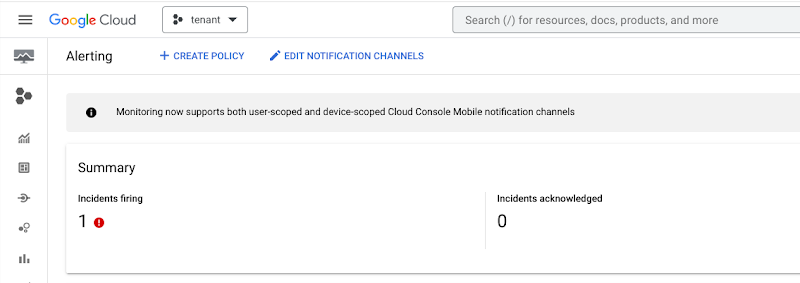
When an alert triggers, a notification with incident details will be sent to the notification channel selected above. Your dev team (tenant) will also be able to view it on their GCP console, enabling them to triage quickly.

Conclusion
In this blog post, we looked at one of the ways to empower your dev teams to effectively troubleshoot Kubernetes applications on shared GKE infrastructure. Cloud Operations suite gives you the tools and configuration options necessary to effectively monitor and troubleshoot your systems, in real-time, enabling early detection of issues and efficient troubleshooting. To learn more, check out the links below:
