Monitoring transaction ID utilization using Cloud SQL for PostgreSQL metrics
Naresh Gandi
PostgreSQL Database Engineer, Google Cloud
PostgreSQL uses transaction IDs (also called TXIDs or XIDs) to implement Multi-Version Concurrency Control semantics (MVCC). The PostgreSQL documentation explains the role of XIDs as follows:
PostgreSQL's MVCC transaction semantics depend on being able to compare transaction ID (XID) numbers: a row version with an insertion XID greater than the current transaction's XID is “in the future” and should not be visible to the current transaction. But since transaction IDs have limited size (32 bits), a cluster that runs for a long time would suffer transaction ID wraparound: the XID counter wraps around to zero, and all of a sudden transactions that were in the past appear to be in the future - which means their output becomes invisible. In short, catastrophic data loss. (...) The maximum time that a table can go unvacuumed is two billion transactions (...). If it were to go unvacuumed for longer than that, data loss could result.
To prevent transaction ID wraparound, PostgreSQL uses a vacuum mechanism, which operates as a background task called autovacuum (enabled by default), or it can be run manually using the VACUUM command. A vacuum operation freezes committed transaction IDs and releases them for further use. You can think of this mechanism as “recycling” of transaction IDs that keeps the database operating despite using a finite number to store the transaction ID.
Vacuum can sometimes be blocked due to workload patterns, or it can become too slow to keep up with database activity. If transaction ID utilization continues to grow despite the freezing performed by autovacuum or manual vacuum, the database will eventually refuse to accept new commands to protect itself against TXID wraparound. To help you monitor your database and ensure that this doesn’t happen, Cloud SQL for PostgreSQL introduced three new metrics:
transaction_id_utilizationtransaction_id_countoldest_transaction_age
Understanding the transaction metrics
Guidance provided in this section applies to PostgreSQL databases running with default vacuum settings. You might observe different TXID utilization patterns if your database is deliberately configured to delay vacuum operations e.g. for performance reasons.
Recommendations regarding the detection and mitigation of TXID utilization issues should apply to all databases regardless of configuration.
Transaction ID utilization and count
A transaction ID is assigned when the transaction starts, and it is frozen when the transaction is vacuumed. With that, TXID utilization is the number of unvacuumed transactions (“assigned” minus “frozen”) expressed as a fraction of the 2-billion maximum.
Under the default PostgreSQL settings, with vacuum processes performing optimally and without interruption, most databases experience TXID utilization in the region of ~10%. Higher utilization levels can be observed in busy databases where vacuum frequently yields to regular workloads. If the utilization trends towards very high values (80% or more), the database might be at risk of TXID exhaustion unless vacuum is allowed to make quicker progress.
Cloud SQL provides two metrics to describe TXID usage:
database/postgresql/transaction_id_utilizationrecords the number of unvacuumed transactions as a fraction of the 2-billion maximum. You can use this metric for monitoring or alerting to ensure that the database isn’t experiencing a shortage of transaction IDs.database/postgresql/transaction_id_countrecords the number of TXIDs assigned and frozen. You can use this metric to learn more about your TXID allocation and vacuum patterns e.g. how many TXIDs are allocated each second/minute/hour during peak load.
Example
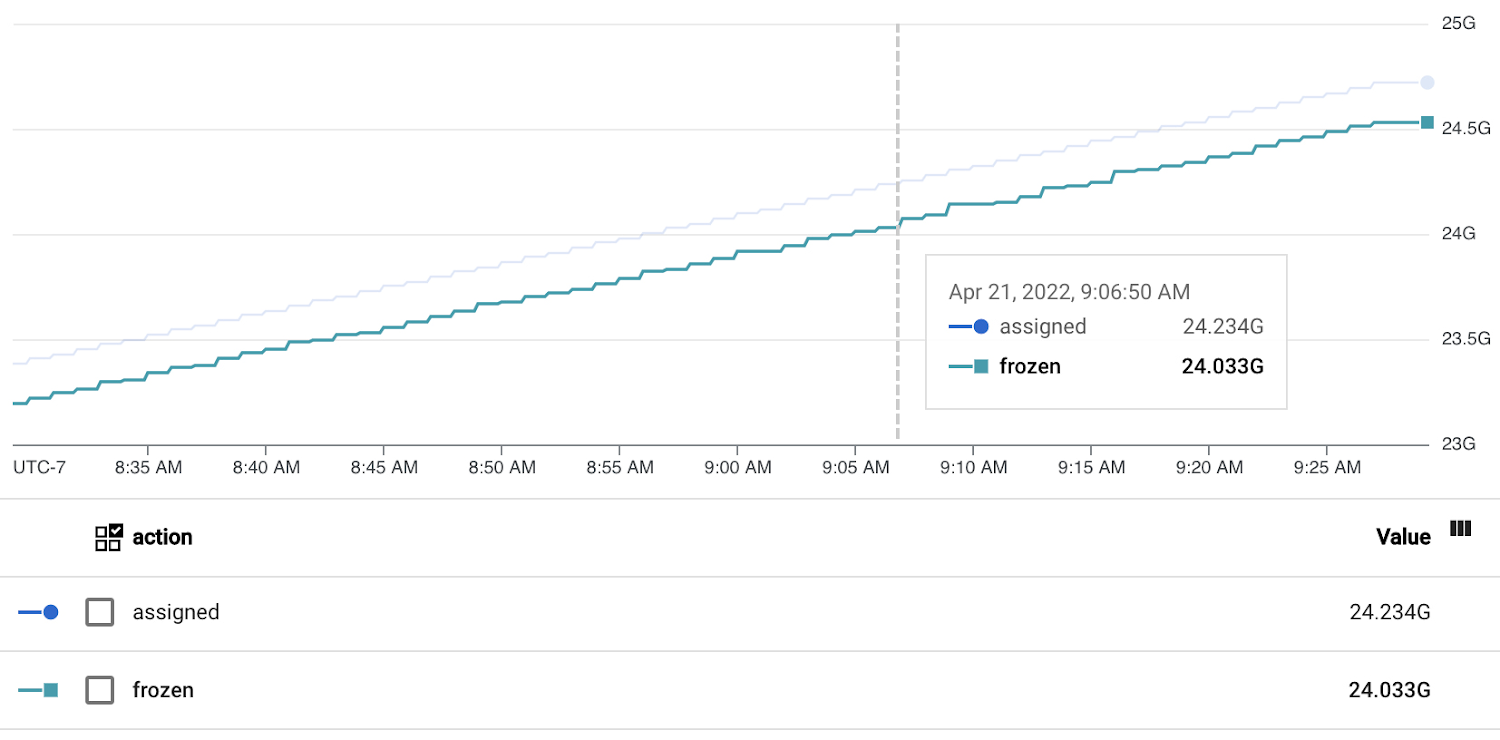
The chart below shows the transaction_id_count metric with a ~200 million difference between the “assigned” and “frozen” TXID. This might seem like a large number, but it’s only ~10% of the 2-billion maximum, and the pattern remains stable with no sign of long-term divergence. This is a happy database!
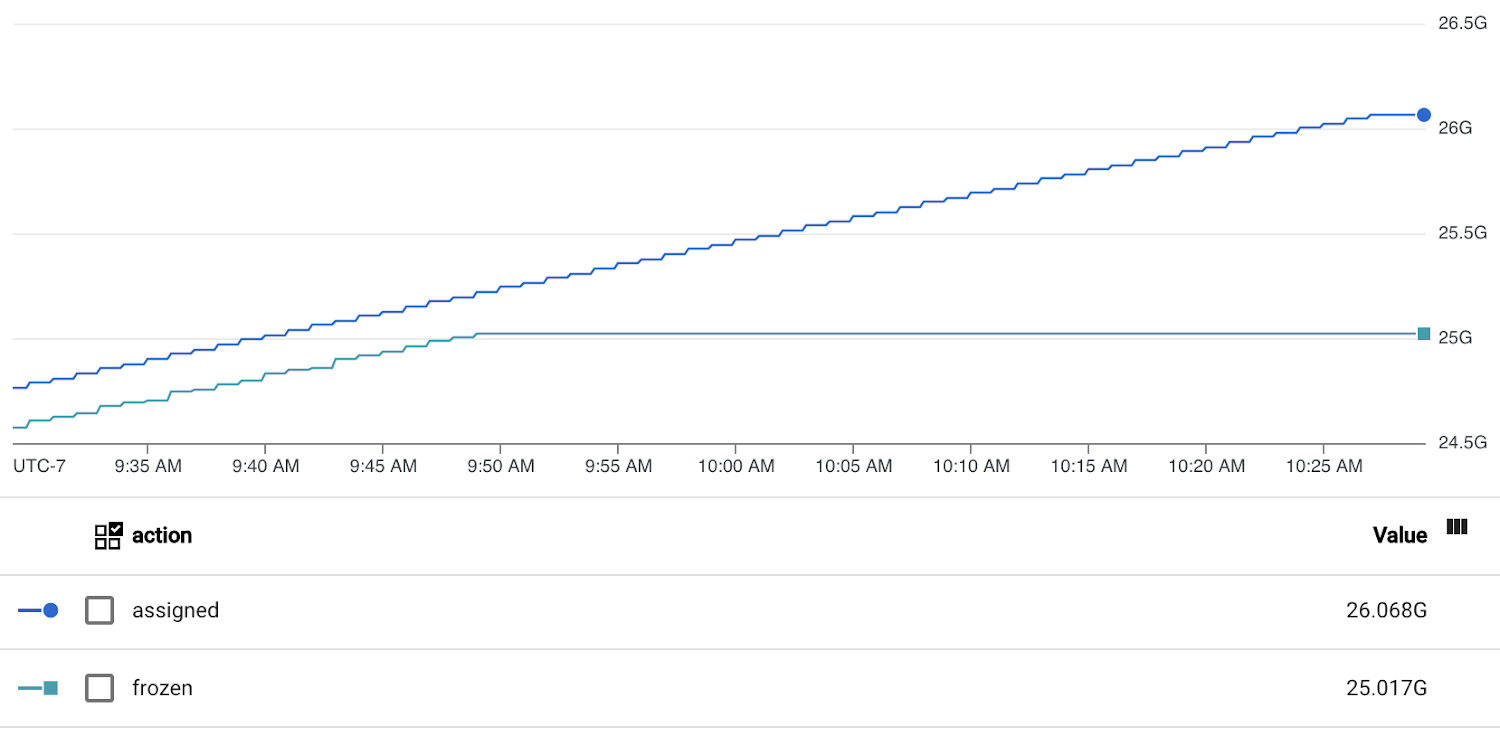
On the other hand, the chart below shows a database that continues to allocate TXIDs to new transactions, but doesn’t appear to be freezing any TXIDs. This indicates that the vacuum is blocked. The difference between “assigned” and “frozen” XIDs has already grown to ~1 billion (~50% of maximum), and this database could run out of transaction IDs if the situation persists.
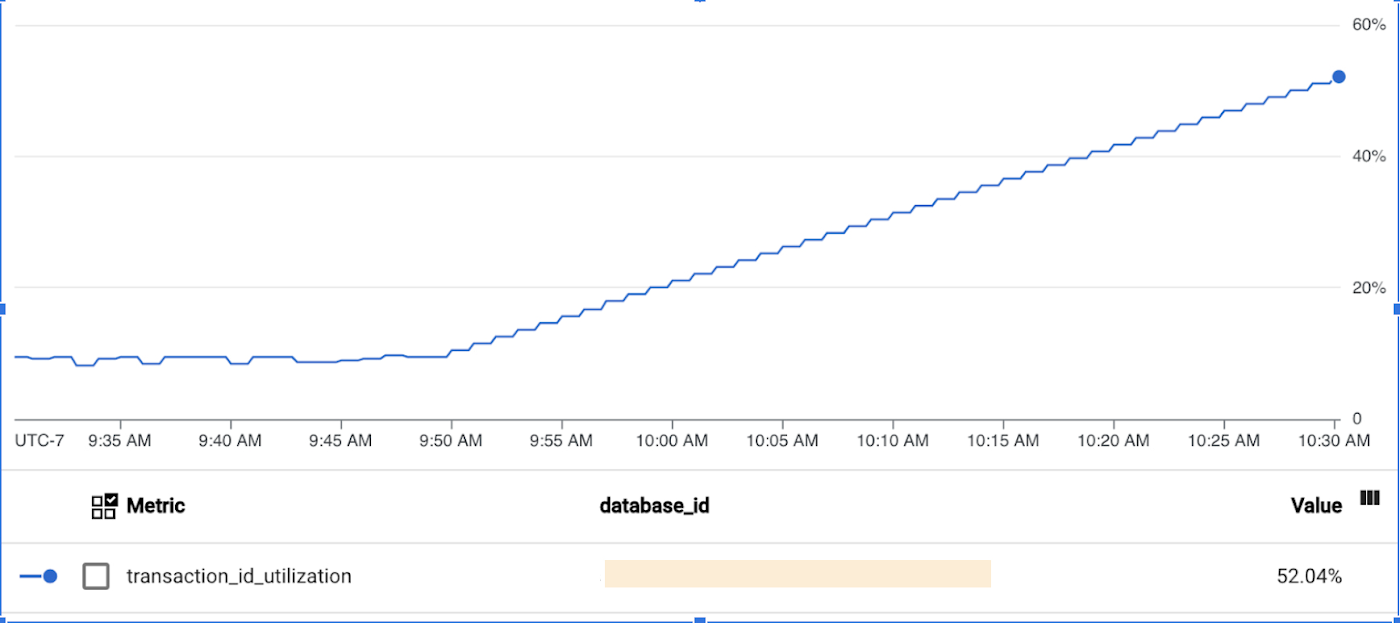
Here is the transaction_id_utilization metric for the same database:
Oldest transaction age
PostgreSQL can only vacuum committed transactions. This means that old (long-running) uncommitted transactions will block vacuum, which may eventually lead to TXID exhaustion.
The database/postgresql/vacuum/oldest_transaction_age metric tracks the age of the oldest uncommitted transaction in the PostgreSQL instance, measured in the number of transactions that started since the oldest transaction.
There’s no single recommended value or threshold for this metric, but you can use it to gain additional insight in your workload, and determine whether transaction age may contribute to a vacuum backlog.
Example
Assume that the oldest transaction age is 50 million, which means that vacuum won’t be able to process the 50 million transactions that started after the oldest one. The value itself is neither good nor bad: 50 million transactions might be a lot on a database that’s mostly idle, or it might be just over an hour's worth of workload on a busy server that runs 13k transitions per second. The metric value does indicate the presence of a long-running transaction, but a backlog of 50 million TXIDs is a very small portion of the 2-billion maximum, so the transaction doesn’t create a high risk of TXID exhaustion. You could optimize the transaction for performance and efficiency reasons, but there’s no immediate reason for concern regarding vacuum.
However, what if the oldest transaction age is 1.5 billion? It not only indicates that a transaction has been running for a very long time, but the transaction also prevents vacuum from freezing 75% of the total TXID range. This situation warrants a closer investigation, because the transaction has a major impact on vacuum, and might push the database towards TXID exhaustion.
Working with metrics
You can interact with the transaction metrics through the familiar Cloud SQL tools and features:
Use Metrics Explorer to view and chart the metrics.
Access the metrics programmatically with the Cloud Monitoring API.
Use dashboards for convenient manual monitoring.
Create alerting policies for automated notifications on the key metrics.
This section provides examples using the transaction_id_utilization metric. You can follow similar steps for the other metrics.
Charting transaction ID utilization in Metrics Explorer
Follow these instructions to chart transaction_id_utilization using Metrics Explorer. Note that Metrics Explorer displays the values as a percentage between 0% and 100%, but the underlying metric is a number on the scale of 0.0 to 1.0. When accessing the metric programmatically, you can calculate percentages by multiplying the raw value by 100%.
To chart the transaction ID utilization metric, do the following:
In the Cloud Console, select Monitoring. You can also use this direct link: Go to Monitoring
In the navigation menu on the left, Metrics Explorer.
Select the Explorer tab, and the Configuration dialog. They might be pre-selected by default.
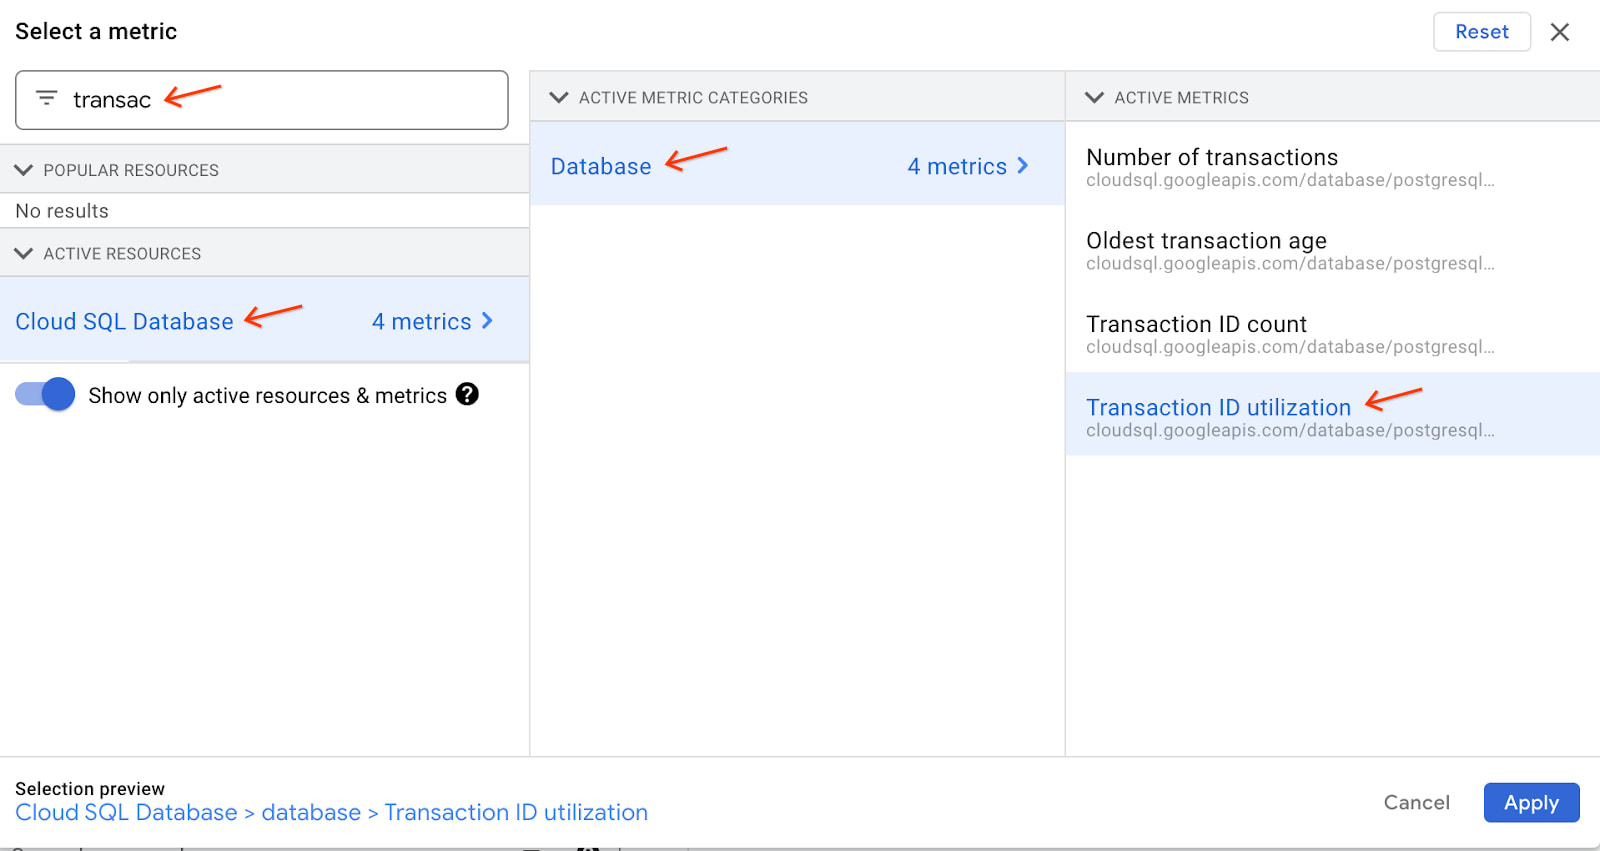
Under the “Resource & Metric” section, expand the Select a metric drop-down menu.
Choose the Transaction ID utilization metric under “Cloud SQL Database” resource, “Database” category. You’ll be able to find the metric more easily after typing “transaction” into the search box:
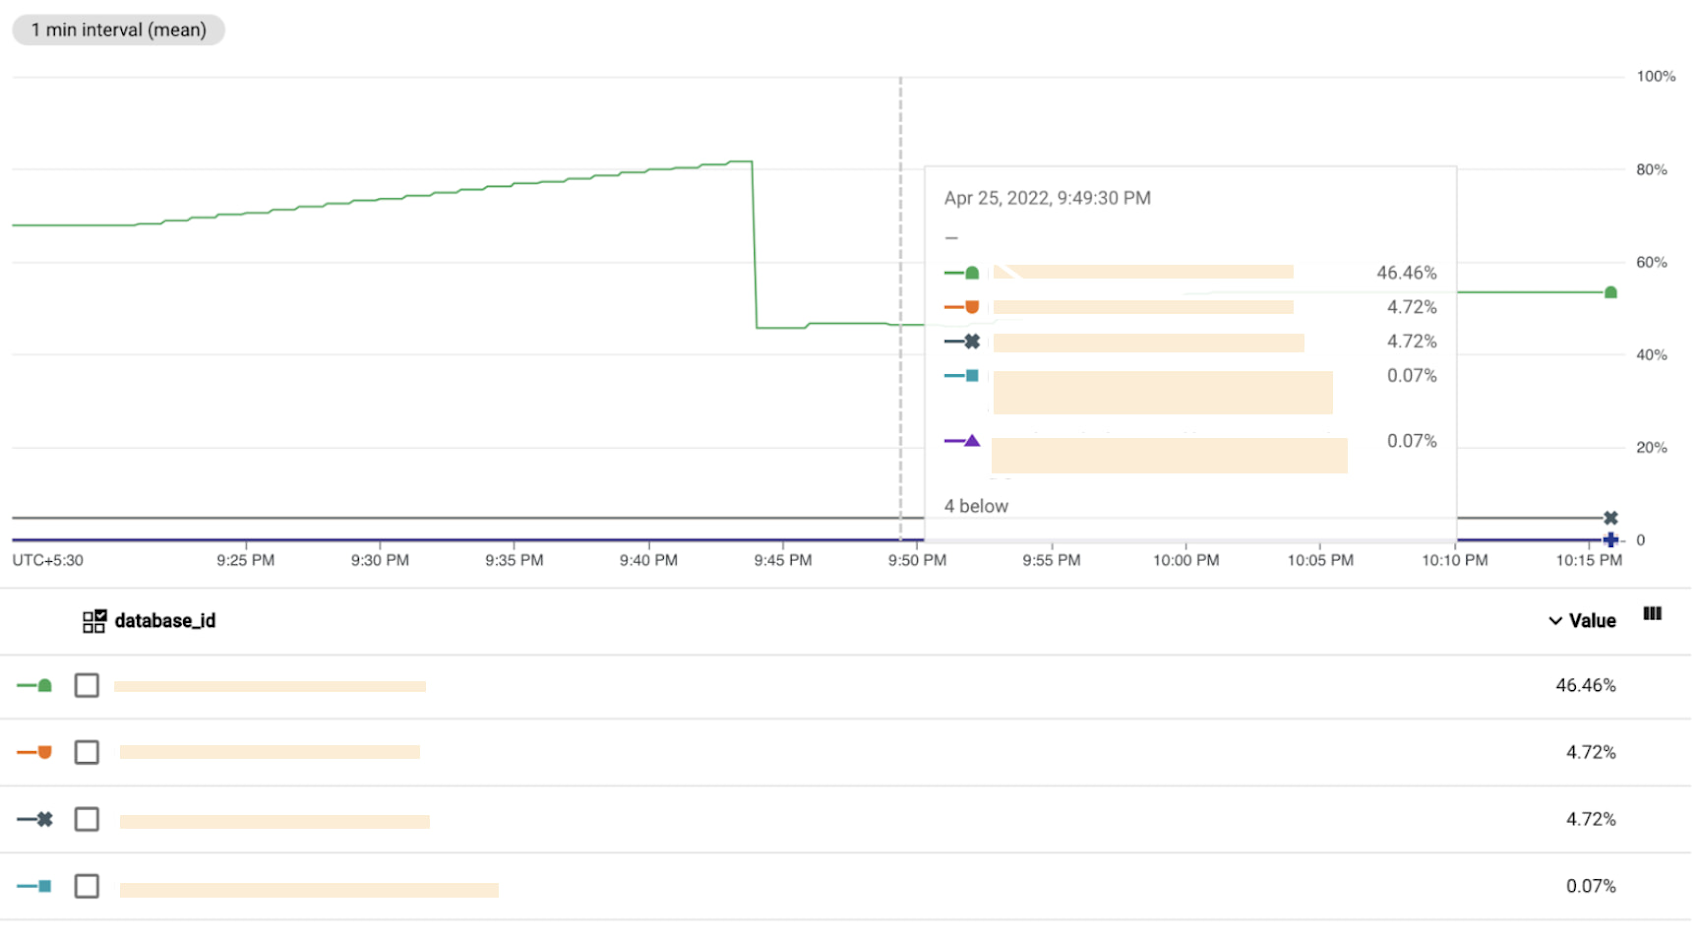
You should now see the transaction ID utilization metric for all the instances in the project:
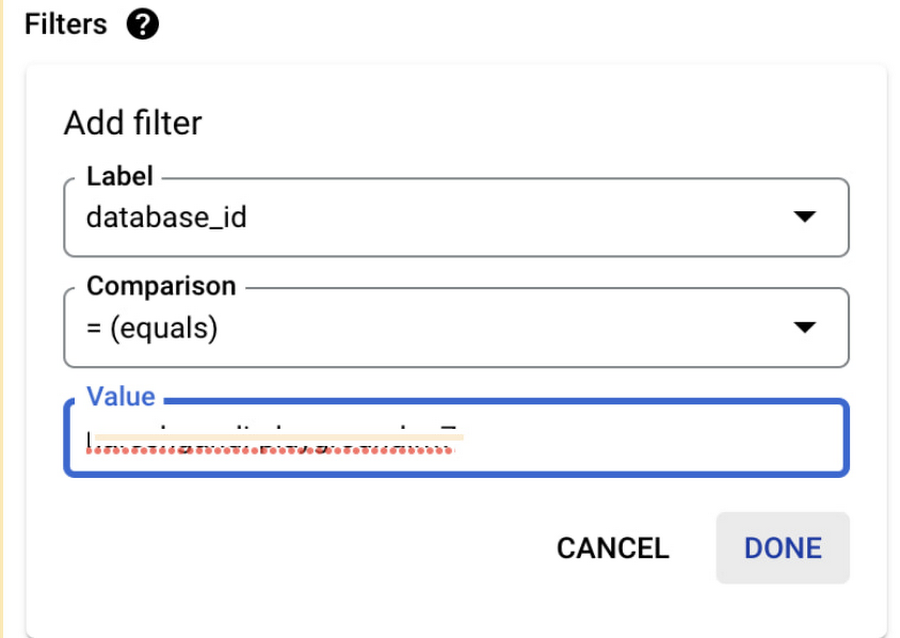
Optionally, you can add a filter to see the metric for a specific instance instead of all instances:
Under the “Filters” section, click Add Filter. A filter form will appear.
In the Label field, select database_id.
In the Comparison field, select (= equals).
Type your instance name in the Value field.
Confirm by clicking Done.
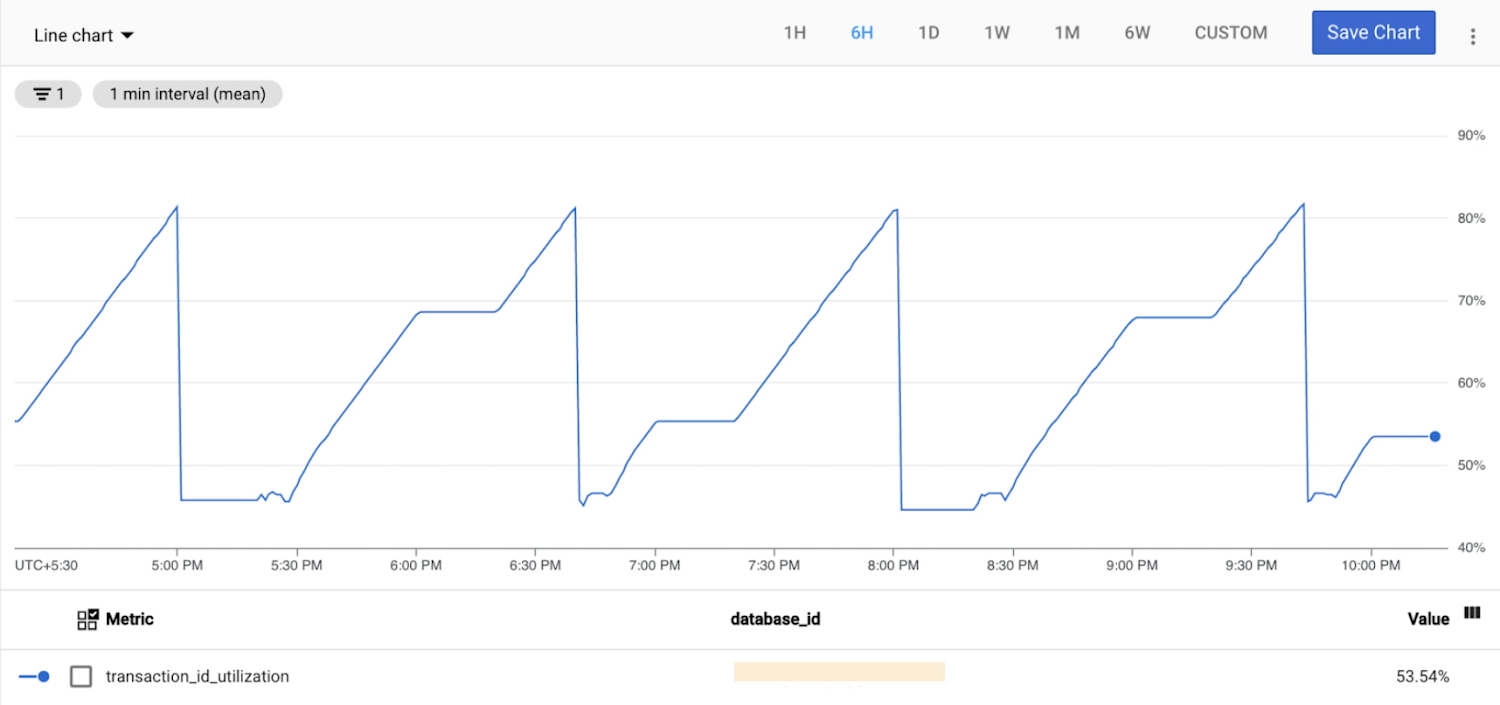
The filtered chart should now contain only one line depicting transaction ID utilization for a single instance:
As a useful exercise, you can view this metric for a number of your instances and try to explain any spikes or trends using your knowledge about the instance’s workload patterns.
Creating an alerting policy on transaction ID utilization
As explained previously, if the transaction id utilization reaches 100%, the database would no longer allow write operations to protect itself against XID wraparound. It’s therefore important to monitor the transaction ID utilization metric on mission-critical PostgreSQL databases.
You can create an alerting policy to receive an automatic notification if the metric breaches a pre-configured threshold. A well-chosen threshold should serve two purposes:
Indicate that the database is experiencing unusual workload patterns, even if TXID wraparound is not imminent.
If the database is indeed trending towards XID wraparound, give you enough time to remedy the situation.
The following example shows how to create an alert on transaction ID utilization for the threshold value of 70%, which may be appropriate for most databases.
To create an alerting policy, do the following:
In the Cloud Console, select Monitoring. You can also use this direct link: Go to Monitoring
In the navigation menu on the left, select Alerting.
Click Create Policy near the top of the page, which will take you to the Create alerting policy dialog.
In the Select a metric drop-down menu, find the Transaction ID utilization metric.
Leave settings under Transform data unchanged for this demonstration. You can learn more about data transformations here.
Optionally, you can add filters to set up the alarm on selected instances instead of all instances.
Click the Next button at the bottom of the page, which will take you to the Configure alert trigger dialog.
Use the following settings:
Condition type: Threshold.
Alert trigger: Any time series violates.
Threshold position: Above threshold.
Threshold value: 70 (or a different value of your choice).
Optionally, provide a custom name for the condition under Advanced Options e.g. “Transaction ID Utilization High”.
Click the Next button at the bottom of the page, which will take you to the Configure notifications and finalize alert dialog.
Select your notification channel. If there are no notification channels to choose from, follow steps here to configure a notification channel.
Give the alert an easily recognizable name e.g. “Transaction ID Utilization crossed 70%”. Optionally, provide additional notes or documentation that will help you react to a notification.
Click the Create policy button at the bottom of the page.
When the alert triggers, you will receive a notification similar to this:
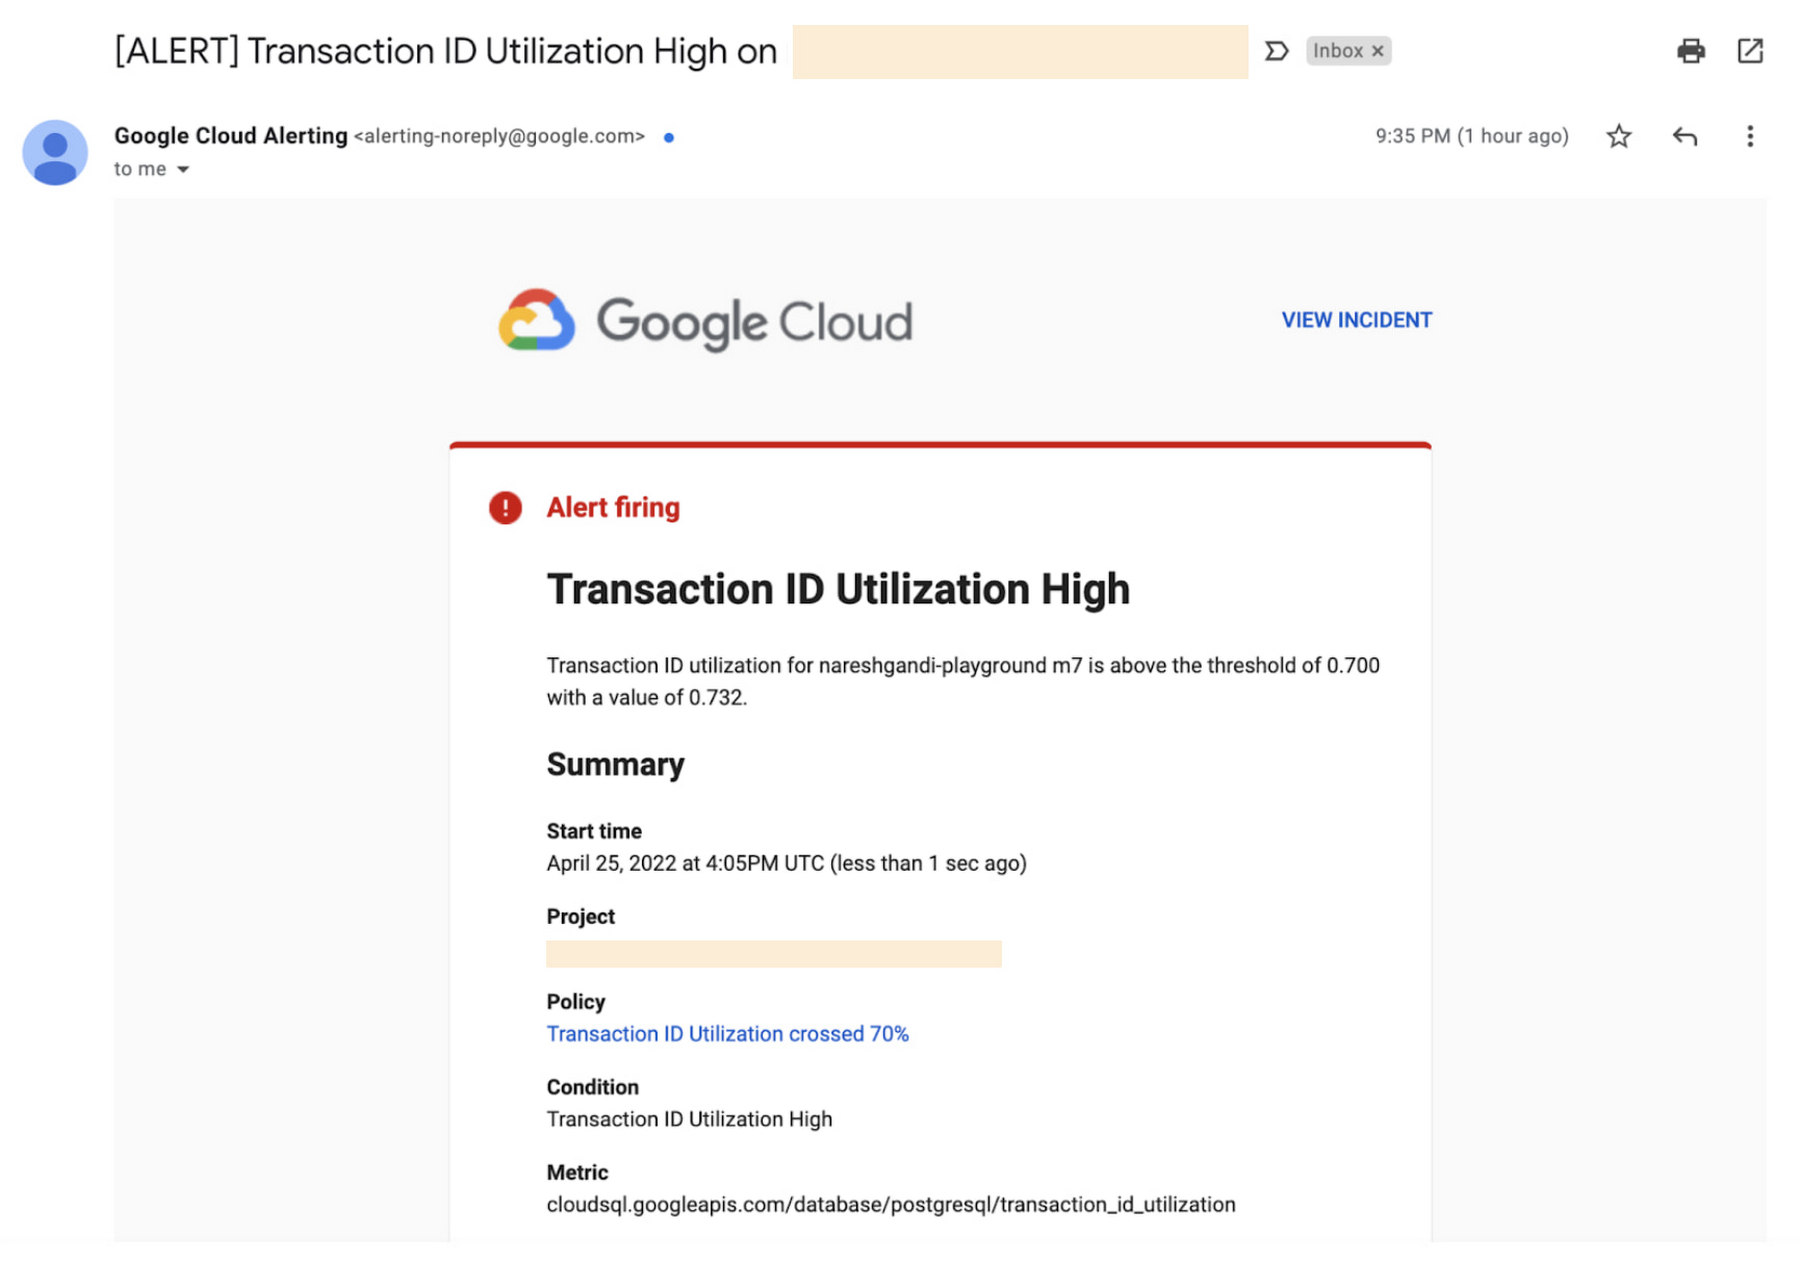
If none of your instances are currently experiencing TXID utilization high enough to trigger the notification, you can temporarily use a lower threshold for test purposes.
Conclusion
In this blog post, we demonstrated how you can explore and interpret transaction ID utilization metrics on your database instances using Cloud SQL for PostgreSQL. We also learned how to create an alert policy for transaction ID utilization on a Cloud SQL instance.