The democratization of insights: Empowering data analysts and business users
Sudhir Hasbe
Sr. Director of Product Management, Google Cloud
Ryan Lippert
Product Manager
Today, we’re kicking off a multi-part series that looks at one of the things all businesses—regardless of geography, size, or industry—have in common: they want to be data-driven. As long as there has been data, businesses have tried to use it to better understand their customers, market, and competitors. What’s changed recently is the nature of three core factors that lead to becoming data-driven: a) data availability, b) data access, and c) insight access.
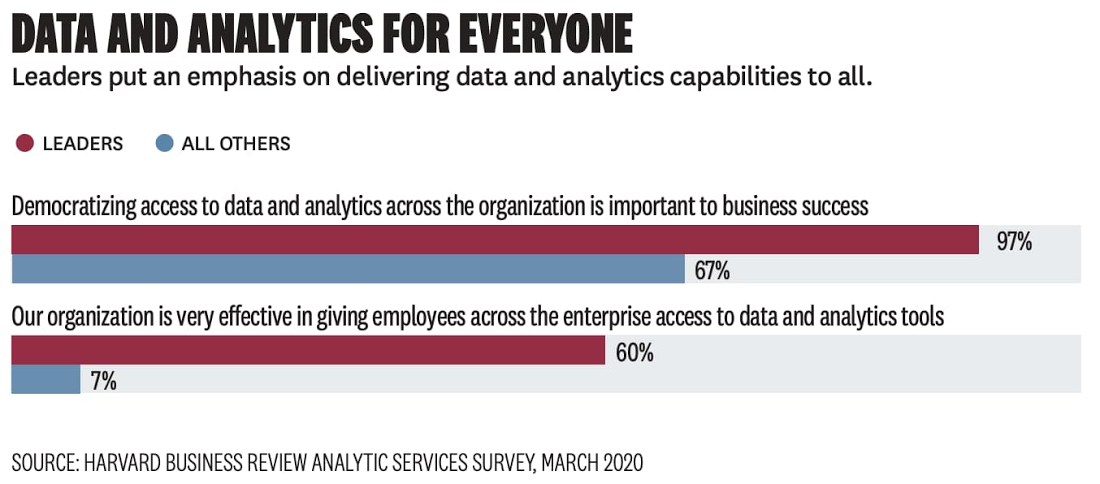
As these factors have expanded, or become “democratized,” businesses have enabled themselves to be better managed not just top-down, but also bottoms-up, middle-out, and everywhere between. A recent Google Cloud/Harvard Business Review paper confirms this: 97% of industry leaders surveyed said democratizing access to data and analytics across the organization is important to business success. This blog series will explore what it means to be “data-driven,” how this concept has changed over time, and how Google Cloud is helping customers push the boundaries of what they can do with their data.
The early days of the modern data landscape & the rise of big data
Modern enterprise reporting and business intelligence began to take form in the 1990s, when companies started using enterprise data warehouses (EDWs) as the foundation of operational reporting. A breakthrough in the ability to understand a business as it was unfolding, the EDW
let analysts ask and answer questions like “What’s today’s inventory based on yesterday’s sales?” or “What do last week’s regional sales figures look like?”.
Traditional business-oriented data and systems didn’t hold primacy for long. Almost as soon as self-service BI became available, the broader data landscape shifted, requiring new tools and new skills to generate differentiated insights from new kinds of signals. Society-wide digitization—of shopping habits, of communication, of entertainment, and more—gave companies a new window into how to better interpret and meet their customers’ needs.
A new set of big data tools (spurred by the release of academic papers describing Google’s internal technology) gave data engineering experts the ability to collect and store this new data, making it available to expert users who could generate insights. Organizations built early data lakes and, with the gains from self-service BI fresh in their minds, expected rapid value generation. Unfortunately, even with this new data made available and accessible, most business users didn’t have the skills to generate insights. The systems were too complex for novice users.
Clearly, in the new world of big and unstructured data, insights wouldn’t come just from making data available and democratizing its access. Democratization of insights, which is what really matters, had to come by expanding the capabilities of familiar tooling. Technology had to meet users where they were, not vice-versa. That’s where Google Cloud went to work.
Google Cloud: Democratizing insights through radically simplified tools
At Google Cloud, we’ve focused on empowering users to generate insights by leaning into the tools and skills they already have. The first step occurred behind the scenes. We automated the backend of our technology stack and helped pioneer the concept of “serverless” analytics, which meant resource provisioning, handling growing scale, performance tuning, deployment and other technical tasks associated with managing the stack were taken care of without user input. Users only need analysis, so Google Cloud developed simple user-facing tools that let them focus on their work while leaving machines to manage the complexity of executing user inputs.
Empowering the data analyst to generate deeper insights through data access
In democratizing and generating insights, there’s maybe no group more important to enable than data analysts. Typically the largest group of data-focused workers across Fortune-500 companies, this persona has a well-rounded grasp of both data and the business challenges that need to be solved. Unlocking new capabilities for data analysts via SQL has given our customers a whole new window into their businesses. Let’s examine how that happened.
First, the decoupling of compute and storage allowed BigQuery to store more data more economically than other data warehouses in which compute and storage scale together. This led customers to adopt a “structured data lake” approach to data warehousing and increased the prevalence of ELT (extract-load-transform) using SQL within the data warehouse itself. This democratized data access by allowing more full-fidelity data to reside in the data warehouse. More importantly, it also democratized insight generation because the expanded data access occurred within a familiar tool—the data warehouse with its familiar SQL semantics.
Next, we knew analysts wanted to access data outside the data warehouse, often in Google Cloud Storage. We built paths for them to access this data, via SQL, which allowed them to generate new insights by incorporating data not previously available to them. This object storage/data warehouse interoperability goes both ways; not only can data analysts use SQL to query object storage, but data scientists and data engineers can run Spark jobs against data in BigQuery. The result of increased data access within familiar tools is again, predictably, more insights.
Empowering the business user to drive self-service insights through intuitive tools
A huge benefit to automated systems is the ability to build easy-to-use interfaces for businesses users that make it easy for them to drive their own insights, breaking the typical “request and wait” paradigm business users have become accustomed to.
Business intelligence tools are the most common entry point for business users looking to either generate their own insights or make decisions based on the analysis generated from data analysts. Modern BI tools provide interactive, self-service capabilities that allow business users to customize the analysis that they’re driving for the specific business problem they’re looking to solve. However, these tools can only be as powerful as the system that serves the data to them. The serverless backend provided by BigQuery makes interactive, self-service BI easier than ever by providing the scalability needed for any amount of data or any number of users.
BigQuery works seamlessly with any number of popular BI tools, including Tableau, Qlik, Microstrategy, and many more. At Google Cloud, the addition of Looker to our portfolio has made it easier for business users to interact with dashboards, follow data-driven workflows, and generate more value for their organizations. Businesses can embed data at every stage of a given workflow or application, making data-driven insights the default for front line workers, whether that means Sunrun defining cross-organizational metrics or CCA providing better and actionable insights to caregivers treating patients threatened by COVID-19.
There’s a very tight relationship between the data and the expectation that something needs to be done with it
Dr. Valmeek Kudesia, CCA VP of Clinical Informatics & Advanced Analytics
In addition to improving self-service business intelligence, we’re helping business users generate insights by bringing new capabilities to a familiar tool—the spreadsheet. Connected Sheets can deliver the power and scale of BigQuery to the hundreds of millions of business users who are familiar with a simple spreadsheet. That means being able to analyze billions of rows and petabytes of data without having to know SQL to drive analysis and insights, bringing scale to data insights.
Beyond giving superpowers to spreadsheets, we’ve democratized insights for business users (and their customers) by driving the capabilities of BigQuery into the oldest query system there is—natural language. Data QnA makes it easy for non-technical business users to access the data insights they need by simply asking natural language questions of their data. This enables anyone to conversationally analyze petabytes of data stored in both BigQuery and federated data sources. Data QnA is among the most accessible self-service tools for data analysis and has the potential to drive new insights and data-driven decisions into every corner of the businesses that deploy it.
“At Veolia, we were taking weeks responding to ad hoc analytics requests from our business partners. This was reducing the time we could spend on higher value activities,” said Fabrice Nico, Data and Robotic Manager at Veolia. “We at the BI team have since enabled self-service access to BigQuery data by asking questions in natural language. The Google service, through Sheets and chatbots, is going to free up our time significantly, and enable our business partners to execute faster through natural language-based analytics.”
Finally, we know it’s hard to discuss data insights today without touching on both real-time analysis and machine learning. Increasingly, organizations need access to machine learning to help derive insights from the messy world of big data. If insights are the buried treasure of the data world, machine learning is the equivalent of a metal detector, particularly when the data volumes are large. Real-time data analysis is key to powering better customer experiences and better (often automated) decision making. At Google Cloud, we’ve given the democratization of these capabilities a lot of thought and investment, which you can read about in the upcoming parts of this blog series.
Learn more about smart analytics on Google Cloud.

