Logging in second-generation runtimes is different from the first-generation runtimes. One of the biggest changes when upgrading to newer runtimes is that the pre-integrated logging with App Engine is not supported in second-generation runtimes, and logs are not automatically correlated. If you are migrating to the second-generation runtimes, you must use the Cloud Logging client library.
This guide describes how you can update your app to use Cloud Logging and achieve nearly the same filtering and log correlation features that were available with the logging integration in App Engine.
Cloud Logging is a real-time log-management system with storage, search, analysis, and monitoring support. Cloud Logging automatically collects logs from Google Cloud resources. You can also collect logs from your applications, resources on-premises, and resources from other cloud providers.
Key differences
The following table covers differences in logging between first and second-generation runtimes:
| First-generation runtimes | Second-generation runtimes | |
|---|---|---|
| Request and app logs (also called application logs) |
App Engine embeds all app logs within the request log. Logging in the
first-generation runtimes use the protoPayload.line.logMessage
field of the request log to embed app logs. |
App Engine doesn't embed
app logs within the associated request log.
App Engine omits the protoPayload.line attribute in the request
log.
App logs are routed based on your method of logging:
|
| Viewing logs in the Logs Explorer |
First-generation runtimes only contain one log type,
appengine.googleapis.com/request_log. When you expand a request log, you can
see the app logs nested under it.
|
Second-generation runtimes include logs from multiple log types such as,
request logs in appengine.googleapis.com/request_log, stdout,
stderr, logs/python, and many more, depending on how
your app emits logs.
Google-internal logs are also available in /var/log/google_init.log.
Since app logs are not automatically correlated with request logs, additional steps are necessary to display the nested view of request and app logs in the Logs Explorer. For more information, see Correlate request logs with app logs and View correlated logs in the Logs Explorer. |
| Cloud Trace integration | Automatically integrated with Cloud Trace for latency data collection. | You must manually integrate your app with Cloud Trace to collect data for latency from App Engine. For more information, see Instrument for Cloud Trace. |
| Error level correlation | Records the error thrown in the App Engine request logs with an ERROR severity level. Error Reporting automatically correlates these details in the Error Reporting dashboard. | By default, App Engine does not integrate Error Reporting in the second-generation runtimes. To set up logging integration with Error Reporting, see, Instrument apps by using client libraries . |
| Severity level | Logs Explorer assigns a severity level to request logs, and the severity level reflects the highest severity of any app log entry that is correlated with the request log entry. For example, if a request results in your app emitting a warning log entry, the Logs Explorer will display a warning icon next to the request log entry. When you expand the request entry, you see the warning log entry nested within the request entry. | By default, all request logs have a severity of DEFAULT or INFO.
Even if your request logs are correlated with app logs, and the
Logs Explorer is configured to view correlated logs,
the request logs don't reflect the severity of the associated app logs.
|
| Logservice API | The Logservice API is a part of the bundled services SDK. | The Logservice API has been removed from the Bundled Services SDK. For more information, see the list of available APIs. |
Before you start migrating
Enable the Cloud Logging API in the project that contains your app.
Make sure your app has permission to write logs.
By default, your app's default service account has permission to write logs.
If your app uses a different service account, or if you have changed permissions for the default service account, make sure the account you use has the
logging.logEntries.createpermission to write logs.Familiarize yourself with the different types of logs in App Engine.
Overview of the migration process
To migrate your app to use Cloud Logging:
- Install the Cloud Client Libraries for Cloud Logging
- Write logs with Cloud Logging
- Correlate request logs with app logs
- View logs
- Test your app
Installing the Cloud Client Libraries for Cloud Logging
To install and update your configuration files, add the Cloud Client Libraries
for Cloud Logging to your list of dependencies in the requirements.txt
file, like the following:
google-cloud-logging
Write logs with the standard Python logging module
In each file that writes log entries:
- Import the Cloud Logging client library.
- Instantiate the Cloud Logging client.
- Run the Cloud Logging client's
setup_logging()method, which attaches its default listener as the logging handler for the Python root logger.
For example:
After the handler is attached, any logs at INFO level or higher
which are emitted in your application will be sent to Logging
by default:
Correlate request logs with app logs
Some features that are available in the first-generation runtimes such as, automatic correlation of request logs with app logs, are not available in the second-generation runtimes.
Apps using second-generation runtimes can achieve similar nested logging behavior to that of first-generation runtimes by either:
- Setting up the Cloud Logging client in your application and correlating logs.
- Using a
traceidentifier withstdoutandstderr.
The logging behavior in first-generation and second-generation runtimes differ in the following ways:
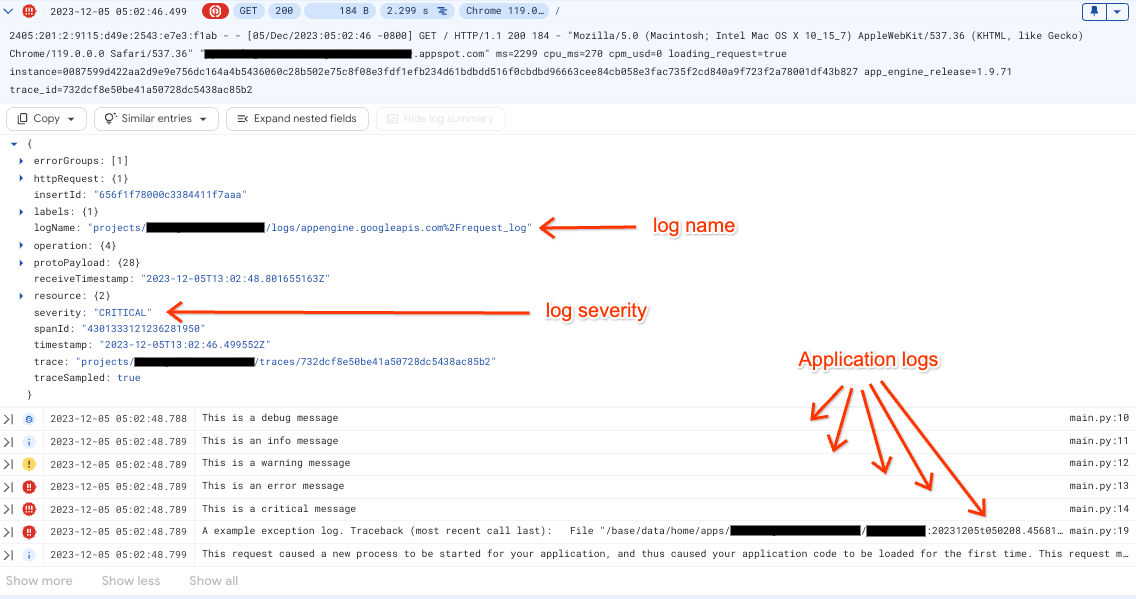
In first-generation runtimes, App Engine embeds all app logs emitted while handling a request into the
protoPayload.line.logMessagefield of the request log. These logs are visible in Logs Explorer throughappengine.googleapis.com/request_log.The following image shows correlated request and app logs in the first-generation runtimes:

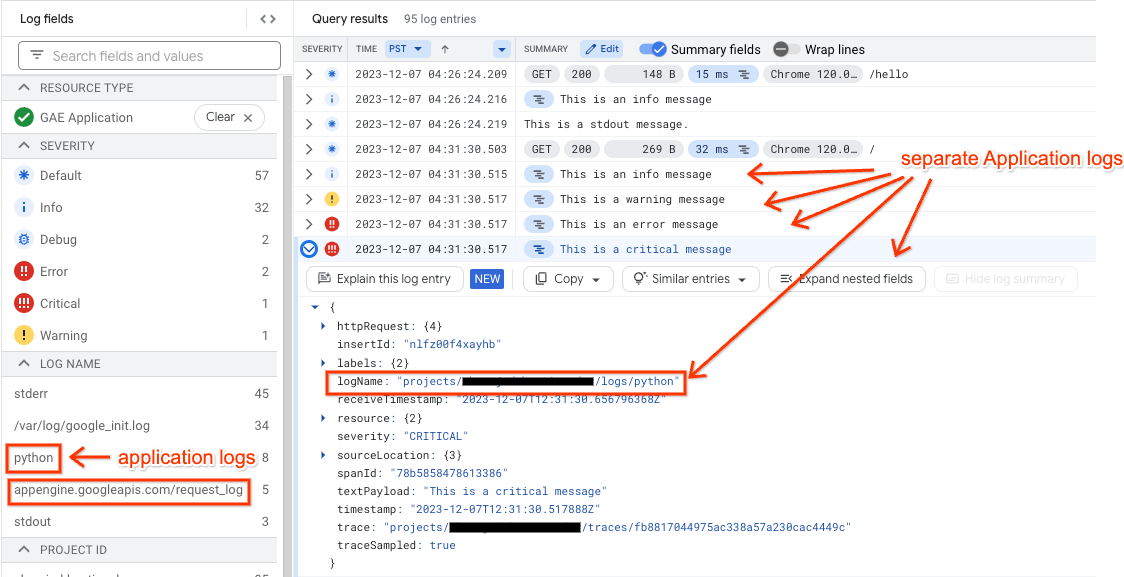
In second-generation runtimes, App Engine omits the
protoPayload.lineattribute in the request log. The contents of the app logs are not present within the JSON request logs in Logs Explorer. Each app log will appear separately by its log name in Logs Explorer.The following image shows separate request and app logs in the second-generation runtimes:

The following sections covers how to either use the Cloud Logging client or
structured logging with stdout and stderr for correlating logs.
Use the Python logging module
To add request-correlation to app logs logged by the Python logging module, set up the Cloud Logging client library.
When you run the client.setup_logging() method at application startup,
this method adds the trace field and the HTTP request details to app logs written
by the Python logging module such as, logging.info() and logging.error(). These
logs are routed to logs/python.
App Engine also adds this trace field to the associated request log,
which makes it possible to view correlated log entries in the Log Explorer.
Use stdout and stderr
If you use stdout and stderr to write log entries, these entries appear in
the Logs Explorer. However, to enable filtering and correlation with request logs,
you need to format the entries as a JSON object and provide specific metadata. For
more information about this approach, see Write structured logs to stdout and stderr.
This approach adds the request's trace identifier in application logs by:
- Extracting the trace identifier from the
X-Cloud-Trace-Contextrequest header. - Writing the ID to a field named
logging.googleapis.com/tracein your structured log entry. For more information about theX-Cloud-Trace-Contextheader, see Forcing a request to be traced.
View logs
You can view app logs and request logs in several ways:
- Use Logs Explorer from Cloud Logging in the Google Cloud console.
- Use the Google Cloud CLI to view logs using gcloud.
- Read logs programmatically using various methods.
Use Logs Explorer
You can view your app and request logs using the Logs Explorer:
Go to Logs Explorer in the Google Cloud console:
Select an existing Google Cloud project at the top of the page.
In Resource Type, select GAE Application.
You can filter the Logs Explorer by App Engine service, version and other criteria. You can also search the logs for specific entries. See Using the Logs Explorer for details.
If you send simple text entries to standard output, you cannot use the Logs Viewer to filter app entries by severity, nor can you see which app logs correspond to specific requests. You can still use other types of filtering in the Logs Explorer, such as text and timestamp.
View correlated log entries in the Logs Explorer
In the Logs Explorer, to view the child log entries correlated with a parent log entry, expand the log entry.
For example, to display your App Engine request log entry and application log entries, do the following:
In the navigation panel of the Google Cloud console, select Logging, and then select Logs Explorer:
In Resource Type, select GAE Application.
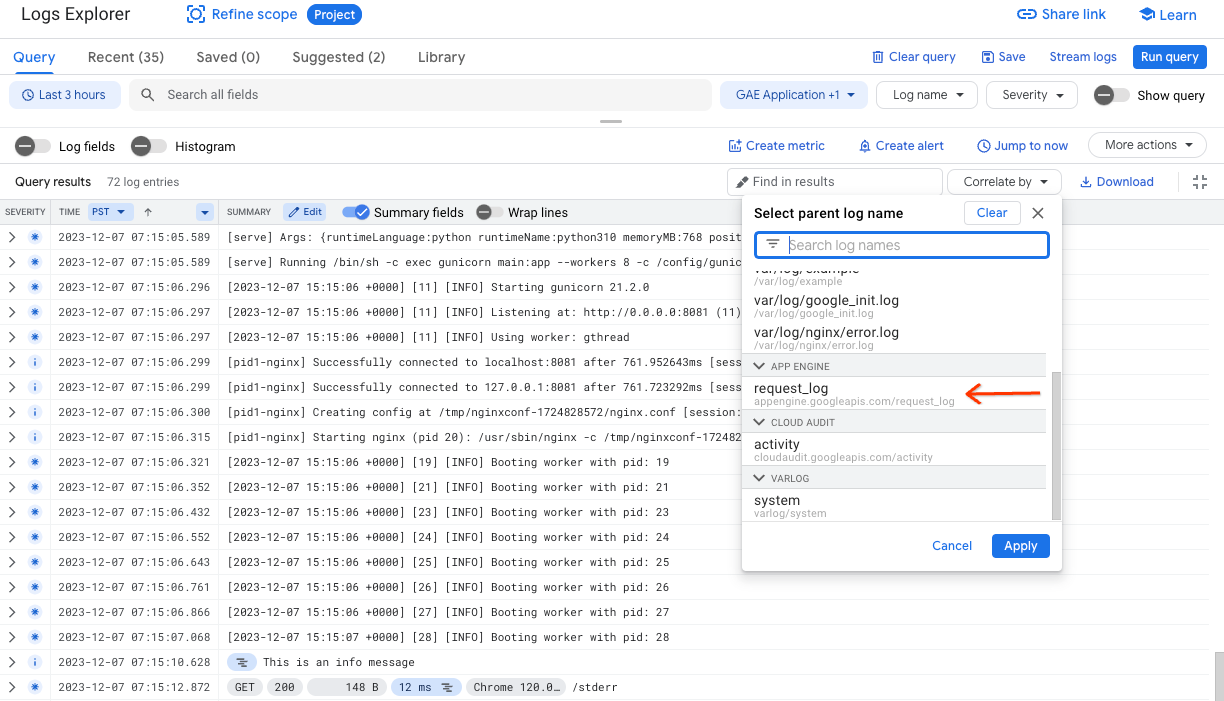
To view and correlate request logs, in Log Name, select request_log. Alternatively, to correlate by request logs, click Correlate by and select request_log.

In the Query results pane, to expand a log entry, click Expand. On expanding, each request log will show the associated app logs.
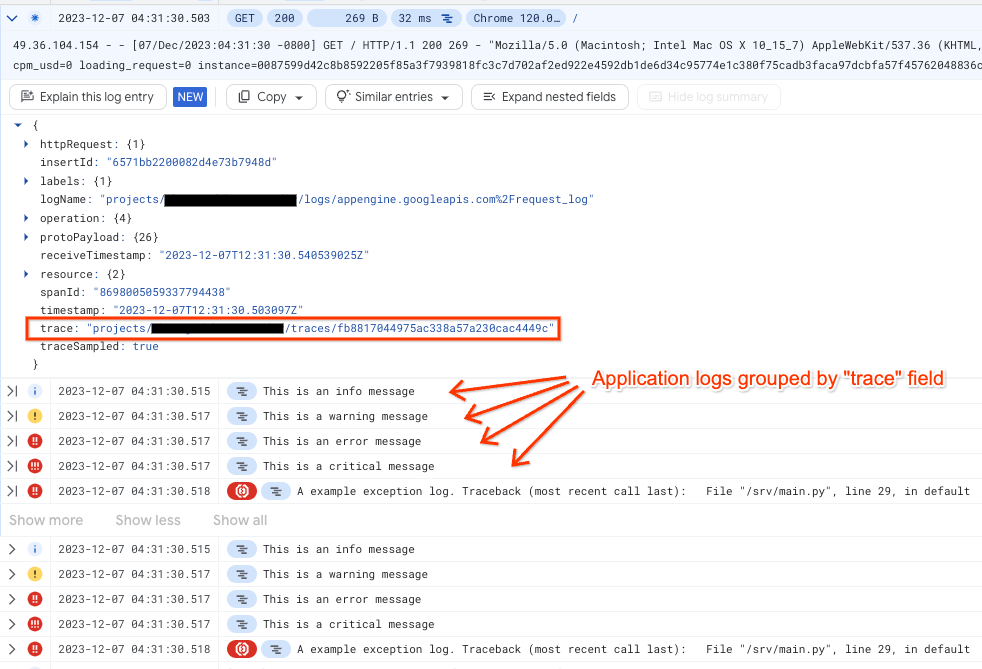
After creating a filter for the logs, each request log shows corresponding
app logs as child logs. Logs Explorer achieves this by correlating
the trace field in app logs and a given request log, assuming the application
uses the google-cloud-logging library.
The following image shows app logs grouped by the trace field:

Use the Google Cloud CLI
To view your App Engine logs from the command line, use the following command:
gcloud app logs tail
For more information, see gcloud app logs tail.
Reading logs programmatically
If you want to read the logs programmatically, you can use one of these methods:
- Use a log sink to Pub/Sub and a script to pull from Pub/Sub.
- Call the Cloud Logging API through the client library for your programming language.
- Call the Cloud Logging API REST endpoints directly.
Test your app
Migration is successful if you are able to deploy your app without errors. To verify that Cloud Logging is working, follow these steps:
Go to Logs Explorer and expand a request log entry.
Ensure that the app logs generated by your app when processing a request, are nested within the request log.
If all your app endpoints work as expected, use traffic splitting to slowly ramp up traffic for your updated app. Monitor the app closely for any issues before routing more traffic to the updated app.
