This document provides information about how to find log data and how to troubleshoot synthetic monitor and uptime check failures:
- Finding logs
- Troubleshoot notifications
- Troubleshoot public uptime checks
- Troubleshoot private uptime checks
- Troubleshoot synthetic monitors
Find logs
This section provides information about how to find logs for your synthetic monitors and uptime checks:
-
In the navigation panel of the Google Cloud console, select Logging, and then select Logs Explorer:
Do any of the following:
To find all logs associated with your synthetic monitors or uptime checks, query by resource type. You can use the Resource menu or you can enter a query.
For uptime checks, in the Resource menu, select Uptime Check URL, or enter the following query into the query editor and then click Run query:
resource.type="uptime_url"For synthetic monitors, in the Resource menu, select Cloud Run Revision, or enter the following query into the query editor and then click Run query:
resource.type="cloud_run_revision"The find logs that contain information about the response received during a synthetic monitor or uptime check execution, do any of the following:
To query by using the ID of the synthetic monitor or uptime check, use the following format when entering the ID into the query editor, and then click Run query
labels.check_id="my-check-id"To query for logs that contain response data for requests issued by synthetic monitors and uptime checks, enter the following query into the query editor and then click Run query
"UptimeCheckResult"The previous query matches all log entries that include the string
"UptimeCheckResult".
These logs include the following:
The ID of the synthetic monitor or uptime check, which is stored in the
labels.check_idfield.For synthetic monitors, the name of your Cloud Function, which is stored in the
resource.labels.service_namefield.When trace data is collected, the ID of an associated trace, which is stored in the
tracefield.
To verify that your service received requests from Google Cloud servers, copy the following query into the query editor and then click Run query:
"GoogleStackdriverMonitoring-UptimeChecks"The
protoPayload.ipfield contains one of the addresses used by the uptime-check servers. For information about how to list all IP addresses, see List IP addresses.
Troubleshoot notifications
This section describes some errors you might encounter when configuring alerting policies and provides information for resolving them.
You received a notification and want to debug the failure
To identify when the failure began, do one of the following:
For uptime checks, to determine when the failure occurred, view the Uptime details page:
-
In the navigation panel of the Google Cloud console, select Monitoring, and then select
 Uptime checks:
Find and select the uptime check.
The Passed checks chart displays the history of the checks. To identify when the uptime check first failed, you might need to modify the time range for the chart. The time-range selector is located in the toolbar of the Uptime details page.
-
For synthetic monitors, to determine when the failure occurred, view the Uptime details page:
-
In the navigation panel of the Google Cloud console, select Monitoring, and then select
Synthetic monitoring:
- Find and select the synthetic monitor.
-
For information about how to find associated log data, see the section of this page titled Finding logs.
You aren't notified that an uptime check failed
You configured an uptime check and are viewing the Uptime details page for that check. You notice that the Passed checks graph shows that at least one checker failed. However, you didn't receive a notification.
By default, the alerting policy is configured to create an incident and send a notification when checkers in at least two regions fail to receive a response to an uptime check. These failures must occur simultaneously.
You can edit the condition of the alerting policy so that you are notified when a single region fails to receive a response. However, we encourage you to use the default configuration, which reduces the number of notifications that you might receive due to transient failures.
To view or edit an alerting policy, do the following:
-
In the navigation panel of the Google Cloud console, select Monitoring, and then select notifications Alerting:
- Click See all policies in the Policies pane.
Find the policy that you want to view or edit, and then click the name of the policy.
You can view and edit the policy from the Policy details page.
Troubleshoot private uptime checks
This section describes some errors you might encounter when using public uptime checks and provides information for resolving them.
Your public uptime checks are failing
You configure a public uptime check, but you receive an error when you perform the verification step.
The following are some possible causes of an uptime check failure:
- Connection Error - Refused: If you are using the default HTTP connection type, check that you have a web server installed that is responding to HTTP requests. A connection error can happen on a new instance if you haven't installed a web server; see the Quickstart for Compute Engine. If you use an HTTPS connection type, you might have to perform additional configuration steps. For firewall issues, see List uptime-check server IP addresses.
- Name or service not found: The hostname might be incorrect.
- 403 Forbidden: The service is returning an error code to the uptime checker. For example, the default Apache web server configuration returns this code under Amazon Linux, but it returns code 200 (Success) under some other Linux versions. See the LAMP tutorial for Amazon Linux or your web server's documentation.
- 404 Not found: The path might be incorrect.
- 408 Request timeout, or no response: The port number might be incorrect, the service might not be running, the service might be inaccessible, or the timeout might be too low. Check that your firewall allows traffic from the uptime servers; see List uptime-check server IP addresses. The timeout limit is specified as part of the Response Validation options.
To help you troubleshoot failed public uptime checks, you can configure your uptime checks to send up to 3 ICMP pings during the check. The pings can help you distinguish between failures caused, for example, by network connectivity problems and by timeouts in your application. For more information, see Use ICMP pings.
Troubleshoot private uptime checks
This section describes some errors you might encounter when using private uptime checks and provides information for resolving them.
Create of uptime check fails
Your Google Cloud project settings might prevent modification of the roles assigned to the service account that uptime checks use to manage interactions with the Service Directory service. In this situation, the creation of the uptime check fails.
This section describes how you can grant the roles that the service account requires:
Google Cloud console
When you use the Google Cloud console to create the private uptime check, the Google Cloud console issues the commands to grant the Service Directory roles to the service account.
For information about how to grant roles to a service account, see Authorize the service account.
API: Scoping project
The first time you create a private uptime check for a Service Directory service and private resources in a single Google Cloud project, the request might succeed or fail. The result depends on whether you have disabled automatic role grants for service accounts in your project:
The first uptime-check creation succeeds if your project permits automatic role grants for service accounts. A service account is created for you and is granted the necessary roles.
The first uptime-check creation fails if your project doesn't permit automatic role grants for service accounts. A service account is created, but no roles are granted.
If the creation of the uptime check fails, then do the following:
- Authorize the service account.
- Wait a few minutes for the permissions to propagate.
- Try creating the private uptime check again.
API: Monitored project
The first time you create a private uptime check that targets a Service Directory service in a monitored project or private resources in different Google Cloud project, the request fails and results in the creation of a Monitoring service account.
How you authorize the service account depends on the number of Google Cloud projects you are using and their relationships. You might have up to four projects involved:
- The project in which you defined the private uptime check.
- The monitored project in which you configured the Service Directory service.
- The project in which you configured the VPC network.
- The project in which network resources like VMs or load balancers are configured. This project has no role in the service-account authorization discussed here.
When the creation of the first uptime check fails, do the following:
- Authorize the service account.
- Wait a few minutes for the permissions to propagate.
- Try creating the private uptime check again.
Access denied
Your uptime checks are failing with VPC_ACCESS_DENIED results. This result
means that some aspect of your network configuration or service-account
authorization isn't correct.
Check your service-account authorization for using a scoping project or a monitored project as described in Create of uptime check fails.
For more information about accessing private networks, see Configure the network project.
Anomalous results from private uptime checks
You have a Service Directory service with multiple VMs, and your service configuration contains multiple endpoints. When you shut down one of the VMs, your uptime check still indicates success.
When your service configuration contains multiple endpoints, one is chosen at random. If the VM associated with the chosen endpoint is running, the uptime check succeeds even though one of the VMs is down.
Default headers
Your uptime checks are returning errors or unexpected results. This might occur if you have overridden default header values.
When a request is sent for a private uptime check to a target endpoint, the request includes the following headers and values:
| Header | Value |
|---|---|
HTTP_USER_AGENT |
GoogleStackdriverMonitoring-UptimeChecks(https://cloud.google.com/monitoring) |
HTTP_CONNECTION |
keep-alive |
HTTP_HOST |
IP of Service Directory endpoint |
HTTP_ACCEPT_ENCODING |
gzip, deflate, br |
CONTENT_LENGTH |
Calculated from uptime post data |
If you attempt to override these values, the following might happen:
- The uptime check reports errors
- The override values are dropped and replace with the values in the table
No data visible
You don't see any data on the uptime check dashboard when your uptime check is in a different Google Cloud project than the Service Directory service.
Ensure that the Google Cloud project that contains the uptime check monitors the Google Cloud project that contains the Service Directory service.
For more information about how to list monitored projects and add additional ones, see Configure a metrics scope for multiple projects.
Troubleshoot synthetic monitors
This section provides information that you can use to help you troubleshoot your synthetic monitors.
Error message after enabling the APIs
You open the create flow for a synthetic monitor and are prompted to enable at least one API. After you enable the APIs, a message similar to the following is displayed:
An error occurred during fetching available regions: Cloud Functions API has
not been used in project PROJECT_ID before or it is disabled.
The error message recommends that you verify that the API is enabled and then advises that you wait and retry the action.
To verify that the API is enabled, go to the APIs & Services page for your project:
After you've verified that the API is enabled, you can continue with the create flow. The condition resolves automatically after the API enablement propagates through the backend.
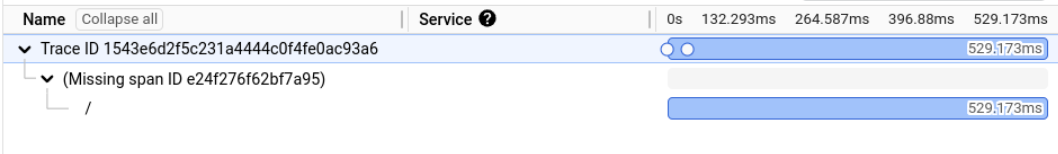
Outbound HTTP requests aren't being traced
You configure your synthetic monitor to collect trace data for output HTTP requests. Your trace data only shows one span, similar to the following screenshot:
To resolve this situation, ensure that your service account
has been granted the role of Cloud Trace Agent (roles/cloudtrace.agent).
A role of Editor (roles/editor) is also sufficient.
To view the roles granted to your service account, do the following:
-
In the navigation panel of the Google Cloud console, select IAM:
- Select Include Google-provided role grants.
If the service account used by your synthetic monitor isn't listed, or if it hasn't been granted a role that includes the permissions in the role of Cloud Trace Agent (
roles/cloudtrace.agent), then grant this role to your service account.If you don't know the name of your service account, then in the navigation menu, select Service Accounts.
In progress status
The Synthetic monitors page lists a synthetic monitor
with a status of In progress. A status of In progress means that
the synthetic monitor was recently created and there isn't any data to display,
or that the function failed to deploy.
To determine if the function failed to deploy, try the following:
Ensure that the name of your Cloud Function doesn't contain an underscore. If an underscore is present, remove the underscore and redeploy the Cloud Function.
Open the Synthetic monitor details page for the synthetic monitor.
If you see the following message, then delete the synthetic monitor.
Cloud Function not found for this Synthetic monitor. Please confirm it exists or delete this monitor.
The error message indicates that the function was deleted and therefore the synthetic monitor is unable to execute the function.
Open the Cloud Functions page for the function. To open this page from the Synthetic monitor details page, click Code, and then click the function name.
If you see a message similar to the following, then the function failed to deploy.
This function has failed to deploy and will not work correctly. Please edit and redeploy
To resolve this failure, review the function code and correct the errors that are preventing the function from building or deploying.
When you create a synthetic monitor, it might take several minutes for the function to be deployed and executed.
Warning status
The Synthetic monitors lists a synthetic monitor
with a status of Warning. A status of Warning means that the execution
results are inconsistent. This might indicate a design issue with your
test, or it might indicate that what is being tested has inconsistent behavior.
Failing status
The Synthetic monitors lists a synthetic monitor with a status of
Failing. To get more information about the failure reason,
view the most recent execution history.
If the error message
Request failed with status code 429is shown, then the target of the HTTP request rejected the command. To resolve this failure, you must change the target of your synthetic monitor.The endpoint
https://www.google.comrejects requests made by synthetic monitors.If the failure is returning an execution time of
0ms, then the Cloud Function might be running out of memory. To resolve this failure, edit your Cloud Function, and then increase the memory to at least 2 GiB and set the CPU field to1.
Delete fails for a synthetic monitor
You use the Cloud Monitoring API to delete a synthetic monitor, but the API call fails with a response similar to the following:
{
  "error": {
    "code": 400,
    "message": "Request contains an invalid argument.",
    "status": "INVALID_ARGUMENT",
    "details": [
      {
        "@type": "type.googleapis.com/google.rpc.DebugInfo",
        "detail": "[ORIGINAL ERROR] generic::invalid_argument: Cannot delete check 1228258045726183344. One or more alerting policies is using it.Delete the alerting policy with id projects/myproject/alertPolicies/16594654141392976482 and any other policies using this uptime check and try again."
      }
    ]
  }
}
To resolve the failure, delete alerting policies that monitor the results of the synthetic monitor, and then delete the synthetic monitor.
Unable to edit the configuration of a broken-link checker
You created a broken-link checker by using the Google Cloud console, and you want to change the HTML elements that are tested, or you want to modify the URI timeout, retries, wait for selector, and per-link options. However, when you edit the broken-link checker, the Google Cloud console doesn't display the configuration fields.
To resolve this failure, do the following:
-
In the navigation panel of the Google Cloud console, select Monitoring, and then select
Synthetic monitoring:
- Locate the synthetic monitor that you want to edit, click more_vert More options, and then select Edit.
- Click Edit function.
Edit the
optionsobject in theindex.jsfile, and then click Apply function.For information about the fields and syntax for this object, see
broken-links-ok/index.js.Click Save.
Google Cloud console displays that saves of screenshots fail
You created a broken-link checker and configured it to save screenshots. However, the Google Cloud console is displaying one of the following warning messages along with more detailed information:
InvalidStorageLocationStorageValidationErrorBucketCreationErrorScreenshotFileUploadError
To resolve these failures, try the following:
If you see the
InvalidStorageLocationmessage, then verify the existence of the Cloud Storage bucket specified in the field namedoptions.screenshot_options.storage_location.View the logs related to your Cloud Function. For more information, see Finding logs.
Verify that the service account being used in the corresponding Cloud Function has an Identity and Access Management role that lets it create, access, and write to Cloud Storage buckets.