簡介
針對數十億個時間序列進行預測和異常偵測需要大量運算資源。大多數現有系統會以批次工作形式執行預測和異常偵測 (例如風險管道、流量預測、需求規劃等)。這會嚴重限制您在線上執行的分析類型,例如決定是否根據一組事件維度的突然增加或減少來發出警報。
Timeseries Insights API 的主要目標如下:
- 根據查詢參數,從原始事件及其屬性動態建構數十億個時間序列。
- 提供即時預測和異常偵測結果。也就是說,在幾秒內偵測所有時間序列的趨勢和季節性,並判斷是否有任何切片出現意外的尖峰或下降。
API 功能
- 管理資料集
- 建立索引並載入由多個儲存在 Cloud Storage 的資料來源組成的資料集。允許以串流方式附加新事件。
- 卸載不再需要的資料集。
- 要求取得資料集的處理狀態。
- 查詢資料集
- 擷取符合指定屬性值的時間序列。時間序列會預測至指定時間範圍。系統也會評估時間序列的異常現象。
- 自動偵測屬性值組合是否有異常。
- 更新資料集
- 擷取最近發生的新事件,並以近乎即時的方式 (延遲時間為幾秒到幾分鐘) 將這些事件納入索引。
災難復原
Timeseries Insights API 並非 Cloud Storage 的備份,也不會傳回原始串流更新。客戶必須負責個別儲存及備份資料。
區域服務中斷後,系統會盡力復原。在停機開始後的 24 小時內更新的結構描述 (資料集和運作狀態相關資訊) 和串流使用者資料,可能無法復原。
在復原期間,您可能無法對資料集執行查詢及串流更新。
輸入資料
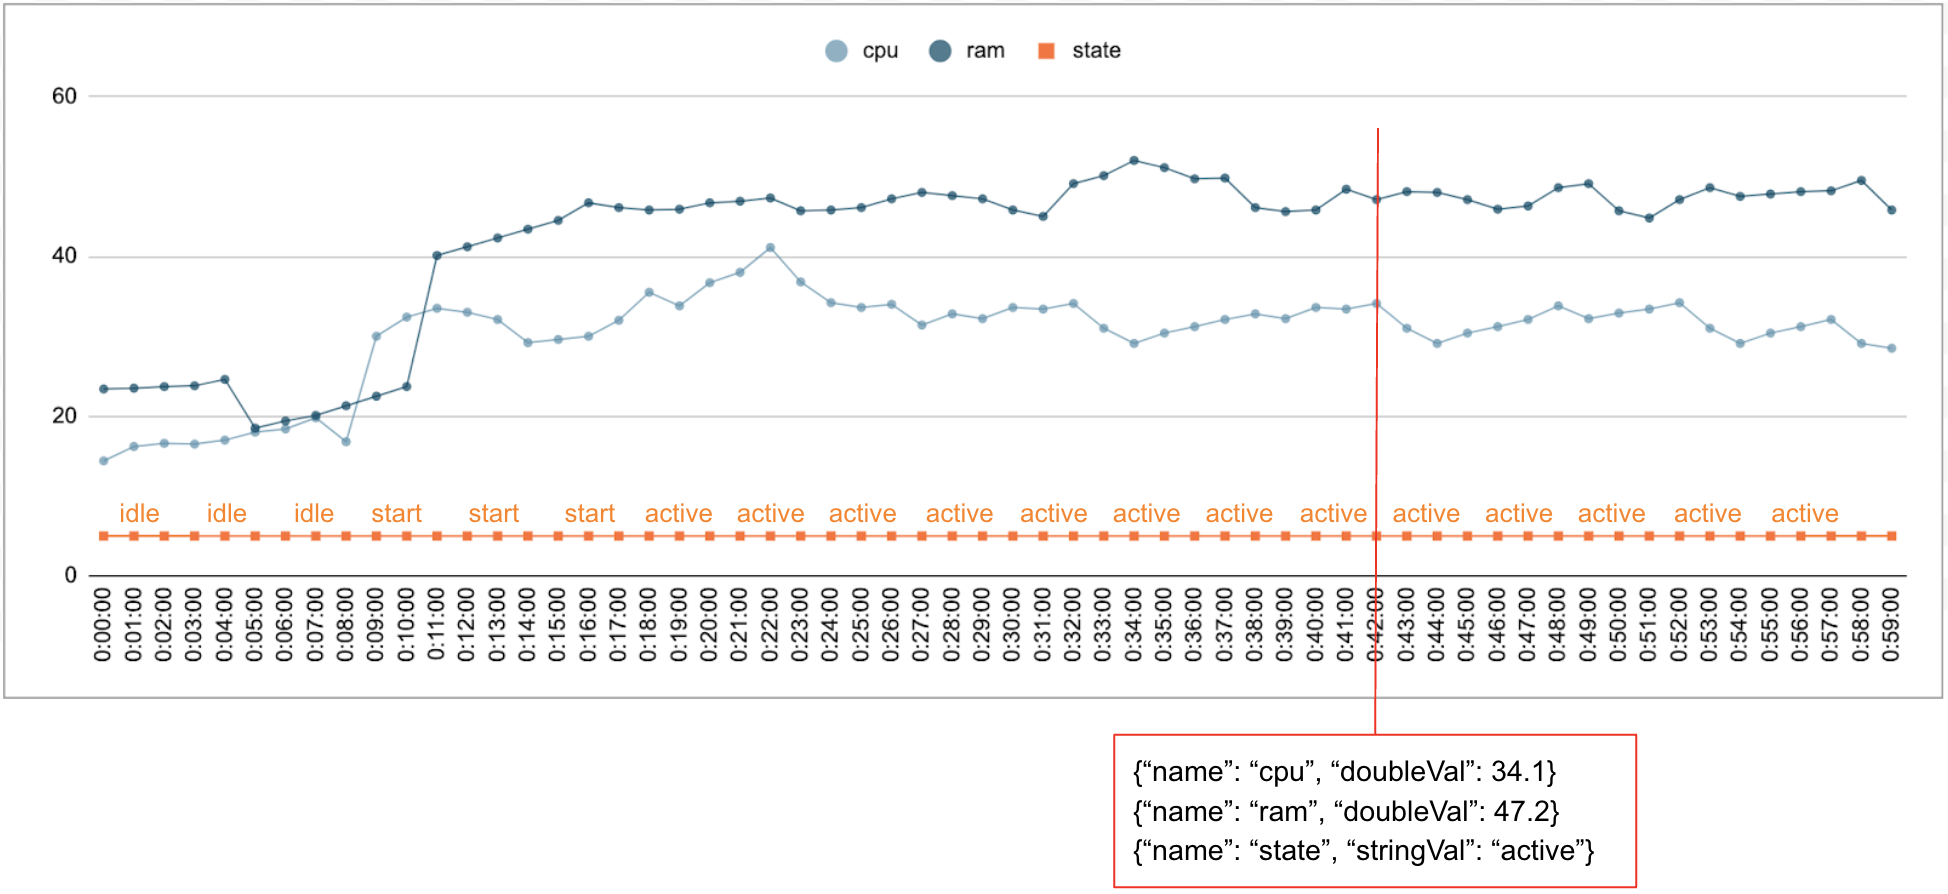
數值和分類資料通常會隨時間收集。舉例來說,下圖顯示資料中心中單一執行中工作在一段時間內每分鐘的 CPU 使用率、記憶體使用率和狀態。CPU 使用率和記憶體用量是數值,而狀態則是分類值。
活動
Timeseries Insights API 會使用事件做為基本資料輸入項目。每個事件都會附上時間戳記和一組維度,也就是鍵/值組合,其中鍵是維度名稱。這個簡單的表示法可讓我們處理數十億規模的資料。舉例來說,系統會納入資料中心、使用者、工作名稱和工作編號,以便完整呈現單一事件。上圖顯示為單一工作記錄的一系列事件,說明維度子集。
{"name":"user","stringVal":"user_64194"},
{"name":"job","stringVal":"job_45835"},
{"name":"data_center","stringVal":"data_center_30389"},
{"name":"task_num","longVal":19},
{"name":"cpu","doubleVal":3840787.5207877564},
{"name":"ram","doubleVal":1067.01},
{"name":"state","stringVal":"idle"}
DataSet
DataSet 是事件集合。查詢會在同一個資料集內執行。每個專案可以有多個資料集。
資料集是使用批次和串流資料建立而成。批次資料建構作業會從多個 Cloud Storage URI 讀取資料做為資料來源。批次建構作業完成後,資料集就能使用串流資料進行更新。系統可使用批次建構歷來資料,避免發生冷啟動問題。
資料集必須先建立或建立索引,才能進行查詢或更新。資料集建立完成後,系統就會開始建立索引,這項作業通常需要幾分鐘到幾小時才能完成,具體時間視資料量而定。具體來說,系統會在初始索引期間掃描一次資料來源。如果初始索引建立完成後,Cloud Storage URI 的內容有所變更,系統就不會再次掃描這些 URI。使用串流更新來取得其他資料。串流更新會以近乎即時的方式持續建立索引。
時間序列和異常偵測
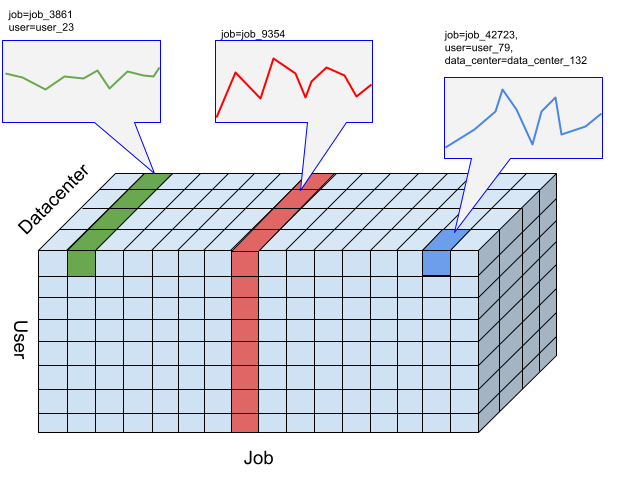
在 TimeSeries Insights API 中,切片是指包含特定維度值組合的事件集合。我們想評估這些切片中,隨著時間推移而發生的事件。
針對特定切片,系統會根據使用者指定的時間間隔解析度,將事件匯總為數值,這些時間序列可用於偵測異常狀況。上圖顯示「user」、「job」和「data_center」維度的不同組合,產生不同的切片選項。
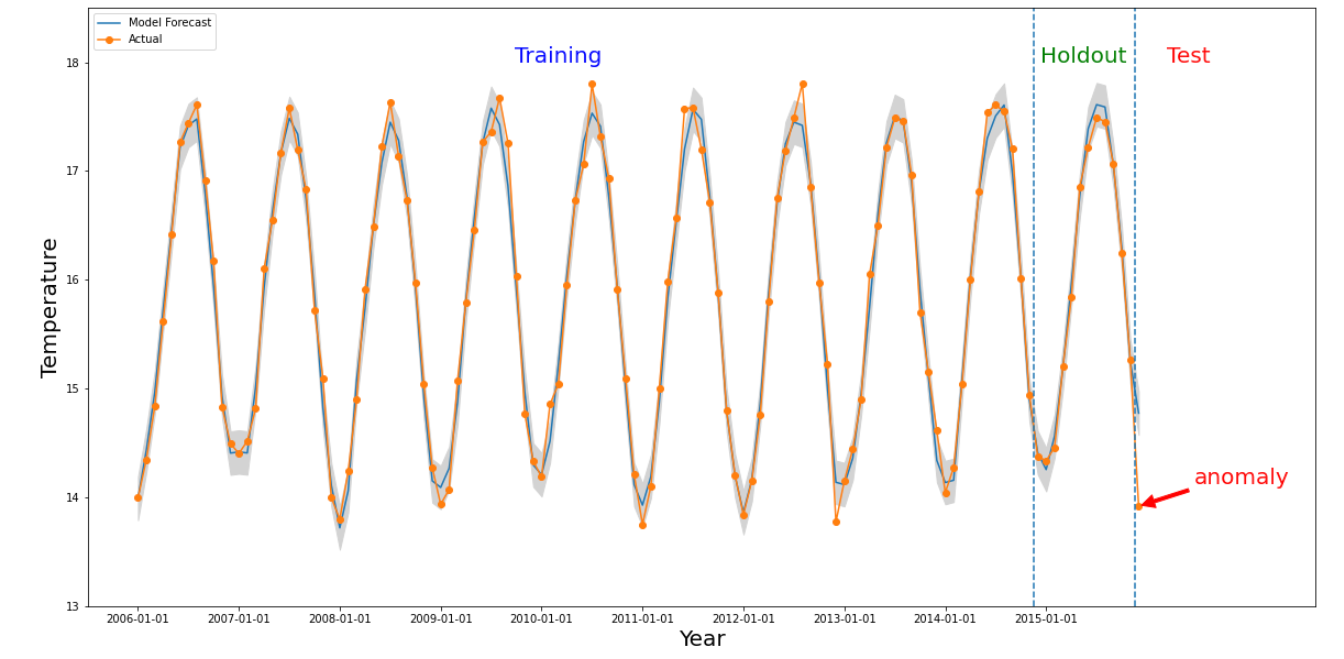
如果指定時間區間的數值與過去的值有顯著差異,就會發生異常。上圖顯示了根據全球 10 年來的溫度測量結果繪製的時間序列。假設我們想知道 2015 年最後一個月的資料是否異常。系統查詢會指定所需時間 detectionTime,為「2015/12/01」,granularity 為「1 個月」。在 detectionTime 之前擷取的時間序列會分割為較早的訓練期,接著是保留期。系統會使用訓練期間的資料訓練模型,並使用保留期間驗證模型是否能可靠地預測下一個值。在本例中,保留期間為 1 年。這張圖片顯示實際資料和模型的預測值,以及上限和下限。2015/12 的溫度標示為異常,因為實際值超出預測範圍。