Cloud Trace and Cloud Service Mesh
Cloud Trace is a distributed tracing system that collects latency data from the applications and displays it in near real-time. It allows you to follow a sample request through your distributed system, observe the network calls and profile your system end to end.
Cloud Trace is available with Cloud Service Mesh installations on the following platforms:
- GKE on Google Cloud
- GKE Enterprise clusters on-premises if you installed with Cloud Service Mesh certificate authority
Note that Cloud Trace is disabled by default. Once enabled, Cloud Service Mesh pages in the Google Cloud console provide a link to the traces in the Cloud Trace page . For detailed pricing information, refer to the Cloud Trace pricing page.
Enable Cloud Trace
This section shows you how to enable Cloud Trace.
Managed
This section shows you how to enable Cloud Trace on managed Cloud Service Mesh.
Run the following command:
cat <<EOF | kubectl apply -f -
apiVersion: v1
data:
   mesh: |-
      defaultConfig:
        tracing:
          stackdriver: {}
kind: ConfigMap
metadata:
   name: istio-release-channel
   namespace: istio-system
EOF
where release-channel is your release channel (
asm-managed,asm-managed-stable, orasm-managed-rapid).Run the following command to view the configmap:
kubectl get configmap istio-release-channel -n istio-system -o yaml
To verify that Cloud Trace is enabled, ensure sure the following lines appears in the
mesh:section.... apiVersion: v1 data: mesh: | .... defaultConfig: tracing: stackdriver:{} ...Restart the proxies.
Note that tracer configuration is part of the proxy bootstrap configuration, so each pod needs to restart and get re-injected to pick up the tracer update. For example, you can use the following command to restart pods that belong to a deployment:
kubectl rollout restart deployment -n NAMESPACE DEPLOYMENT_NAME
In-cluster
This section shows you how to enable Cloud Trace on in-cluster Cloud Service Mesh.
To enable Cloud Trace, redeploy the customer-managed control plane using the following overlay file. For more information about overlay files, see About the overlay files.
Default
Run the following command to enable Cloud Trace:
 ./asmcli install \
    OTHER_FLAGS \
    --option cloud-trace
This command applies the following overlay file to enable tracing with
default options. Note that the default sampling rate is 1%. If you want to
override the default, you must instead use --custom-overlay.
 apiVersion: install.istio.io/v1alpha1
 kind: IstioOperator
 spec:
   meshConfig:
     enableTracing: true
   values:
     global:
       proxy:
         tracer: stackdriver
For a list of options see the
anthos-service-mesh package.
Custom
You can override the default by specifying a tracing.sampling value. The
value must be in the range of 0.0 to 100.0 with a precision of 0.01. For
example, to trace 5 requests out of every 10,000, use 0.05.
The following example shows a sampling rate of 100% (which you would only do for demo or troubleshooting purposes).
 apiVersion: install.istio.io/v1alpha1
 kind: IstioOperator
 spec:
   meshConfig:
     enableTracing: true
     defaultConfig:
        tracing:
        sampling: 100
   values:
     global:
       proxy:
         tracer: stackdriver
Run the following command to enable Cloud Trace:
 ./asmcli install \
    OTHER_FLAGS \
    --custom_overlay PATH_TO_FILE
Note that the tracer configuration is part of proxy bootstrap configuration, so pods need to restart and get re-injected to pick up the tracer update. Use the following command to restart pods that belong to a deployment:
kubectl rollout restart deployment -n NAMESPACE DEPLOYMENT_NAME
Trace context propagation
Although the sidecar proxies can automatically send trace spans, they need some hints to tie together the entire trace. Applications need to propagate the appropriate HTTP headers so that when the proxies send span information, the spans can be correlated correctly into a single trace.
To do this, an application needs to collect and propagate the appropriate headers from the incoming request to any outgoing requests. The Cloud Service Mesh Stackdriver tracing configuration will accept any of the following header formats, and will propagate all of the following formats:
- B3 (
x-b3-traceid,x-b3-spanid,x-b3parentspanid,x-b3-sampled,x-b3-flags) - W3C TraceContext (
traceparent) - Google Cloud Trace (
x-cloud-trace-context) - gRPC TraceBin (
grpc-trace-bin)
This means that your applications can use any of those formats to propagate tracing context and the traces will be generated and set to Stackdriver appropriately.
Example
Here is an example HTTP-Get request with a traceparent header in the original
request. Notice the additional trace context headers added by the proxy.
$ kubectl exec -it sleep-557747455f-n6flv -- curl "httpbin:8000/anything?freeform=" -H "accept: application/json" -H "Traceparent: 00-7543d15e09e5d61801d4f74cde1269b8-604ef051d35c5b3f-01" -vv
*   Trying 10.12.3.52:8000...
* Connected to httpbin (10.12.3.52) port 8000 (#0)
> GET /anything?freeform= HTTP/1.1
> Host: httpbin:8000
> User-Agent: curl/7.80.0-DEV
> accept: application/json
> Traceparent: 00-7543d15e09e5d61801d4f74cde1269b8-604ef051d35c5b3f-01
>
* Mark bundle as not supporting multiuse
< HTTP/1.1 200 OK
< server: envoy
< date: Wed, 10 Nov 2021 20:36:04 GMT
< content-type: application/json
< content-length: 1032
< access-control-allow-origin: *
< access-control-allow-credentials: true
< x-envoy-upstream-service-time: 5
<
{
  "args": {
    "freeform": ""
  },
  "data": "",
  "files": {},
  "form": {},
  "headers": {
    "Accept": "application/json",
    "Grpc-Trace-Bin": "AAB1Q9FeCeXWGAHU90zeEmm4AaDHmGRtdM7wAgE",
    "Host": "httpbin:8000",
    "Traceparent": "00-7543d15e09e5d61801d4f74cde1269b8-a0c798646d74cef0-01",
    "User-Agent": "curl/7.80.0-DEV",
    "X-B3-Sampled": "1",
    "X-B3-Spanid": "a0c798646d74cef0",
    "X-B3-Traceid": "7543d15e09e5d61801d4f74cde1269b8",
    "X-Cloud-Trace-Context": "7543d15e09e5d61801d4f74cde1269b8/11585396123534413552;o=1",
    "X-Envoy-Attempt-Count": "1",
    "X-Forwarded-Client-Cert": "<REDACTED>"
  },
  "json": null,
  "method": "GET",
  "origin": "127.0.0.6",
  "url": "http://httpbin:8000/anything?freeform="
}
Notice that in the returned set of request headers, the full set of trace context headers is present.
For more examples propagating the headers, see Trace context propagation.
Create a trace from client with custom ID
To create a trace from a client with a custom ID, use the curl command to
create a request with an external client and force it to show a trace. For example:
curl $URL --header "x-client-trace-id: 105445aa7843bc8bf206b12000100000"
For more information about x-client-trace-id, refer to the
Envoy documentation.
Access traces
View trace samples for a service
To view a sampling of traces for a service in your app, follow these steps:
Go to the Cloud Service Mesh page in the Google Cloud console.
Under Services, select the name of the Service you want to inspect.
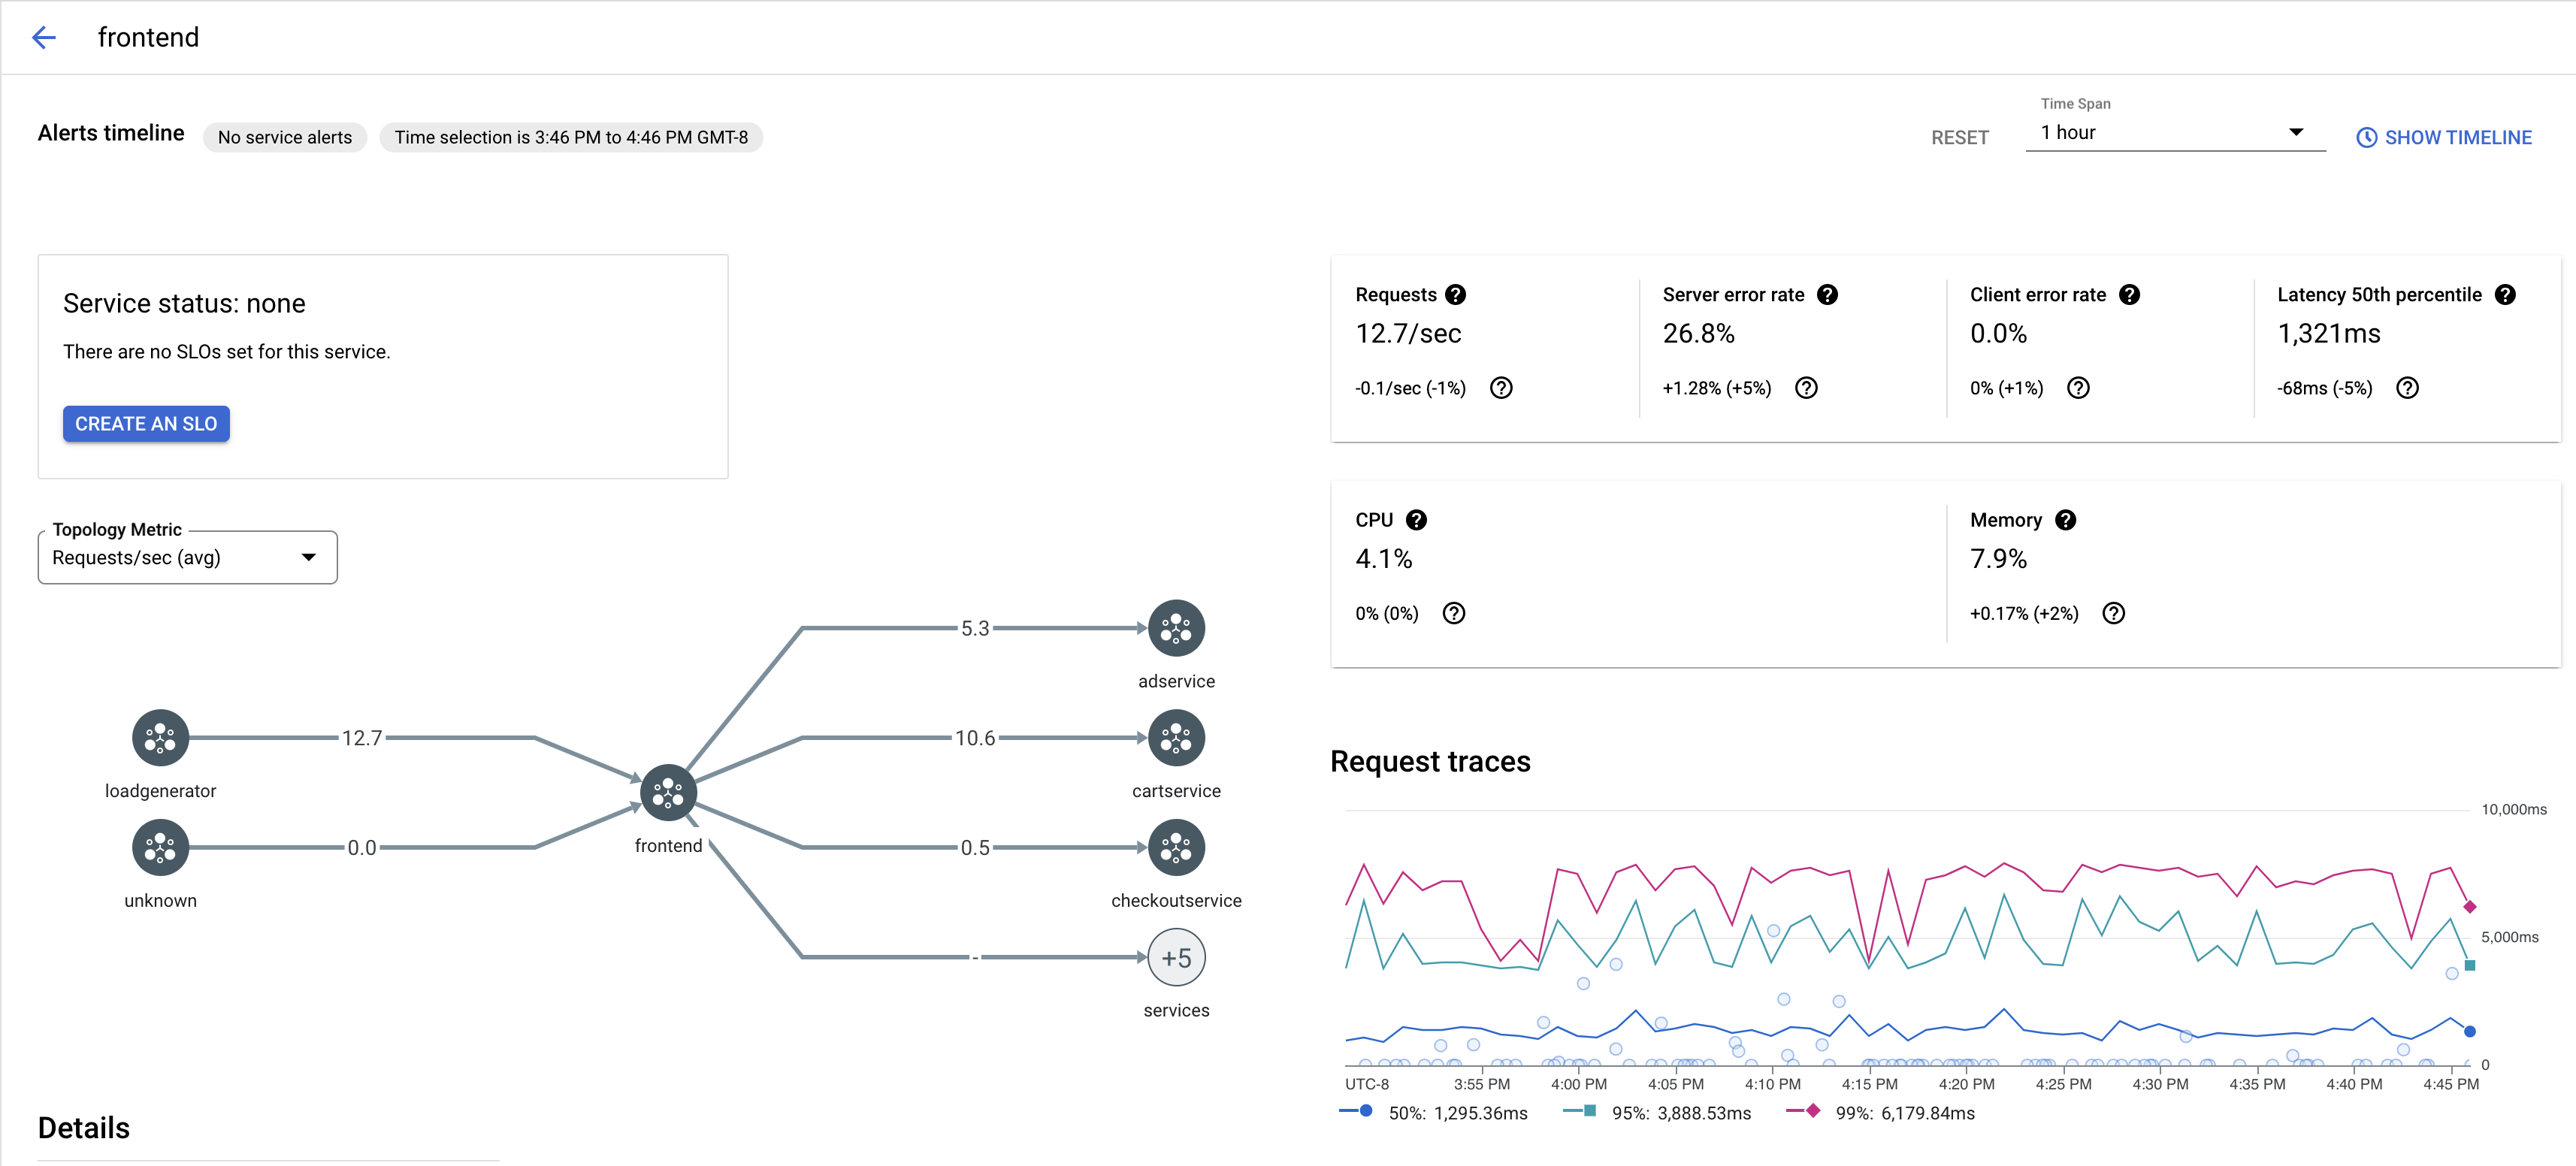
The following screenshot shows an example of a
frontendService.
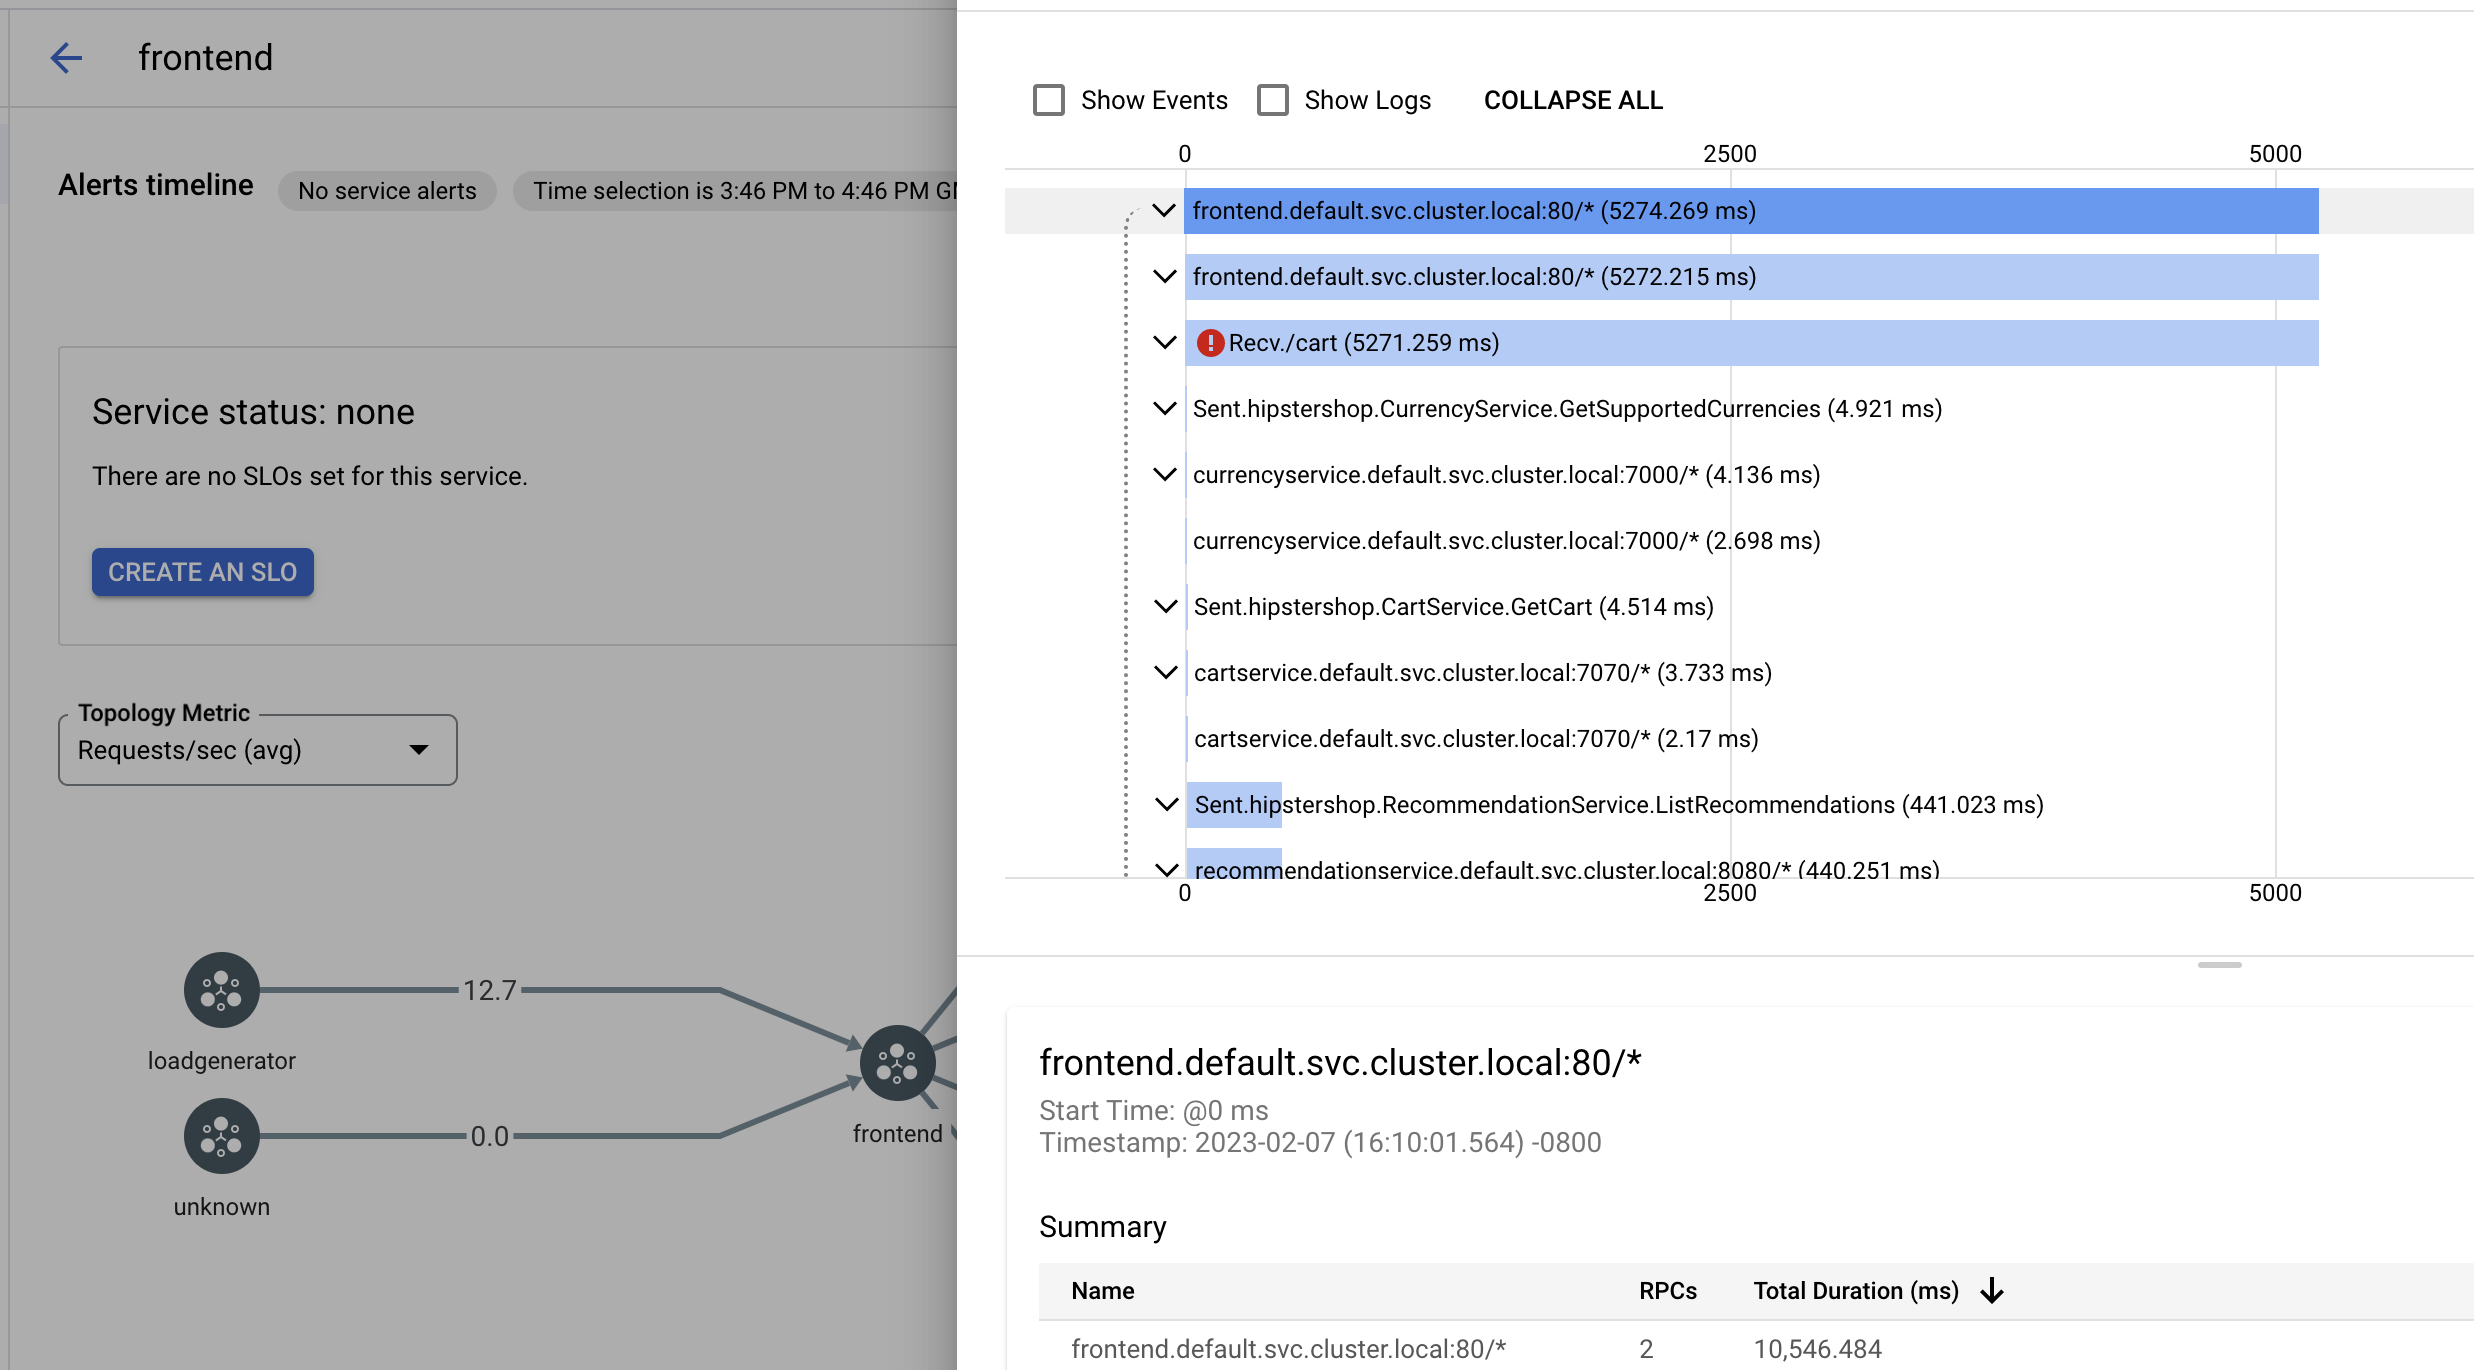
Under Request traces, click any trace to see more information.
The following screenshot shows an example of the trace request subpanel.

View all traces
To view all traces for a Service, follow these steps:
Go to the Cloud Service Mesh page in the Google Cloud console.
Under Services, select the name of the Service you want to inspect.
Go to the Metrics page.
Specify a time span from the Time Span dropdown menu or set a custom span with the timeline.
Click View traces.
The traces for a service in Cloud Service Mesh contain following information:
- Request latencies across different services in the mesh.
- HTTP request properties, including ID, URL, size, latency, and protocol.
- Service name, namespace and mesh id as part of the labels
istio.canonical_service,istio.namespace, andistio.mesh_id, respectively.
