Sensitive Data Protection helps you find, understand, and manage the sensitive data that exists within your infrastructure. Once you've scanned your content for sensitive data using Sensitive Data Protection, you have several options for what to do with that data intelligence. This topic shows you how to leverage the power of other Google Cloud features such as BigQuery, Cloud SQL, and Looker Studio to:
- Store Sensitive Data Protection scan results directly in BigQuery.
- Generate reports on where sensitive data resides in your infrastructure.
- Run rich SQL analytics to understand where sensitive data is stored and what kind it is.
- Automate alerts, or actions to trigger based on a single set or a combination of findings.
This topic also contains a complete example of how to use Sensitive Data Protection along with other Google Cloud features to accomplish all of these things.
Scan a storage bucket
First, run a scan on your data. Following is basic information about how to scan storage repositories using Sensitive Data Protection. For full instructions on scanning storage repositories, including the use of client libraries, see Inspecting Storage and Databases for Sensitive Data.
To run a scan operation on a Google Cloud storage repository, assemble a JSON object that includes the following configuration objects:
InspectJobConfig: Configures the Sensitive Data Protection scan job, and consists of:StorageConfig: The storage repository to scan.InspectConfig: How and what to scan for. You can also use an inspection template to define the inspection configuration.Action: Task(s) to execute on the completion of the job. This can include saving findings to a BigQuery table or publishing a notification to Pub/Sub.
In this example, you're scanning a Cloud Storage bucket for person names,
phone numbers, US Social Security numbers, and email addresses. Then you send
the findings to a BigQuery table dedicated to storing
Sensitive Data Protection output. The following JSON can be saved to a file or
sent directly to the
create
method of the
DlpJob
Sensitive Data Protection resource.
JSON Input:
POST https://dlp.googleapis.com/v2/projects/[PROJECT_ID]/dlpJobs

{
  "inspectJob":{
    "inspectConfig":{
      "infoTypes":[
        {
          "name":"PERSON_NAME"
        },
        {
          "name":"PHONE_NUMBER"
        },
        {
          "name":"US_SOCIAL_SECURITY_NUMBER"
        },
        {
          "name":"EMAIL_ADDRESS"
        }
      ],
      "includeQuote":true
    },
    "storageConfig":{
      "cloudStorageOptions":{
        "fileSet":{
          "url":"gs://[BUCKET_NAME]/**"
        }
      }
    },
    "actions":[
      {
        "saveFindings":{
          "outputConfig":{
            "table":{
              "projectId":"[PROJECT_ID]",
              "datasetId":"[DATASET_ID]",
              "tableId":"[TABLE_ID]"
            }
          }
        }
      }
    ]
  }
}
By specifying two asterisks (**) after the Cloud Storage bucket
address (gs://[BUCKET_NAME]/**), you're instructing the
scan job to scan recursively. Placing a single asterisk (*) would instruct
the job to scan only the specified directory level and no deeper.
The output will be saved to the specified table within the given dataset and
project. Subsequent jobs that specify the given table ID append findings
to the same table. You could also leave out a
"tableId"
key if you want to instruct Sensitive Data Protection to create a new
table every time the scan is run.
After you send this JSON in a request to the
projects.dlpJobs.create
method via the specified URL, you get the following response:
JSON Output:
{
  "name":"projects/[PROJECT_ID]/dlpJobs/[JOB_ID]",
  "type":"INSPECT_JOB",
  "state":"PENDING",
  "inspectDetails":{
    "requestedOptions":{
      "snapshotInspectTemplate":{

      },
      "jobConfig":{
        "storageConfig":{
          "cloudStorageOptions":{
            "fileSet":{
              "url":"gs://[BUCKET_NAME]/**"
            }
          }
        },
        "inspectConfig":{
          "infoTypes":[
            {
              "name":"PERSON_NAME"
            },
            {
              "name":"PHONE_NUMBER"
            },
            {
              "name":"US_SOCIAL_SECURITY_NUMBER"
            },
            {
              "name":"EMAIL_ADDRESS"
            }
          ],
          "minLikelihood":"POSSIBLE",
          "limits":{

          },
          "includeQuote":true
        },
        "actions":[
          {
            "saveFindings":{
              "outputConfig":{
                "table":{
                  "projectId":"[PROJECT_ID]",
                  "datasetId":"[DATASET_ID]",
                  "tableId":"[TABLE_ID]"
                }
              }
            }
          }
        ]
      }
    }
  },
  "createTime":"2018-11-19T21:09:07.926Z"
}
Once the job has completed, it saves its findings to the given BigQuery table.
To get the status of the job, call the
projects.dlpJobs.get
method, or send a GET request to the following URL, replacing [PROJECT_ID]
with your project ID and [JOB_ID] with the job identifier given in the
Cloud Data Loss Prevention API's response to the job creation request (the job identifier will
be preceded by a "i-"):
GET https://dlp.googleapis.com/v2/projects/[PROJECT_ID]/dlpJobs/[JOB_ID]
For the job you just created, this request returns the following JSON. Notice
that a summary of the results of the scan are returned after the inspection
details. If the scan hadn't yet completed, its "state" key would specify
"RUNNING".
JSON Output:
{
  "name":"projects/[PROJECT_ID]/dlpJobs/[JOB_ID]",
  "type":"INSPECT_JOB",
  "state":"DONE",
  "inspectDetails":{
    "requestedOptions":{
      "snapshotInspectTemplate":{

      },
      "jobConfig":{
        "storageConfig":{
          "cloudStorageOptions":{
            "fileSet":{
              "url":"gs://[BUCKET_NAME]/**"
            }
          }
        },
        "inspectConfig":{
          "infoTypes":[
            {
              "name":"PERSON_NAME"
            },
            {
              "name":"PHONE_NUMBER"
            },
            {
              "name":"US_SOCIAL_SECURITY_NUMBER"
            },
            {
              "name":"EMAIL_ADDRESS"
            }
          ],
          "minLikelihood":"POSSIBLE",
          "limits":{

          },
          "includeQuote":true
        },
        "actions":[
          {
            "saveFindings":{
              "outputConfig":{
                "table":{
                  "projectId":"[PROJECT_ID]",
                  "datasetId":"[DATASET_ID]",
                  "tableId":"[TABLE_ID]"
                }
              }
            }
          }
        ]
      }
    },
    "result":{
      "processedBytes":"536734051",
      "totalEstimatedBytes":"536734051",
      "infoTypeStats":[
        {
          "infoType":{
            "name":"PERSON_NAME"
          },
          "count":"269679"
        },
        {
          "infoType":{
            "name":"EMAIL_ADDRESS"
          },
          "count":"256"
        },
        {
          "infoType":{
            "name":"PHONE_NUMBER"
          },
          "count":"7"
        }
      ]
    }
  },
  "createTime":"2018-11-19T21:09:07.926Z",
  "startTime":"2018-11-19T21:10:20.660Z",
  "endTime":"2018-11-19T22:07:39.725Z"
}
Run analytics in BigQuery
Now that you've created a new BigQuery table with the results of your Sensitive Data Protection scan, the next step is to run analytics on the table.
On the left side of the Google Cloud console under Big Data, click BigQuery. Open your project and your dataset, and then locate the new table that was created.
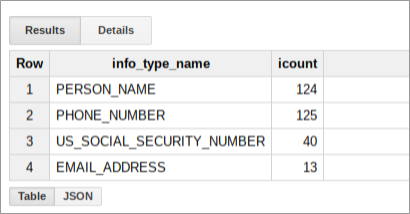
You can run SQL queries on this table to find out more about what the Sensitive Data Protection found within your data bucket. For example, run the following to count all the scan results by infoType, replacing the placeholders with the appropriate real values:
SELECT
  info_type.name,
  COUNT(*) AS iCount
FROM
  `[PROJECT_ID].[DATASET_ID].[TABLE_ID]`
GROUP BY
  info_type.name
This query results in a summary of findings for that bucket that might look something like the following:

Create a report in Looker Studio
Looker Studio enables you to create custom reports that can be based on BigQuery tables. In this section, you create a simple table report in Looker Studio that is based on Sensitive Data Protection findings stored in BigQuery.
- Open Looker Studio and start a new report.
- Click Create New Data Source.
- From the list of Connectors, click BigQuery. If necessary, authorize Looker Studio to connect to your BigQuery projects by clicking Authorize.
- Now, choose which table to search, and then click My Projects or Shared Projects, depending on where your project resides. Find your project, dataset, and table in the lists on the page.
- Click Connect to run the report.
- Click Add to Report.
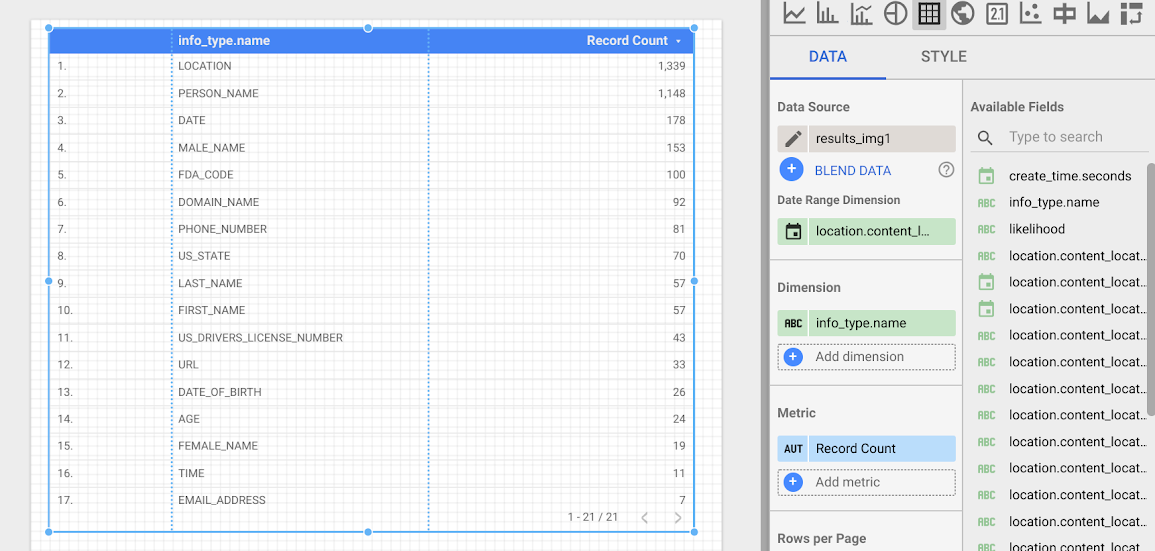
Now you'll create a
table that displays
the frequency of each infoType. Select the field info_type.name as the
Dimension. The resulting table will look similar to the following:

Next steps
This is just the start of what you can visualize using Looker Studio and the output from Sensitive Data Protection. You can add in other charting elements and drill-down filters to create dashboards and reports. For more information about what is available in Looker Studio, see the Looker Studio Product Overview.
