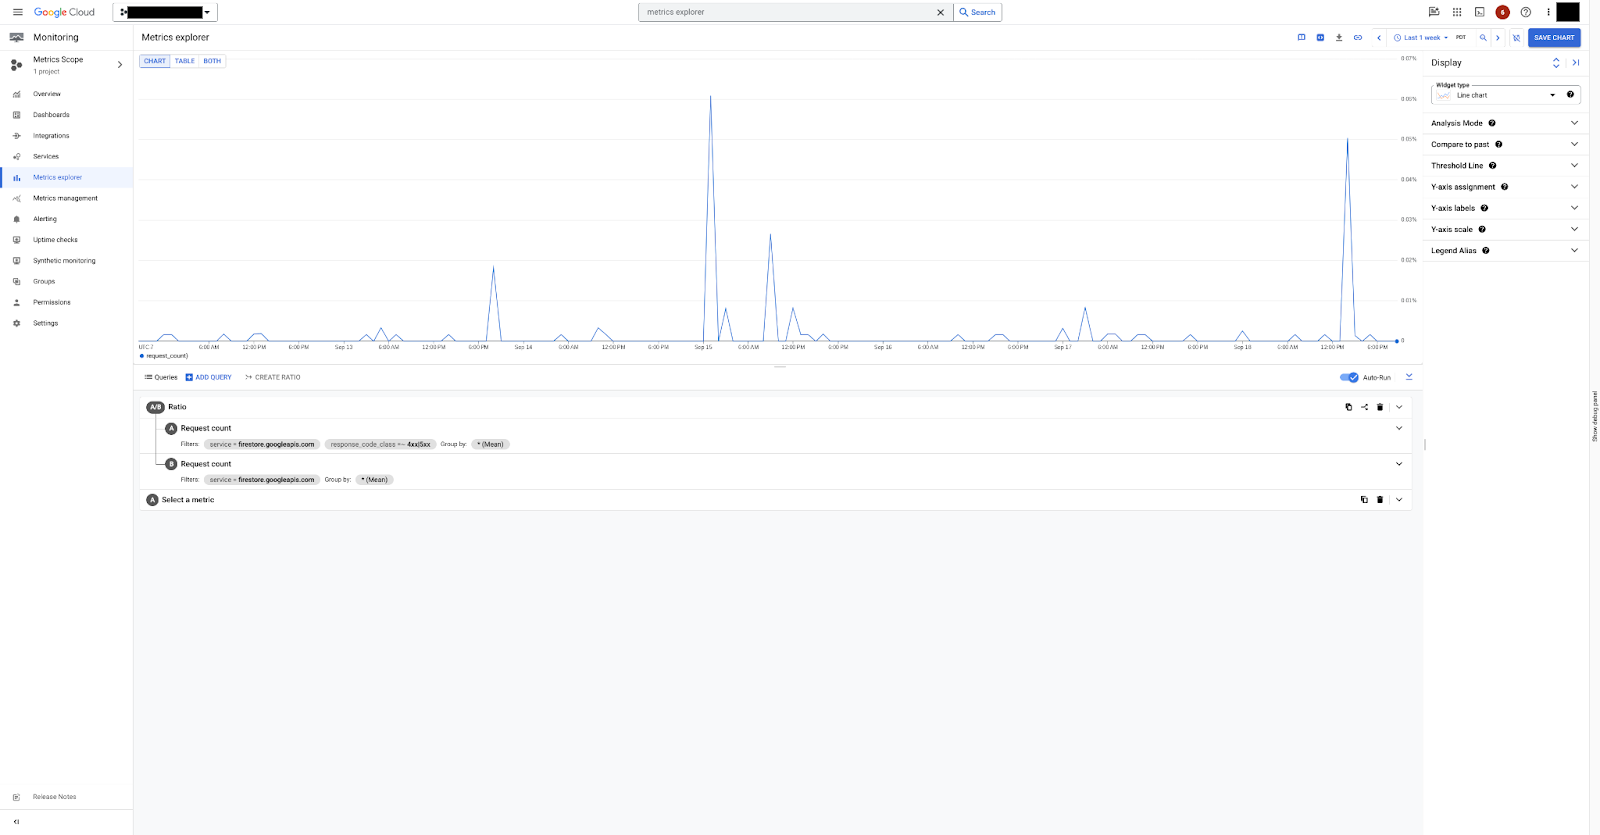
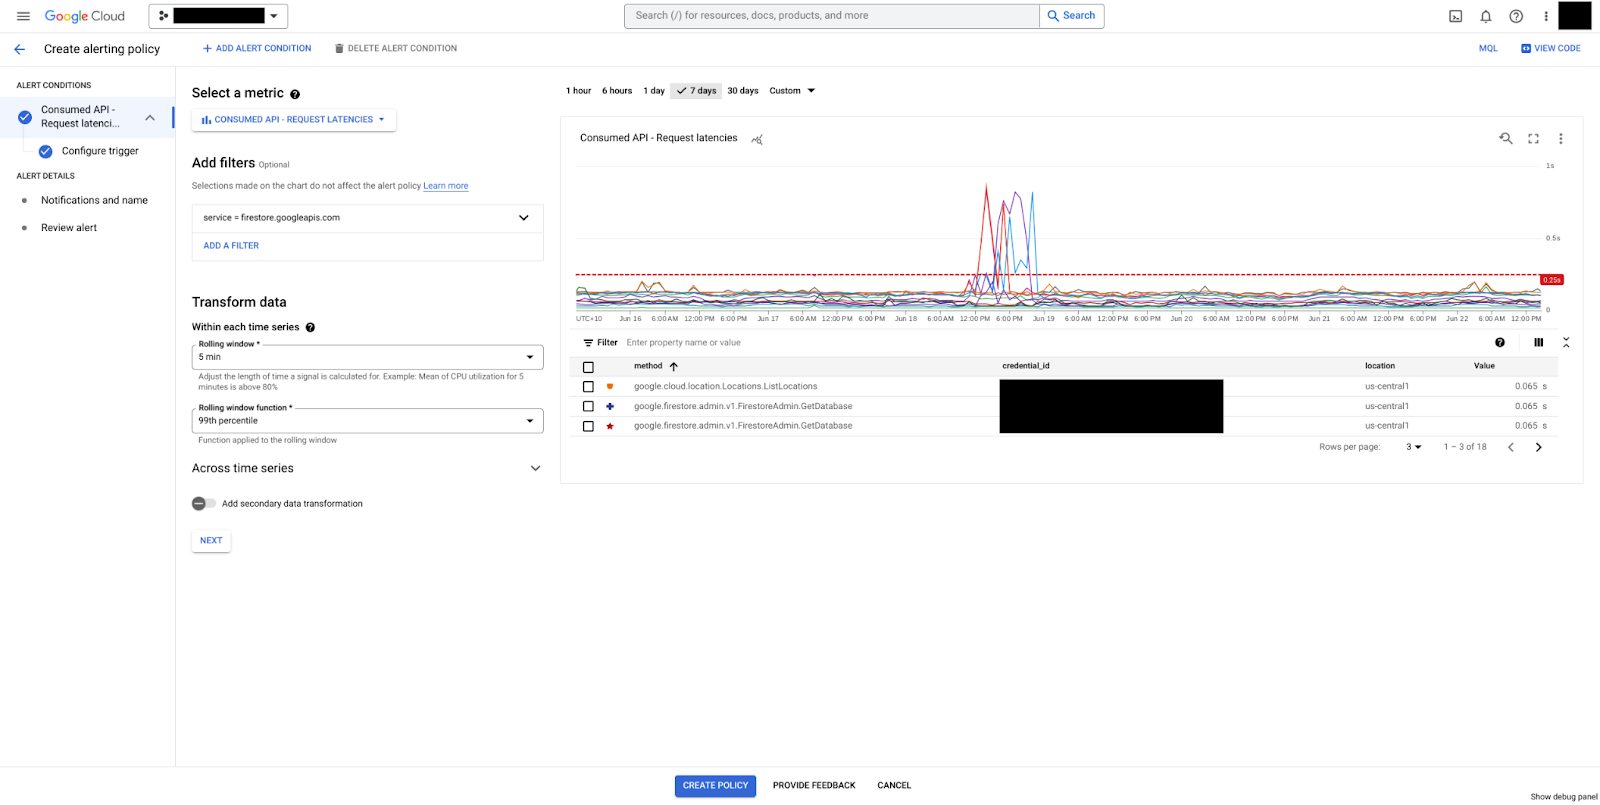
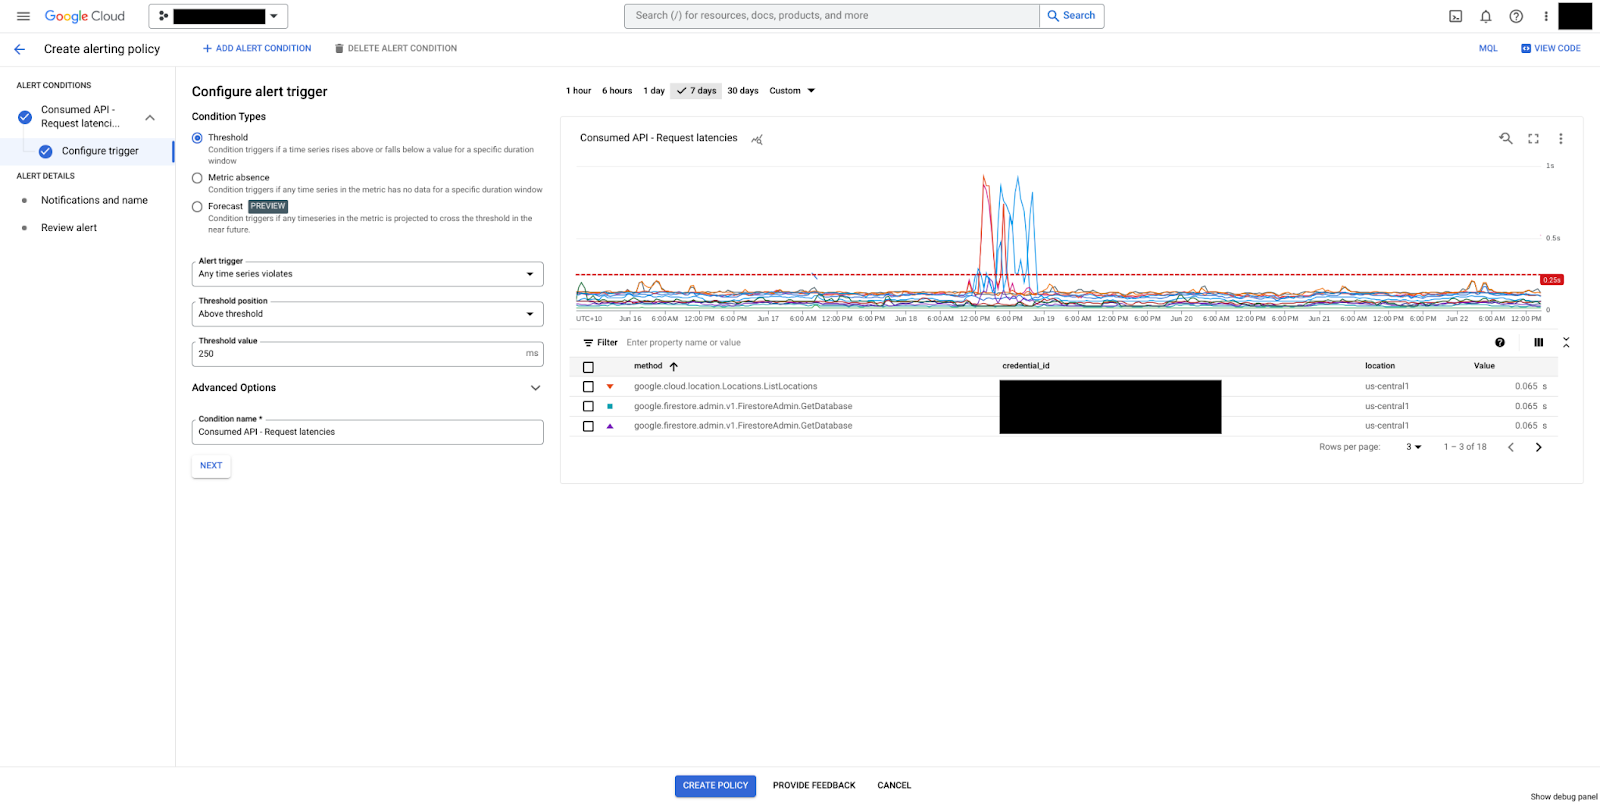
[[["容易理解","easyToUnderstand","thumb-up"],["確實解決了我的問題","solvedMyProblem","thumb-up"],["其他","otherUp","thumb-up"]],[["難以理解","hardToUnderstand","thumb-down"],["資訊或程式碼範例有誤","incorrectInformationOrSampleCode","thumb-down"],["缺少我需要的資訊/範例","missingTheInformationSamplesINeed","thumb-down"],["翻譯問題","translationIssue","thumb-down"],["其他","otherDown","thumb-down"]],["上次更新時間:2025-09-04 (世界標準時間)。"],[],[],null,["# Use the Cloud Monitoring dashboard\n==================================\n\nThis page describes how to use a Cloud Monitoring dashboard to view\navailable metrics, create a custom dashboard, and set alerts.\n\nView Firestore metrics\n----------------------\n\nTo view the different Firestore metrics and create charts, use\none the following:\n\n- The **Monitoring** page in the Firestore section of the Google Cloud console.\n This page includes a pre-defined monitoring dashboard. You can also create\n up to one custom dashboard. To access the **Monitoring** page for a database, follow these steps:\n\n 1. In the Google Cloud console, open the Firestore **Databases** page.\n\n\n [Go to Databases](https://console.cloud.google.com/firestore/databases)\n\n \u003cbr /\u003e\n\n 2. Select a database from the list.\n\n 3. In the navigation menu, click **Monitoring** to open a dashboard.\n\n- The metrics explorer within Cloud Monitoring in Google Cloud console. For more\n information about creating charts, see\n [Create charts with Metrics Explorer](https://cloud.google.com/monitoring/charts/metrics-explorer).\n\nView the Cloud Monitoring dashboard\n-----------------------------------\n\nIn Cloud Monitoring, custom dashboards allow you to display information that\nis relevant to you in an organized way. For example, you might create a\ndashboard to display the performance metrics and alerting policies for your\nproject in your production environment.\n\nFor more information about setting up a custom dashboard, see [Manage custom dashboard](https://cloud.google.com/monitoring/charts/dashboards) and [Add dashboard widgets](https://cloud.google.com/monitoring/charts).\n\n#### Monitor error rates\n\nYou can create a monitoring dashboard to monitor error rates and ensure availability of your database.\nAvailability refers to the rate at which your database responds within an expected timeframe with a successful status code. The [Firestore SLA](https://cloud.google.com/firestore/sla) defines the specific details of what is classified as a valid request.\n\nThe error rate is determined by dividing the number of requests that resulted in an error response by the total number of requests sent.\n\nAn example dashboard for calculating error rates can be created by calculating the A/B ratio for `api/request_count` of valid requests with `4xx` or `5xx` error codes contrasted with the `api/request_count` of all valid requests.\n[](/static/firestore/native/docs/images/cloudmon-error-rate.png) **Figure 1.** Understand availability with error rate.\n\nIn figure 1, you can see how to visualize the error rate ratio using the **api/request_count** metrics in the Metrics explorer.\n\nCreate an alerting policy\n-------------------------\n\nCloud Monitoring allows you to create [alerts](https://cloud.google.com/monitoring/alerts) to notify you when a change in a metric condition occurs. You can use these alerts to be notified of potential problems before they impact your users.\n\nFor more information about creating alerts, see [Create metric-threshold alerting policies](https://cloud.google.com/monitoring/alerts/using-alerting-ui).\n\nConsider the following example where we create a latency alert policy. The\nalerting policy checks p99 latency over a 5 minute rolling window. If the p99 latency stays above 250ms for 5 minutes, the alert is triggered. \n\n### Console\n\n1. In the Google Cloud console, go to the **Monitoring** page then select\n *notifications* **Alerting**.\n\n [Go to Monitoring](https://console.cloud.google.com/monitoring/alerting)\n2. Select **Create policy**.\n\n3. Select the **Request Latencies** metric from the **Consumed API** resource.\n\n4. Add a service filter for `firestore.googleapis.com` for Firestore Native databases.\n\n [](/static/firestore/native/docs/images/cloudmon-dashboard-latencies.png)\n5. Click **Next** to configure the trigger.\n\n6. Select the **Condition Types** as **Threshold**.\n\n A threshold condition is set to a threshold value of 250ms. An alert is triggered when the p99 latency value stays the same for the entire period of the rolling window (5 min).\n [](/static/firestore/native/docs/images/cloudmon-dashboard-alerts.png)\n7. Set the **Threshold value** as **250**.\n\n8. Click **Next** to configure notifications.\n\n9. Set the alert policy name and click **Next**.\n\n10. Review the alert configurations and click **Create Policy**.\n\n### MQL\n\nYou can implement the same latency alert policy using a Monitoring Query Language (MQL) query. For more examples of using MQL, see [Sample MQL queries](https://cloud.google.com/monitoring/mql/examples). \n\n fetch consumed_api\n | metric 'serviceruntime.googleapis.com/api/request_latencies'\n | filter (resource.service == 'firestore.googleapis.com')\n | group_by 5m,\n [value_request_latencies_percentile:\n percentile(value.request_latencies, 99)]\n | every 5m\n | condition val() \u003e 0.25 's'"]]