| title | description | author | tags | date_published |
|---|---|---|---|---|
Measure Cloud Spanner performance using JMeter with SQL queries |
Evaluate Cloud Spanner for custom workloads using the JMeter JDBC Sampler. |
shashank-google,chbussler,rlota |
spanner, cloud spanner, evaluation, migration, performance test, jdbc |
2021-06-30 |
Shashank Agarwal, Ravinder Lota, Christoph Bussler | Google
Contributed by Google employees.
Cloud Spanner is a fully managed, horizontally scalable, transactional, SQL-compliant database service.
Before you migrate to Cloud Spanner, you might want to run performance tests to evaluate its cost and latency. In this tutorial, you do performance testing with Cloud Spanner before making application code changes and migrating data.
Apache JMeter is a popular open source tool for load testing. It includes scriptable samplers in JSR 223-compatible languages, such as Groovy and BeanShell. In this tutorial, you use the JDBC Sampler, which can trigger queries and simulate transactions on databases.
This document demonstrates JMeter performance tests using an example Cloud Spanner schema. You use JMeter to send DML (data manipulation language) commands to the database to test its performance.
This guide uses billable components of Google Cloud, including the following:
- Compute Engine (for running JMeter)
- Cloud Spanner
Use the pricing calculator to generate a cost estimate based on your projected usage.
- Determine whether Cloud Spanner is suitable for an existing workload, before application code changes.
- Write a performance test for your workload on Cloud Spanner using JMeter.
- Estimate the number of Cloud Spanner nodes needed (and therefore cost).
- Test the performance of frequent queries and transactions.
- Demonstrate the ability to scale horizontally.
- Explain optimizations needed for schema and SQL queries.
- Determine latency of select, insert, update, and delete operations with Cloud Spanner.
Possible use cases for doing performance tests with JMeter:
- You want to consolidate current multi-sharded relational database management systems into Cloud Spanner.
- You have a workload that varies with spikes of activity, and you need a database that scales to meet the demand.
- You want to standardize on Cloud Spanner for different applications.
You can't use JMeter to test non-JDBC Cloud Spanner client-side libraries like Python and R2DBC. You can bypass the client library using underlying gRPC or REST APIs, but that is out of scope for this document.
You can't test non-DML features like mutations and parallel reads (partitioned selects) using JDBC Sampler. In such cases, you can embed custom Java code using JSR223 Sampler, but that is out of scope for this document.
Even if you use JMeter performance tests, you should also do application-based performance tests later.
You run performance tests to understand application behavior. Consider the following factors when deciding how to design and run tests that can answer your specific questions.
TPS metrics should be based on your application workload requirements, mostly to support the peak load.
For example, 7,000 read operations per second, 4,000 insert operations per second, and 2,000 update operations per second comes to an overall rate of 13,000 transactions per second (TPS).
You should establish expected response time for different DMLs as success criteria. This can be either based on your business SLAs or current database response time in the case of an existing application.
Sizing of the Spanner cluster depends on the data volume, TPS, and latency requirements of the application workload.
CPU utilization is another important factor when deciding the optimal number of nodes.
You can increase or decrease the initial cluster size to maintain the recommended 45% CPU utilization for multi-region deployment and 65% for regional deployment.
Cloud Spanner Autoscaler is a solution to elastically scale Cloud Spanner. Use JMeter to simulate workloads that vary with spikes of activity to tune autoscaling scaling parameters.
Before you begin writing performance tests, make the following preparations:
- Identify top SQL queries. Determine the latency, frequency, and average number of rows returned or updated for each of the top queries. This information will also serve as a baseline for the current system.
- Determine the Cloud Spanner region or multi-region deployment. Ideally, load should be generated from Cloud Spanner’s leader region for minimum latency and best performance. For more information, see Demystifying Cloud Spanner multi-region configurations.
- Estimate the range of Cloud Spanner nodes required for the workload. We recommend that you have at least 2 nodes for linear scaling.
- Request quota so that you have enough surplus quota for Cloud Spanner nodes on a given region or multi-region. Changes in quota can take up to 1 business day. Although it depends on workload, asking for a quota of 100 nodes for a performance test can be reasonable.
This section assumes that you are migrating an existing application from a common RDBMS database such as MySQL, PostgreSQL, SQL Server, or Oracle.
For information about modeling your schema, see the schema design best practices.
Keep the following in mind:
- Cloud Spanner needs primary keys to be generated from the application layer. Also, monotonically increasing primary keys will introduce hotspots. Using a UUID can be a good alternative.
- Use an interleaved table to improve performance where most (more than 90%) of the access is using join to the parent table. Interleaving must be created from the start; you can't change table interleaving after the tables have been created.
- Secondary indexes on monotonically increasing values (such as indexes on a timestamp) may introduce hotspots.
- Secondary indexes can use storing clauses to improve performance of certain queries.
- Use the
STRINGdata type if you need to have greater precision thanNUMERIC.
This example uses the database Singers, which is created with the following schema:
CREATE TABLE Singers (
  SingerId   STRING(36) NOT NULL,
  FirstName  STRING(1024),
  LastName   STRING(1024),
  SingerInfo BYTES(MAX),
) PRIMARY KEY (SingerId);

CREATE TABLE Albums (
  SingerId     STRING(36) NOT NULL,
  AlbumId      STRING(36) NOT NULL,
  AlbumTitle   STRING(MAX),
) PRIMARY KEY (SingerId, AlbumId),
  INTERLEAVE IN PARENT Singers ON DELETE CASCADE;

CREATE TABLE Songs (
  SingerId     STRING(36) NOT NULL,
  AlbumId      STRING(36) NOT NULL,
  TrackId      STRING(36) NOT NULL,
  SongName     STRING(MAX),
) PRIMARY KEY (SingerId, AlbumId, TrackId),
  INTERLEAVE IN PARENT Albums ON DELETE CASCADE;
JMeter provides a GUI for easy development of tests. After tests are developed, use the command line to run the JMeter tests. You can create a VM (in the same region as Cloud Spanner’s Leader) with the GUI enabled, so the same VM instance can be used for development and execution of tests.
You can use a local workstation for test development, too. Don't use a local workstation to run performance tests, because network latency can interfere with the tests.
-
Download and install JMeter 5.3 or higher, which requires Java 8 or higher.
-
Install Maven, which is used to download Cloud Spanner client libraries.
-
In a command shell, go to an empty directory, where you will keep JMeter dependencies.
-
Download the Cloud Spanner JDBC library and dependencies:
mvn dependency:get -Dartifact=com.google.cloud:google-cloud-spanner-jdbc:RELEASE -Dmaven.repo.local=. -
Move the downloaded JAR files into a folder for JMeter to load in its classpath:
Linux:
find . -name *.jar -exec mv '{}' . \;Windows:
for /r %x in (*.jar) do copy "%x" .
JMeter uses Cloud Spanner JDBC client libraries to connect. It supports various authentication mechanisms, including service accounts. For simplicity, this example uses application default credentials. For detailed steps, see the Cloud Spanner setup documentation.
In summary, you need to set up gcloud and run the following command to store credentials locally:
gcloud auth application-default login
JMeter is a highly configurable tool and has various components from which you can choose. This section provides a basic overview of how to create a JMeter test along with some minimal configurations that you can use as a base for your tests.
JMeter has a hierarchical structure to the tests, with a top node
called the test plan. It consists of one or more thread groups, logic
controllers, sample generating controllers, listeners, timers, assertions, and configuration elements. Because a test plan
is the top-level configuration element, saving a test plan to disk also saves all nested objects, and the resulting
file is saved with a .jmx filename extension.
For simplicity, it's sufficient to have the top-level test plan contain a single thread group, which in turn contains one or more samplers. There can be multiple samplers (and other components) within a thread group; each is executed serially per thread.
Test plans and thread groups can also have configuration elements such as a JDBC connection or CSV data reader. Configurations can be shared with child nodes.
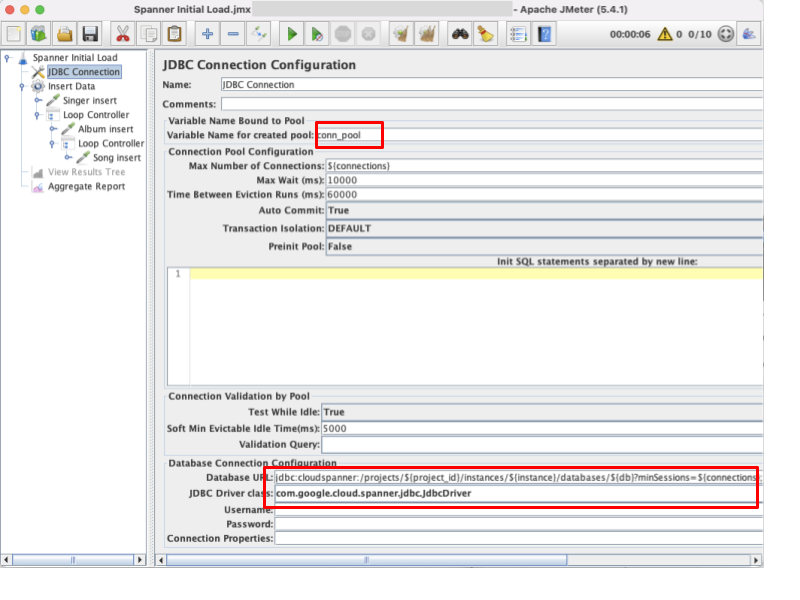
As shown in the following screenshot, within each JMeter test, you need to provide connection parameters, which are used by the JDBC library to connect to Cloud Spanner.
project_id: Google Cloud project IDinstance: Cloud Spanner instance IDdb: Cloud Spanner database nameconnections: Cloud Spanner sessions. You should have 1 session per thread.grpc_channel: There can be a maximum of 100 sessions per gRPC channel.
The following parameters may not need to be changed; they will be passed from the command line, and default values are used when testing from JMeter graphical user interface.
users: Number of parallel threads per thread group, increasing stress on target.iterations: Number of times each thread should loop, extending duration of tests.
The parameters listed above are used for the JDBC connection configuration.
For a complete list of JDBC properties, see the JdbcDriver documentation.
The connection pool variable (conn_pool) is used by JDBC samplers to obtain a connection. The JDBC connection URL is as follows:
jdbc:cloudspanner:/projects/${project_id}/instances/${instance}/databases/${db}?minSessions=${connections};maxSessions=${connections};numChannels=${grpc_channel}
You can use additional configurations such as
READ_ONLY_STALENESS as needed.
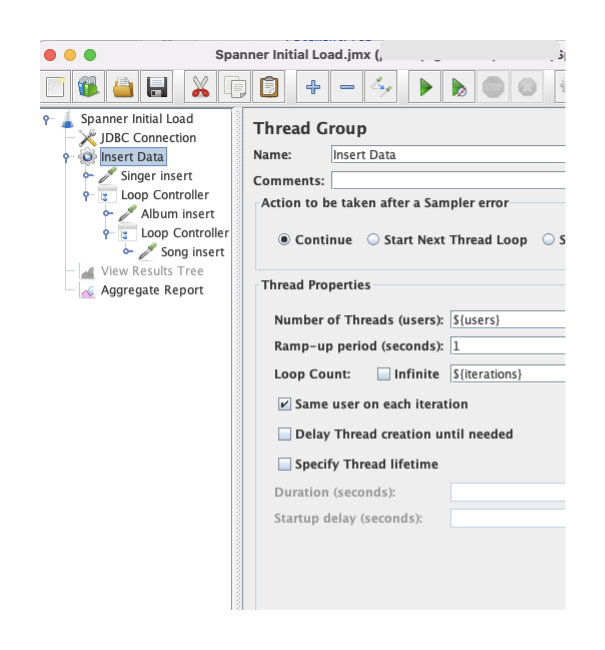
A thread group represents a group of users, and the number of threads you assign a thread group is equivalent to the number of users that you want querying Cloud Spanner.
The following screnshot shows an example thread group configuration:
If you want a thread group to run for a given duration, then you can change the behavior as shown in the following screenshot:
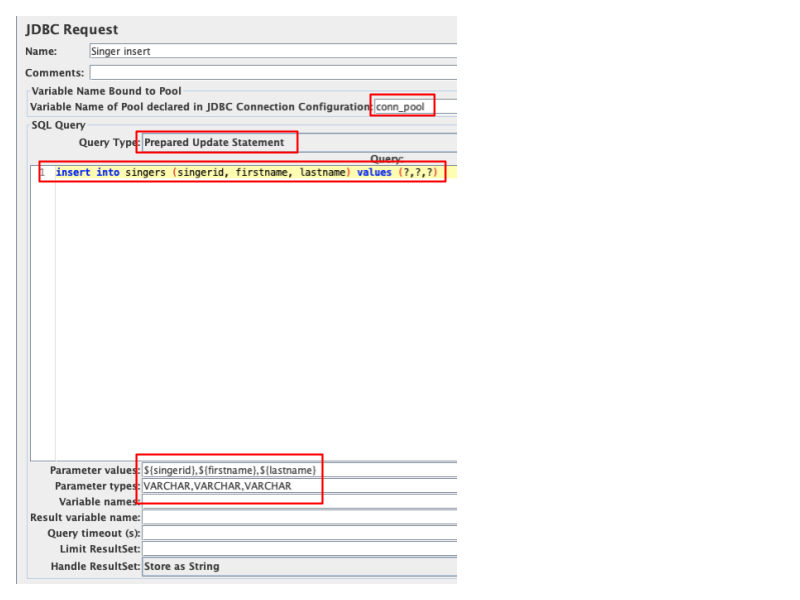
You can send SQL queries with the JDBC Sampler. Using Prepared Select or Prepared Update is recommended, because it has better performance on Cloud Spanner.
You can add an aggregate report (or other types of reports) after all the thread groups. This will show staistics from the JMeter graphical user interface (GUI) in real time for all of the samplers. However, we don't recommend running performance tests in GUI mode, because the JMeter GUI can be slow. You can use it for test development purposes, though.
We recommend running tests in command-line mode, which generates HTML reports with the different JMeter reports.
Before you start doing performance tests, you need to initialize the database with seed data. We recommend that you load the volume of rows in each table, representative of current production data size.
Typically, you can use Dataflow jobs for importing data from non-Cloud Spanner databases.
However, sometimes you can't do that because of schema changes with Cloud Spanner. An alternative is to mock seed data using JMeter.
Data loading prepares Cloud Spanner to create splits (shards) and distribute different nodes as leaders for each split. For details, see Database splits.
The volume of data depends on the SQL queries for which you want to do performance tests. The main focus is to load those tables that will be used by read or write queries. Ideally, the test data should be similar in volume to production data. In addition, data might need to be modified to fit into a potentially modified Cloud Spanner schema.
Ideally, you should reset your database to the same seed data for comparison between multiple test executions. You can use backup/restore (or export/import) to initialize each run to the same initial dataset. The latter is better if different configurations are tested.
Sometimes it is not simple to import existing data into Cloud Spanner. Mock data can be generated by writing insert queries in JMeter.
Below is an example Spanner-Initial-Load.jmx used to load sample schema. You will need to update
connection parameters as described previously.
The Spanner-Initial-Load.jmx
test generates random data hierarchically into Singer, Album, and Song tables. Each singer gets a
random number of albums between 0 and 20. Similarly, 0-15 songs per album are generated. Parallel threads (users)
are used to insert data concurrently.
You can run this JMeter test with the following command:
jmeter -n -t Spanner-Initial-Load.jmx -l load-out.csv -Jusers=1000 -Jiterations=1000
Watch the CPU utilization of Cloud Spanner. Increase the number of nodes and JMeter’s parallel threads (users) to increase the data generation rate. Increase the iterations count to increase execution time.
Initial load should be done with randomly generated keys. Using monotonically increasing keys will lead to write hotspots and cause a lengthy delay in populating the database.
Guidelines for developing performance tests:
- Target to configure performance tests such that they generate transactions per second (TPS) similar to the current database (baseline). Later in the execution phase, increase the number of users (load) to simulate scaling.
- Prefer to have only one transaction per thread group. This will allow you to throttle load for that transaction independent of other transactions. A transaction could be composed of single or multiple sql queries. For example, it is fine to have just a single select/insert/update query in a thread group, if that compares evenly with a transaction in your current database (baseline).
- Determine the transactions per second (TPS) in the current database (baseline) for each DML operation and throttle load accordingly. In other words, sometimes even with one user in the thread group, there is far higher TPS than baseline. If so, then use timers to introduce delay, as needed to tone down the TPS close to baseline.
- Use parameterized queries for better performance.
- Tune SQL queries by adding relevant hints as needed.
- Cloud Spanner interface in the Cloud Console can lead to longer query execution time, especially when result size is large. You can use gcloud or Spanner CLI as alternatives to time SQL queries accurately.
- Use query execution plans to identify query bottlenecks and tune them accordingly.
- Add indexes as needed to improve performance of select queries.
- Use FORCE_INDEX hint for all queries as it can take upto a few days before the query optimizer starts to automatically utilize the new index.
- Use GROUPBY_SCAN_OPTIMIZATION to make queries with GROUP BY faster.
- Use join hints to optimize join performance, as needed.
- If needed, export query parameter values into a CSV file. Then use CSV Data Set Config in JMeter to supply parameters from the CSV file.
Assume that the following baseline needs to be performance-tested:
| Sno | Transactions | Baseline TPS |
|---|---|---|
| 1. | select AlbumTitle from Albums where SingerId = ? and AlbumTitle like ? |
7000 |
| 2. | select SingerId, AlbumId, TrackId, SongName from Songs where SingerId = ? and AlbumId = ? order by SongName |
5000 |
| 3. | update Singers set SingerInfo = ? where SingerId = ? |
1000 |
Below is the sample JMeter test to simulate the above load. You will need to update connection parameters as discussed previously.
Spanner-Perf-Test.jmx
uses a CSV configuration to get SingerId and AlbumId parameters.
The following are the first few lines, for example:
"singerid","albumid"
"0002aad0-30e9-4eae-b1a0-952ebec9de76","328e1b6f-a449-42d1-bc8b-3d6ba2615d2f"
"0002aad0-30e9-4eae-b1a0-952ebec9de76","43b1011e-d40d-480b-96a2-247636fc7c96"
"0002aad0-30e9-4eae-b1a0-952ebec9de76","5c64c8f2-0fad-4fe7-9c3a-6e5925e3cbcd"
This CSV can be created using a SQL query such as the following, which randomly selects data from the album table:
SELECT SingerId,AlbumId FROM Albums TABLESAMPLE BERNOULLI (0.1 PERCENT) limit 10000;
There are three thread groups with the transaction as defined previously, as shown in the following screenshot:
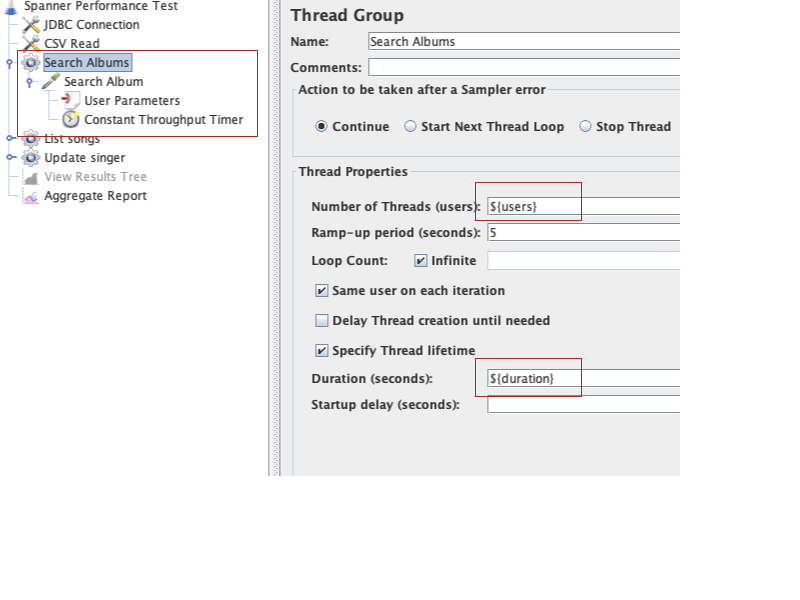
The CSV Read configuration reads data from a CSV file that is being used in all three thread groups. All three thread groups are very similar. The following screenshot shows the Search Albums thread group.
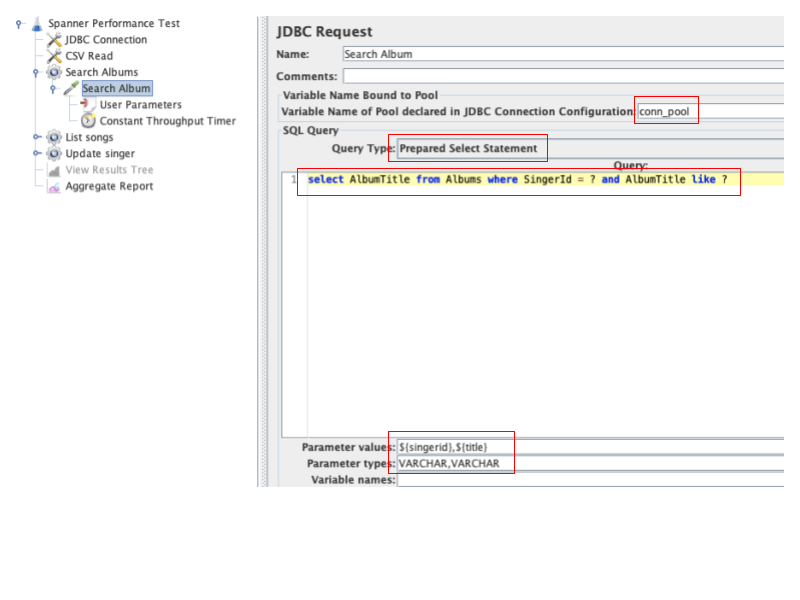
It is configured to use users and duration parameters, which can be passed by command line. It contains one JDBC Sampler Search Album, which depends on User Parameters and Timer.
The Search Album JDBC sampler as shown above triggers an SQL query as shown in screenshot above. It populates query parameters using variable as follows:
${singerid} -- obtained from CSV Read
${title} -- obtained from User Parameters
A timer is configured to throttle load to meet the requirement. It needs to be supplied with transactions per minute, so 7000 TPS * 60 = 420,000 transactions per minute.
Guidelines for executing the tests, for best results:
- Execute tests from the same Cloud Spanner region for a regional spanner and “leader” region for multi-region Cloud Spanner instances.
- Run JMeter tests from the command line, not GUI mode.
- Run each test at least 3 times to even out random differences.
- Warm up Cloud Spanner before running tests (as in production).
- Run tests for long enough such that TPS is stable. It depends on the workload, for example having at least a 15 minute test can ensure that enough ramp-up time is available.
- Generate load on Cloud Spanner, because scaling Cloud Spanner can take some time to stabilize.
- Ensure that the client machine running JMeter has enough resources. JMeter is a CPU-intensive process.
- Increase JMeter’s jvm heap size, if needed.
- Run multiple JMeter instances in parallel, or use remote testing for horizontal scaling of JMeter.
Often, a single instance of JMeter is not able to produce enough load on a multi-node Cloud Spanner instance. - Ensure that Cloud Spanner is above the recommended CPU threshold: 65% for regional and 45% for multi regional.
- Plan for long-running tests (2 hours or more) to verify sustained performance. This is because Cloud Spanner can start system tasks, which may have performance impact.
Run the test:
jmeter -n -t Spanner-Perf-Test.jmx -l test-out.csv -Jusers=100 -Jduration=900
You can modify the number of users and duration as needed.
The test generates a test-out.csv file with raw statistics. You can use the following command to
create a JMeter report from it:
jmeter -g test-out.csv -o [PATH_TO_OUTPUT_FOLDER]
You gather performance metrics after the test execution.
- Validate that the test ran according to the requirements defined earlier.
- Compare results with your success criteria.
We recommend capturing these performance metrics from Spanner monitoring rather than the JMeter report. JMeter provides this information with added latency for each query execution depending on how busy the VM has been, so it's not the true measure of Spanner response time.
Based on the success criteria, the most important metrics are the following:
- Operations per second (read and write)
- Latency at 50th and 99th percentile for different types of operations
- CPU utilization
The Spanner monitoring dashboard provides this information aggregated at the minute level.
For custom dashboards or metrics that are not available in standard dashboards, you can
use the Metrics Explorer.
Operations per second
The Spanner dashboard provides information about the read and write operations running on the Spanner instance. For example, the following chart shows a total TPS of 43744 per second for the selected duration.
Latency
An example of read and write operations latency at 50th and 99th percentile is captured in the following chart.
Latency metrics have been redacted in the preceding screen shot.
Note: You can also get 95th percentile latency from Cloud Monitoring
You can use introspection tools to investigate issues with your database. Use query statistics to know which queries are expensive, run frequently, or scan a lot of data.
Sometimes writes can be competing and can result in higher latency. You can check the lock statistics to get clarity on wait time and higher latency and apply best practices to reduce the lock time.
CPU utilization
This metric is important for understanding whether the cluster is under-utilized or over-utilized.
This information can be used to further optimize the cluster size. For details, see Investigating high CPU utilization.
To avoid incurring charges to your Google Cloud account for the resources used in this tutorial, you can delete the project:
- In the Cloud Console, go to the Projects page.
- In the project list, select the project that you want to delete and click Delete.
- In the dialog, type the project ID, and then click Shut down to delete the project.
- Cloud Spanner schema and data model
- Schema design best practices
- Demystifying Cloud Spanner multi-region configurations
- Introspection tools
- Handling auto-incrementing keys data migration
- Try out other Google Cloud features for yourself. Have a look at our tutorials.

