Log-based Metrics in Action
Romin Irani
Developer Advocate
Try Google Cloud
Start building on Google Cloud with $300 in free credits and 20+ always free products.
Free trialGoogle Cloud Operations Suite provides support for hundreds of metrics across various services. In addition to these predefined metrics that are available, you can always report custom metrics from your applications. One of the common requests that I have heard from organizations is to look for patterns of text in their application logs and report data on that. As an example, say your application is tracking orders placed and one of the messages that you log is “Order Placed” in the application logs. What if we could track all occurrences of “Order Placed” in the logs, count it, expose it as a metric and even visualize or raise alerts based on its count.
In this blog post, we are going to take a sample application (Cloud Run application) that emits a custom log message and we will use that to:
Define a log-based metric that can count the number of occurrences of that custom log message.
Visualize the metric via a custom Dashboard in Google Cloud Monitoring.
Define a logs based alert to notify if the value of that metric is above or below a threshold.
We shall be using/demonstrating the following tools:
Cloud Code VS Code Extension for generating a sample application and deploying that to Cloud Run.
Logging Explorer to inspect the logs generated by our sample application and convert a specific text message to a log-based metric.
Cloud Monitoring Dashboard to visualize the log-based metric that we created.
Cloud Monitoring Logs based Alerts to create an alert based on the log-based metric.
Let’s get started on this journey.
Sample Application
We shall be using one of the sample applications that the Cloud Code VS Extension can create for us. Our goal is to keep the application simple and focus on the task of understanding log-based metrics.
To get going on this task, we have a few prerequisites:
You have a Google Cloud Account, a Google Cloud Project with Billing enabled.
You are familiar with Cloud Shell.
The steps to get the sample application deployed to Cloud Run are given below:
Go ahead and login via the web Google Cloud console and launch Cloud Shell. Click on Editor to go to the VS Code based Editor.
I have used the Cloud Code extension to create a New Application. I selected Cloud Run application, Java as my preferred language, selected a folder (my-logbased-metrics-app) to generate the application.
This is a simple Java Spring-based application. All we are going to do now is to add our custom log message, which we want to then convert into a metric.
We will add the custom log message in the main Controller file that has been generated as part of the Java Spring application. Visit the following file from the Cloud Shell Editor: src/main/java/cloudcode/helloworld/web/HelloWorldController.java
Add the following additional line highlighted in the screenshot:
We are now ready to deploy this application to Cloud Run.
Deploy the application to Cloud Run
Follow the steps given below:
In the Cloud Shell Editor, click on the Cloud Code extension link, which on clicking will bring up the different actions that you can do as shown below. This time click on Deploy to Cloud Run.
This will bring up the various prompts to enable APIs (if you have not), authorization, etc. Go with the defaults and then a screen detailing the Cloud Run service details will come up. Go with the defaults for now and click on the Deploy button.
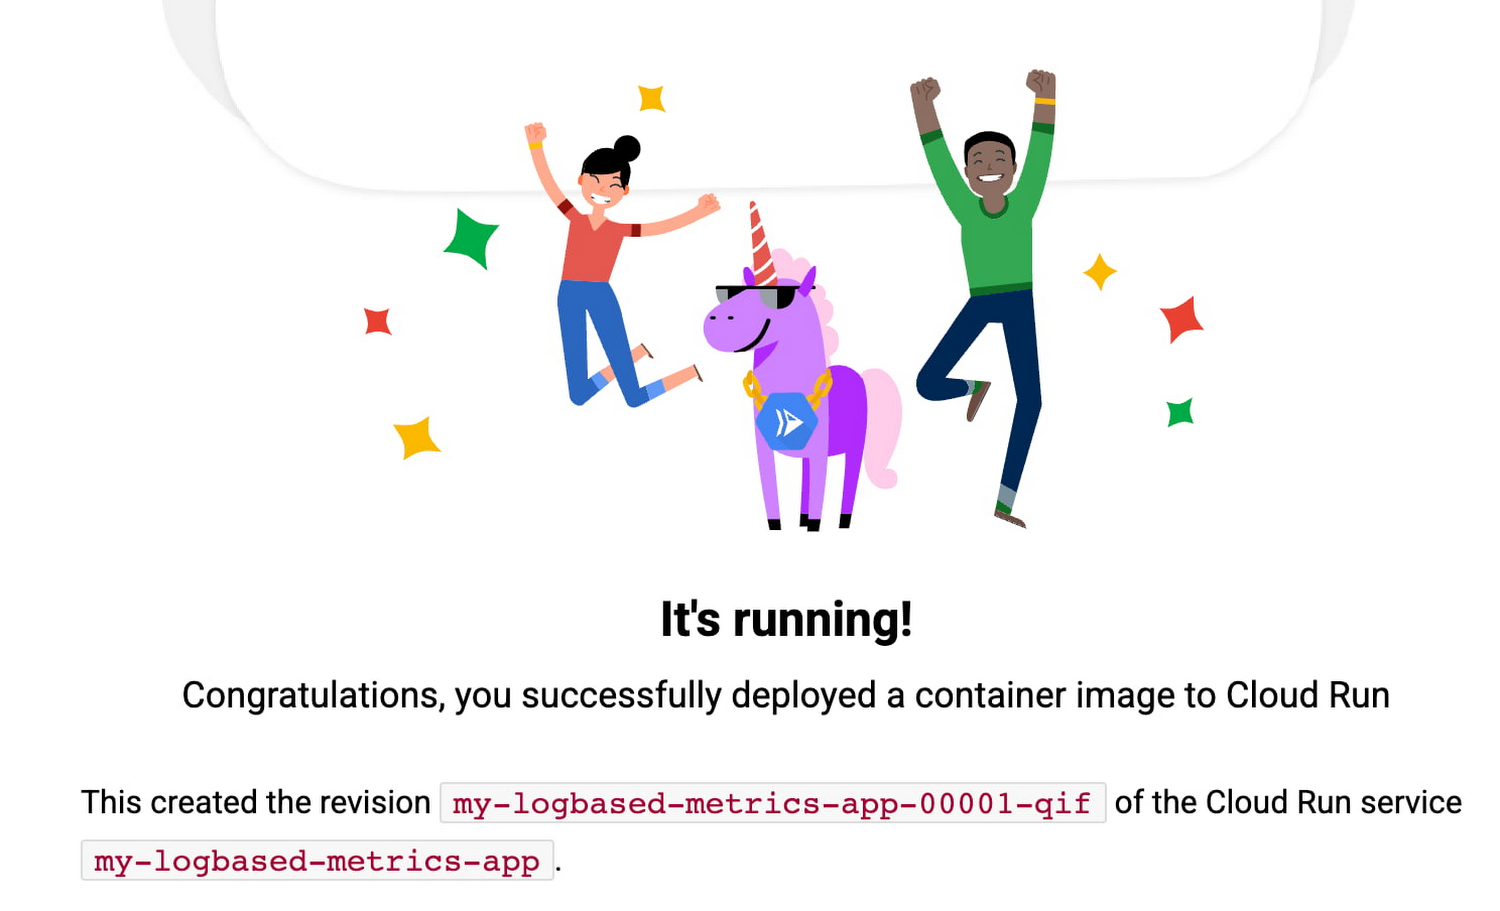
If we visit the URL of the Cloud Run service (format is https://[TAG---]SERVICE_IDENTIFIER.run.app), we see the demo application home page as shown below:

View the logs
Remember that we had put the log message “home page visited” in the controller that is invoked when anyone visits the home url (“/”). This should ideally be generating a message in the logs, which we should be able to inspect using the Logging Explorer.
My suggestion is to simulate a few such messages by refreshing the home page that you see on visiting the Cloud Run service that you just created.
In the Logging Explorer, paste the following snippet in the Query window and click on Run query button.
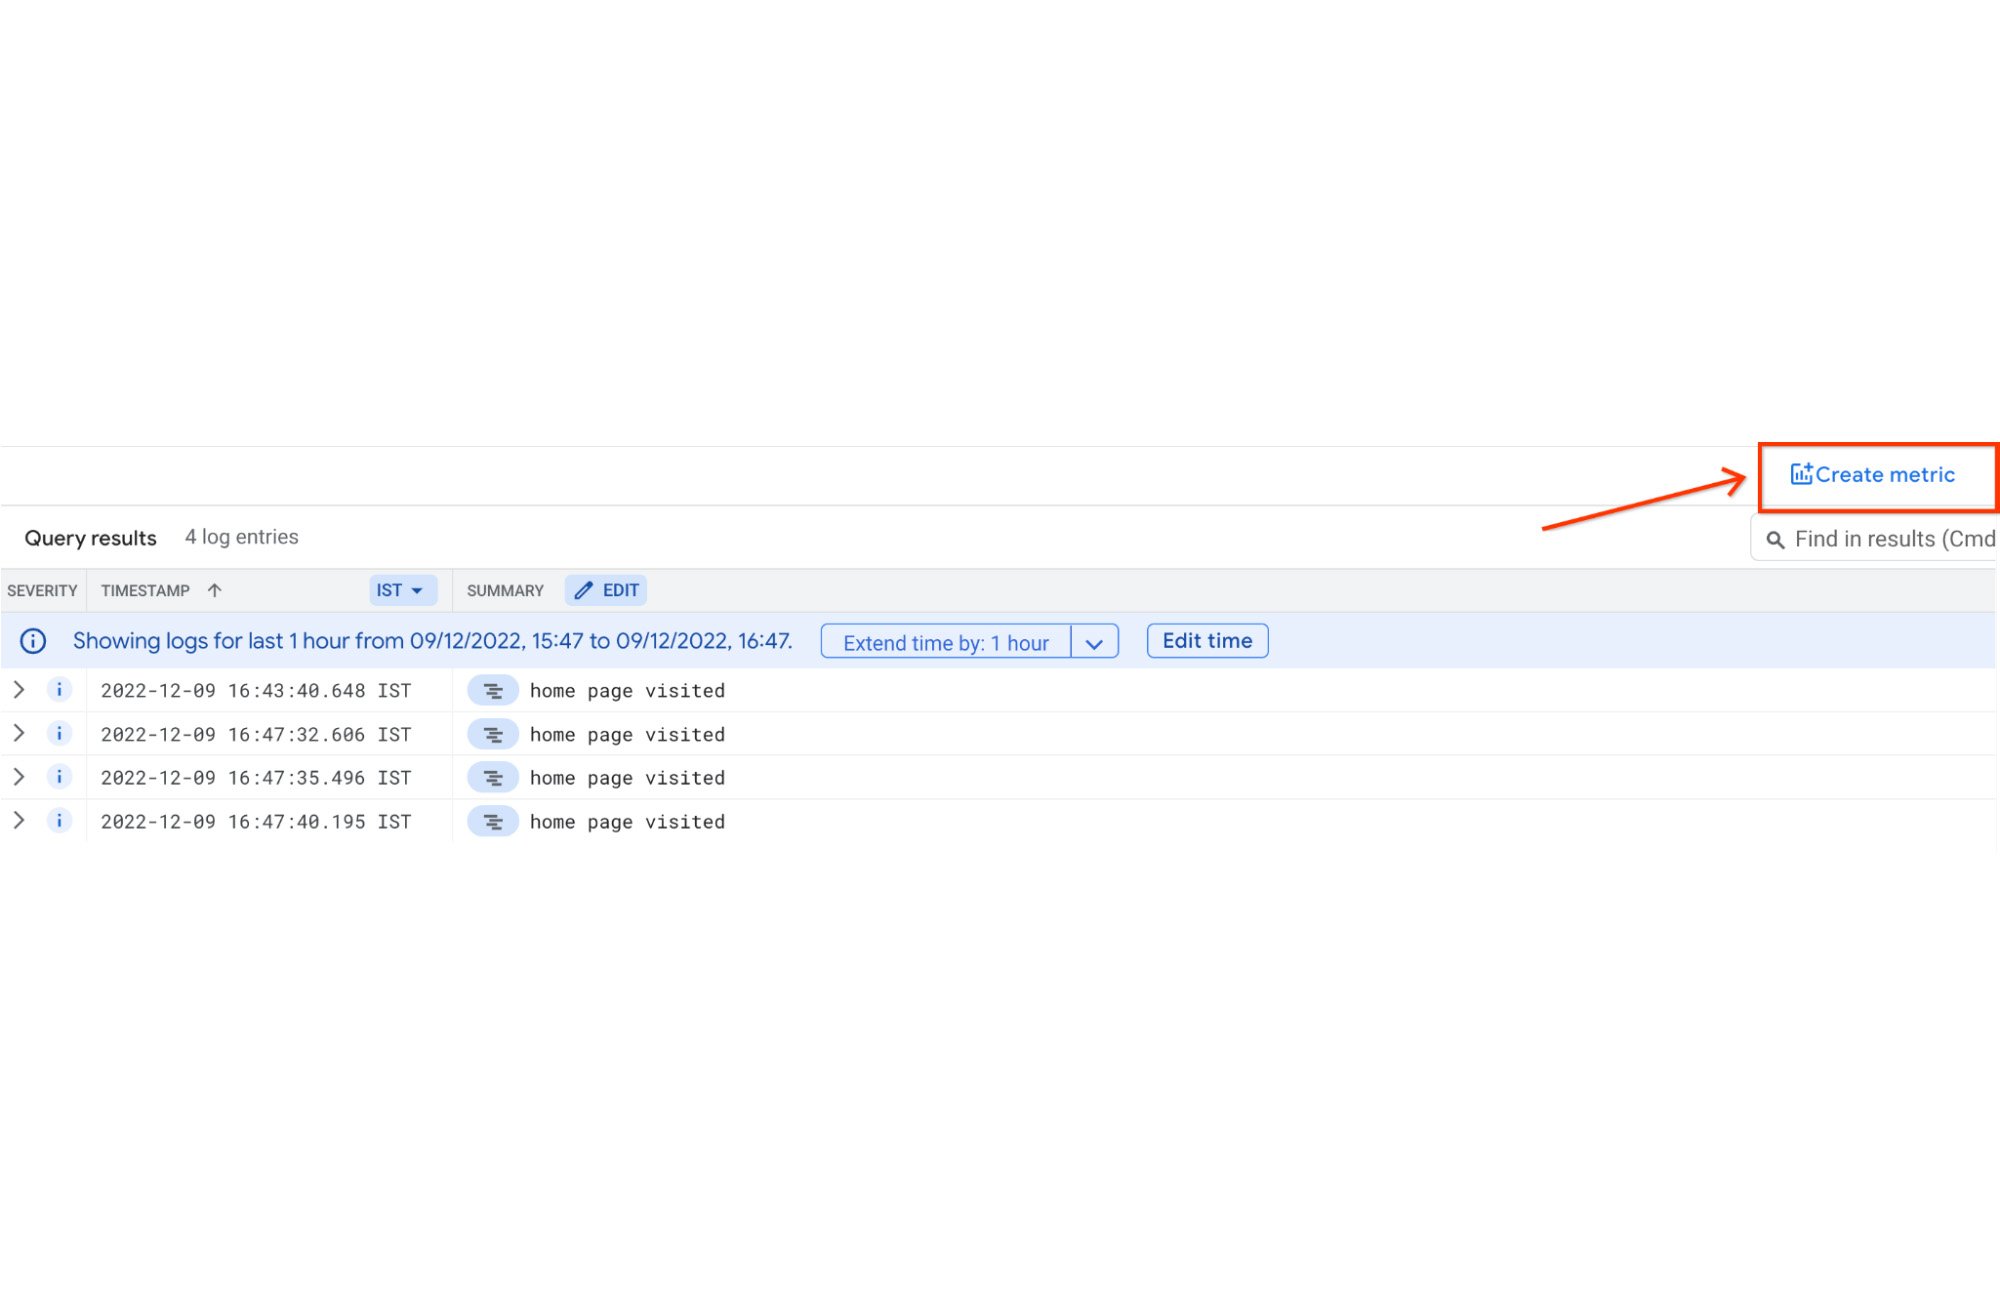
This should be able to filter the specific message that we are looking for i.e. “home page visited” and show the results as given below:


Create the log-based metric
To create the log-based metric, click on the Create metric button as shown below:

This will bring up an options dialog, where you should select the following:
This is a counter metric since we are only interested in counting the number of occurrences.
In the name field, provide a name like home_page_visits.
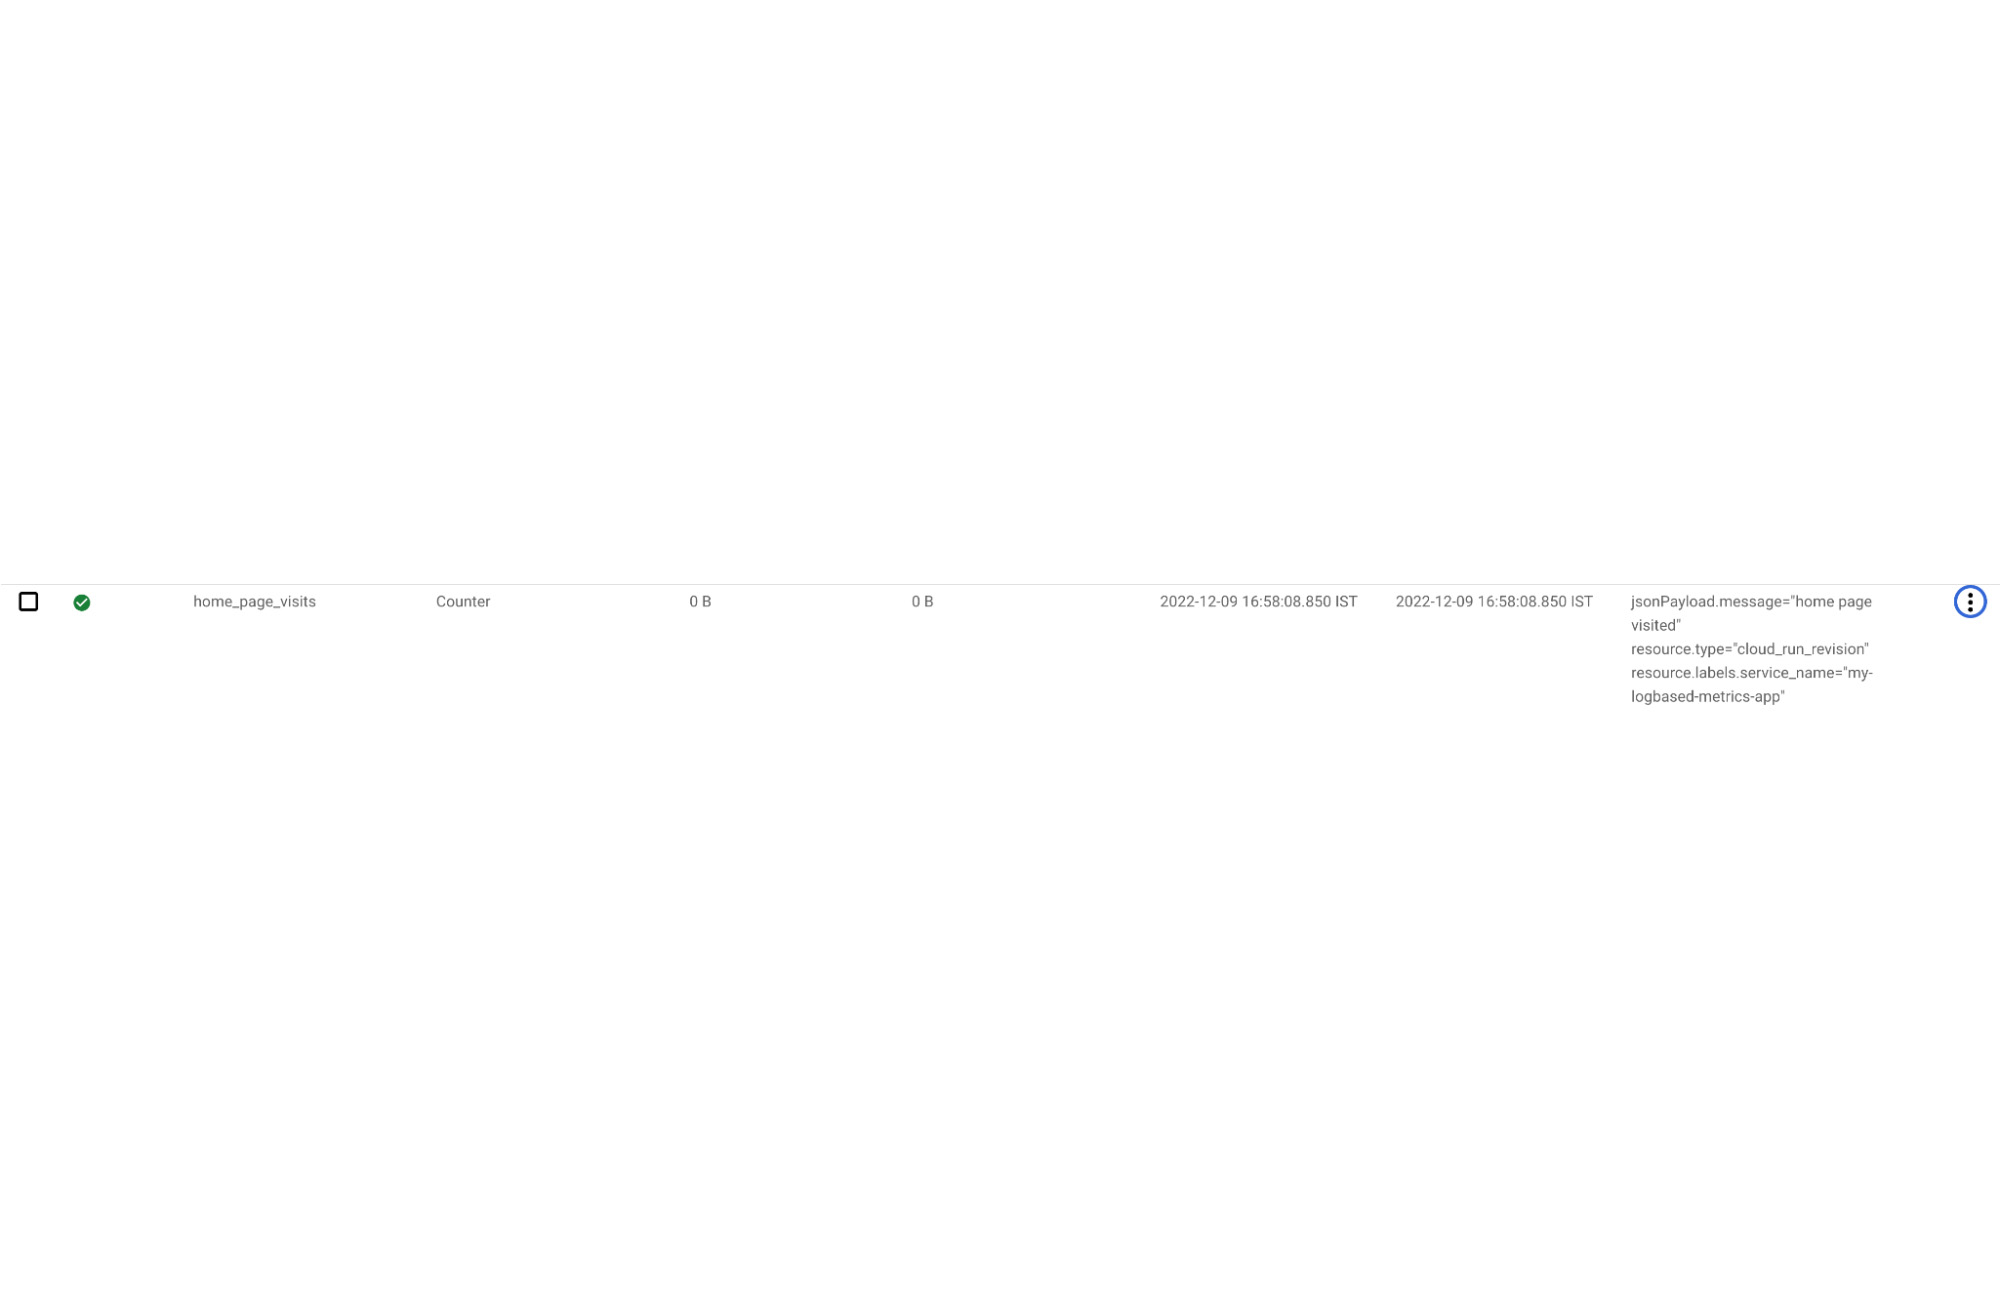
Go with the defaults for the other fields and click on Create Metric. This will create the metric and you will be able to see these metrics in your Log-based Metrics menu option in Logging Explorer.

Visualize the metric and create alerts (Optional)
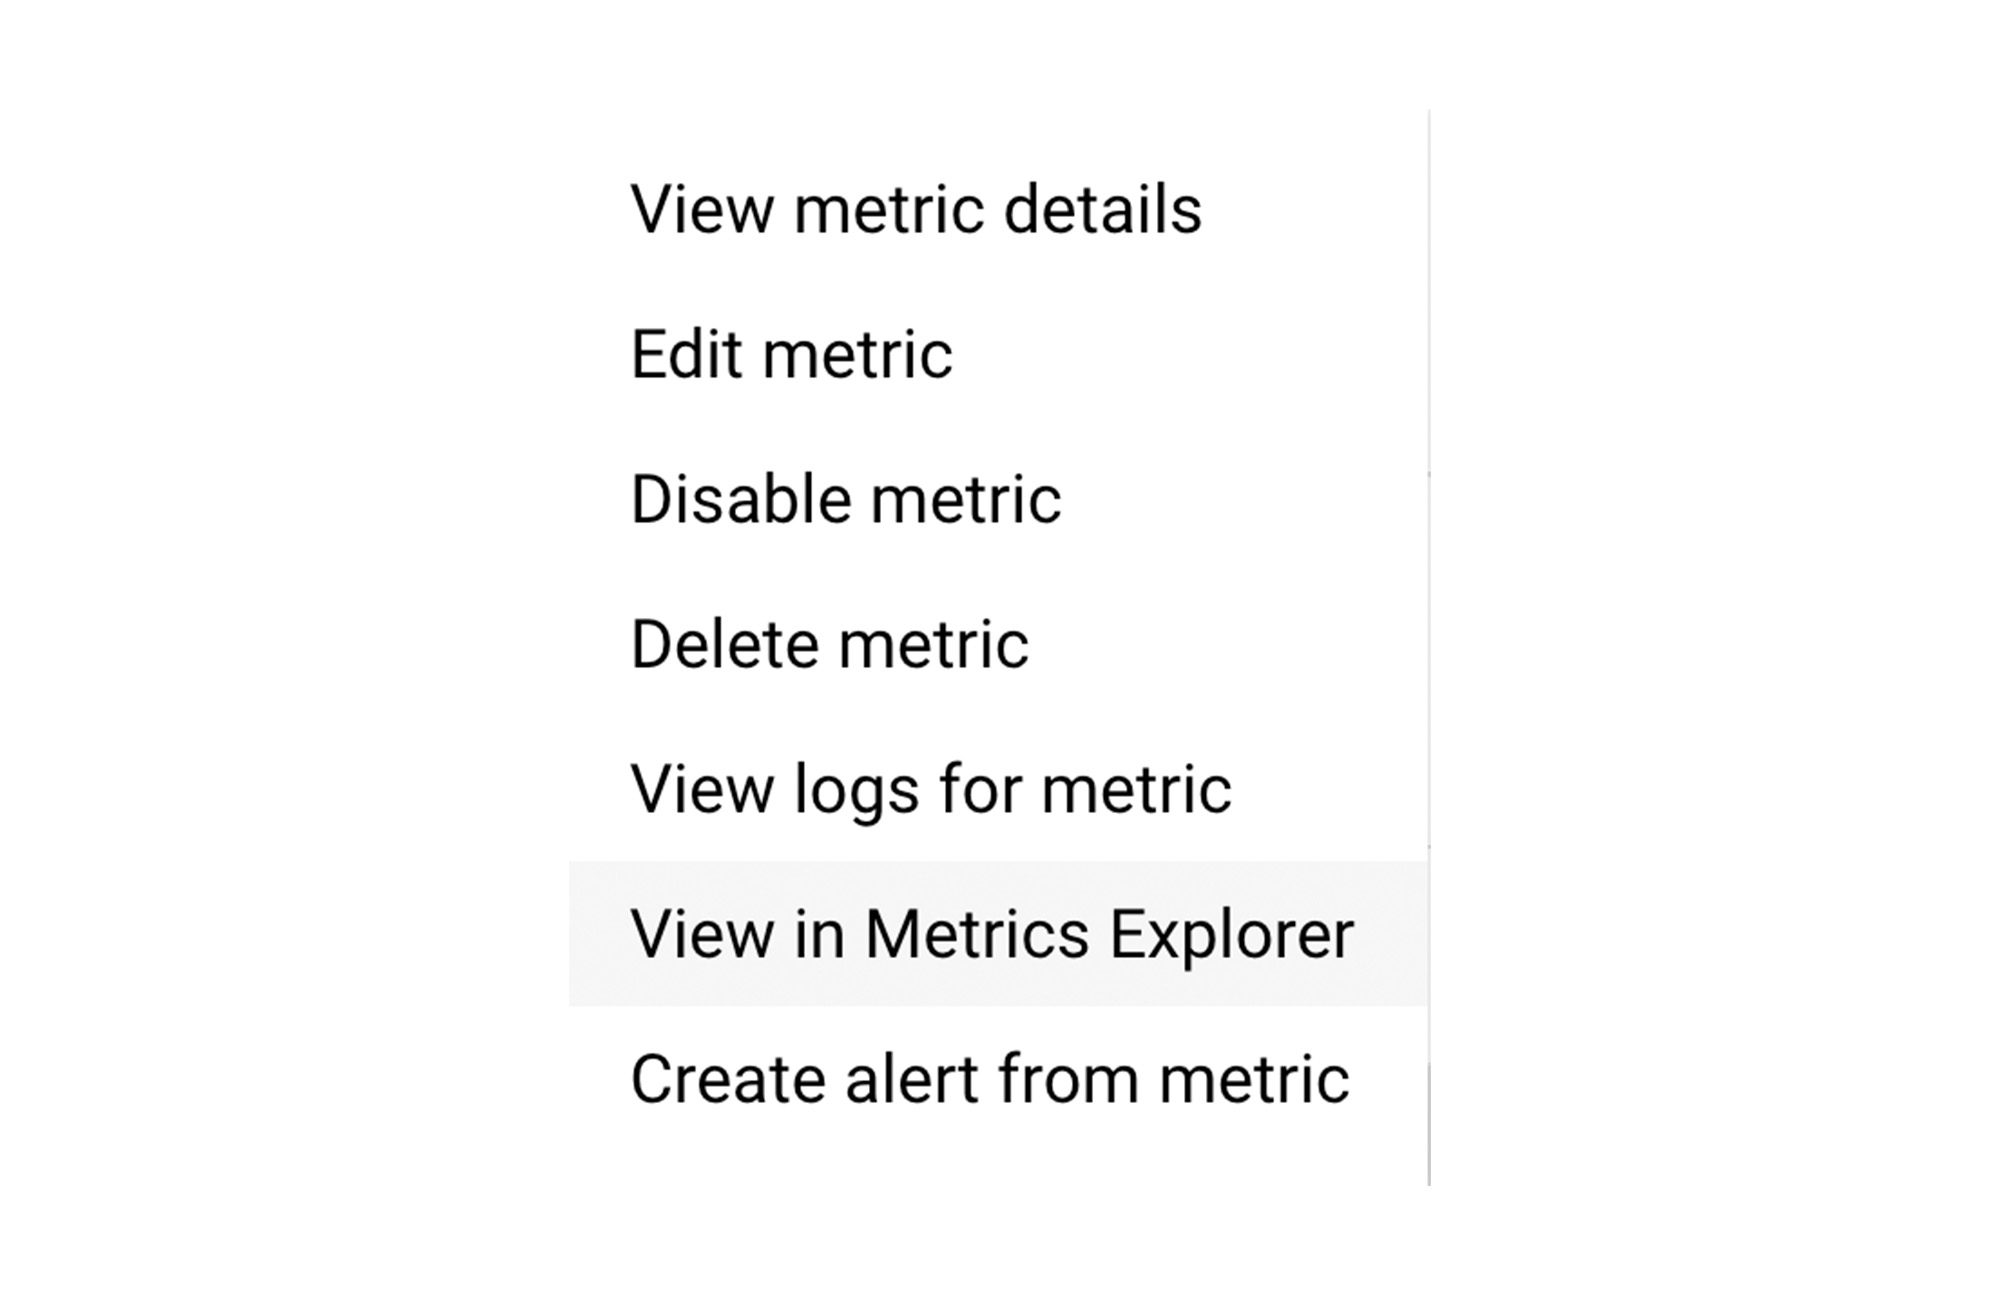
Click on the 3 dots to the extreme right of the above metric and select View in Metrics Explorer from the menu as shown below:

This will open up the custom metric that we have defined into a sample Chart as given below:
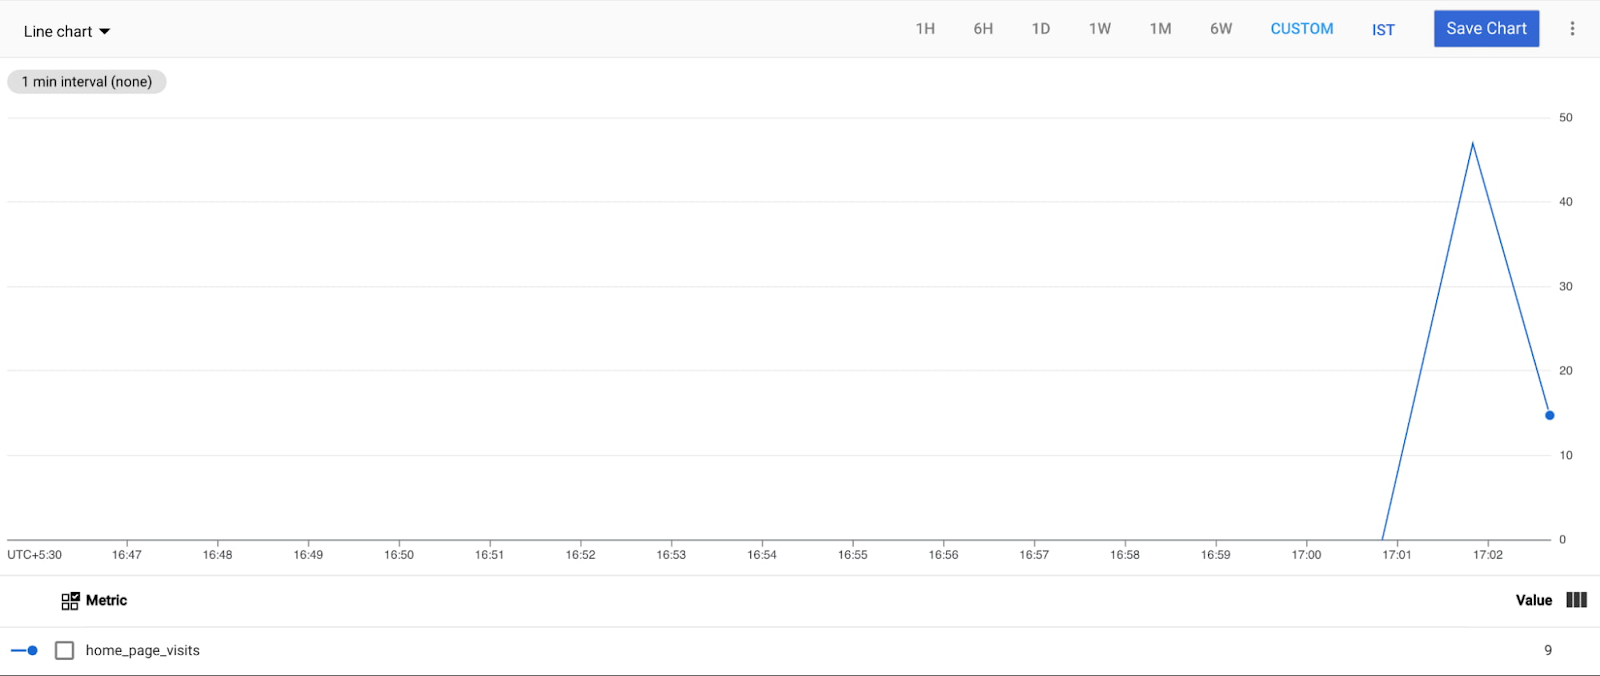

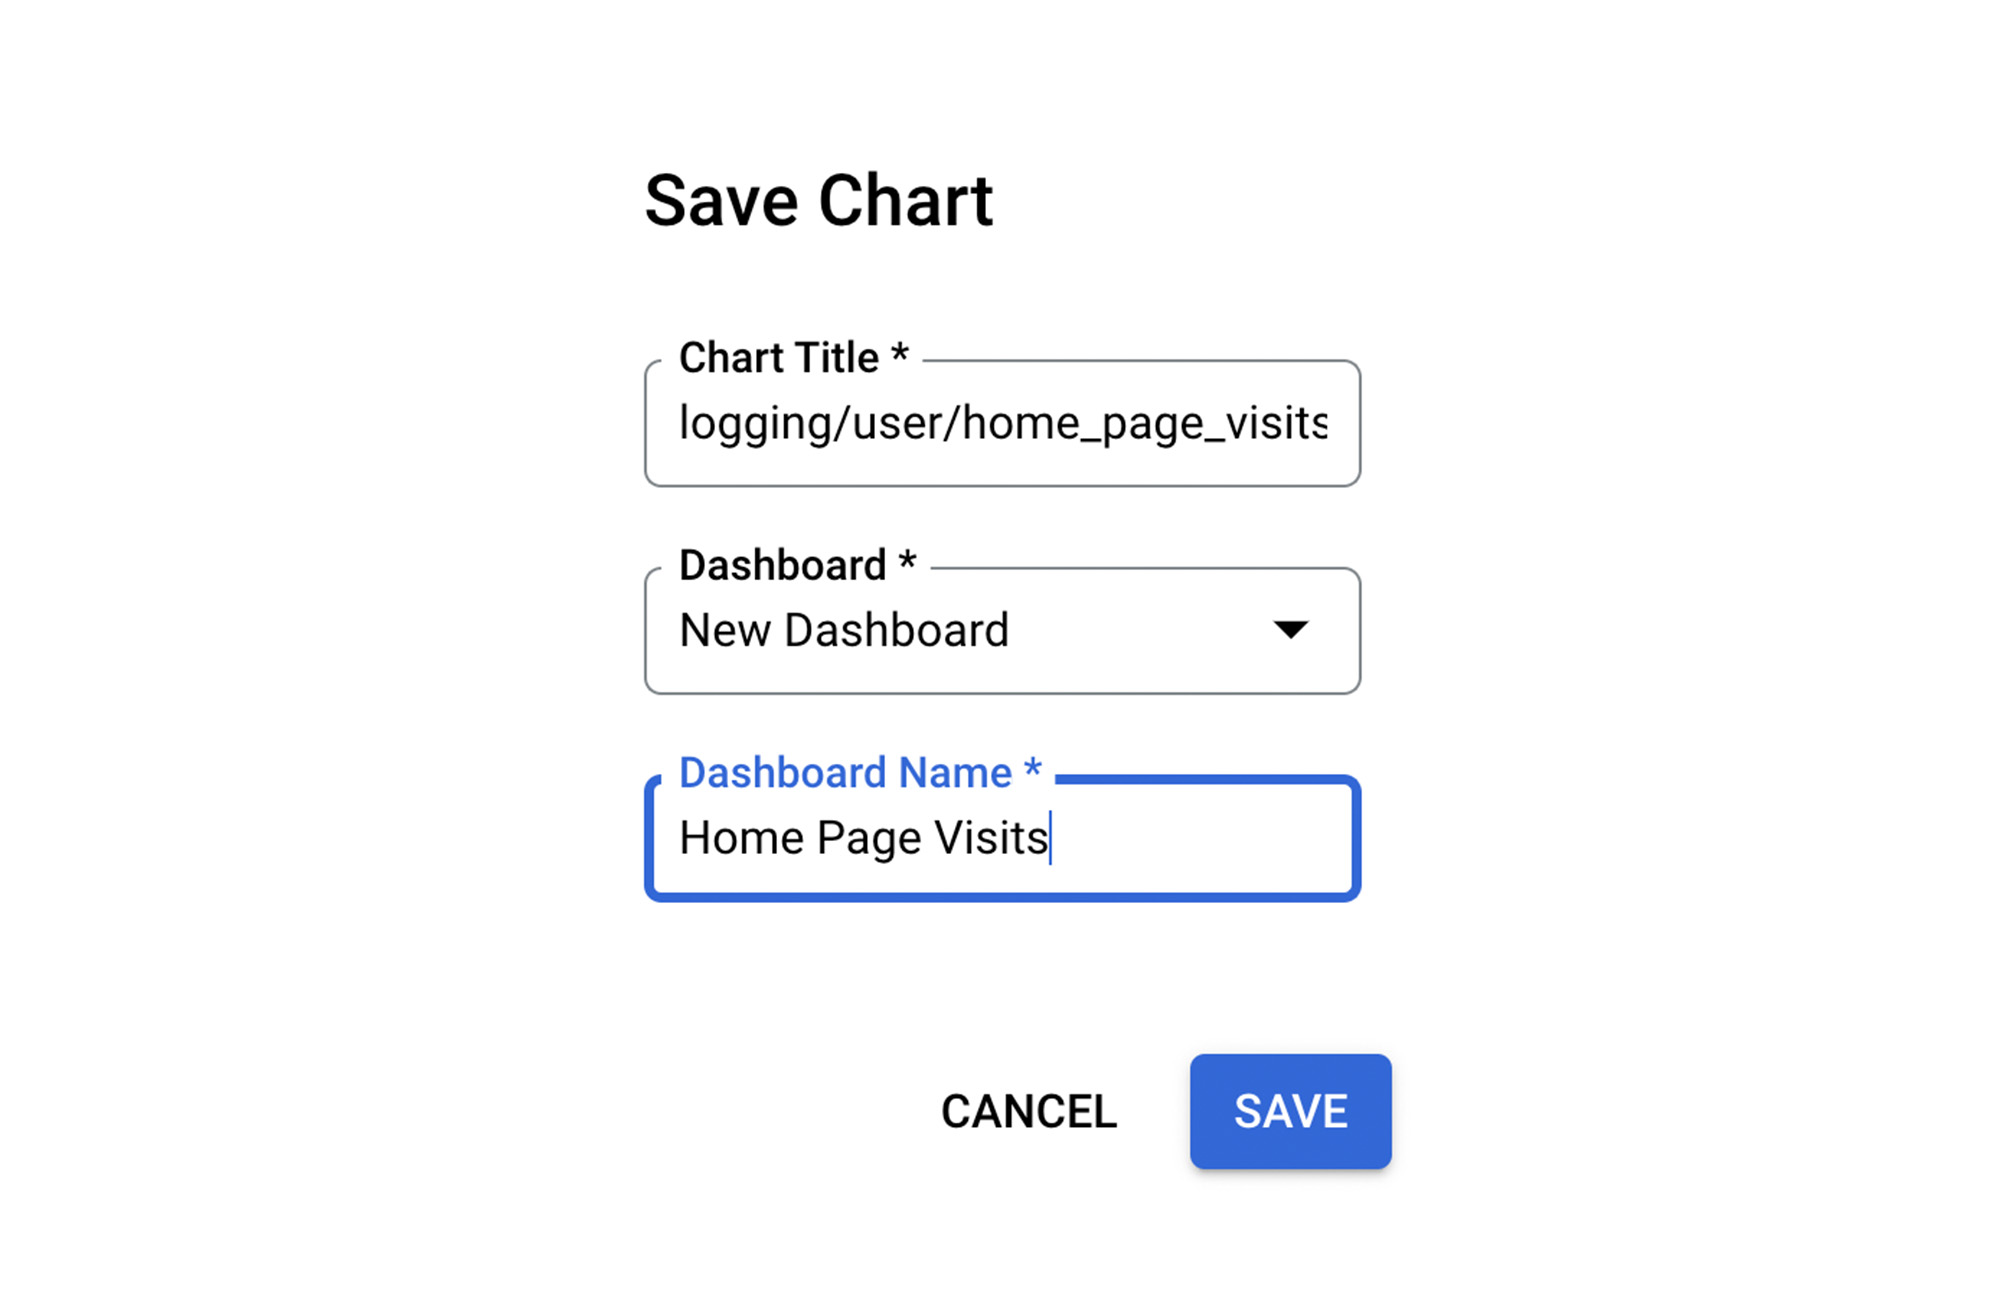
Do simulate some data by using your browser to visit the Cloud Run service URL (format is https://[TAG---]SERVICE_IDENTIFIER.run.app) that we deployed earlier, to populate data for the chart, and give it a minute for that data to make it from the logs ingestion/filtering to this chart. Click on the Save Chart button to save this chart and create a new Dashboard as given below:

This will create a custom dashboard for us and we can monitor this data as it comes up:
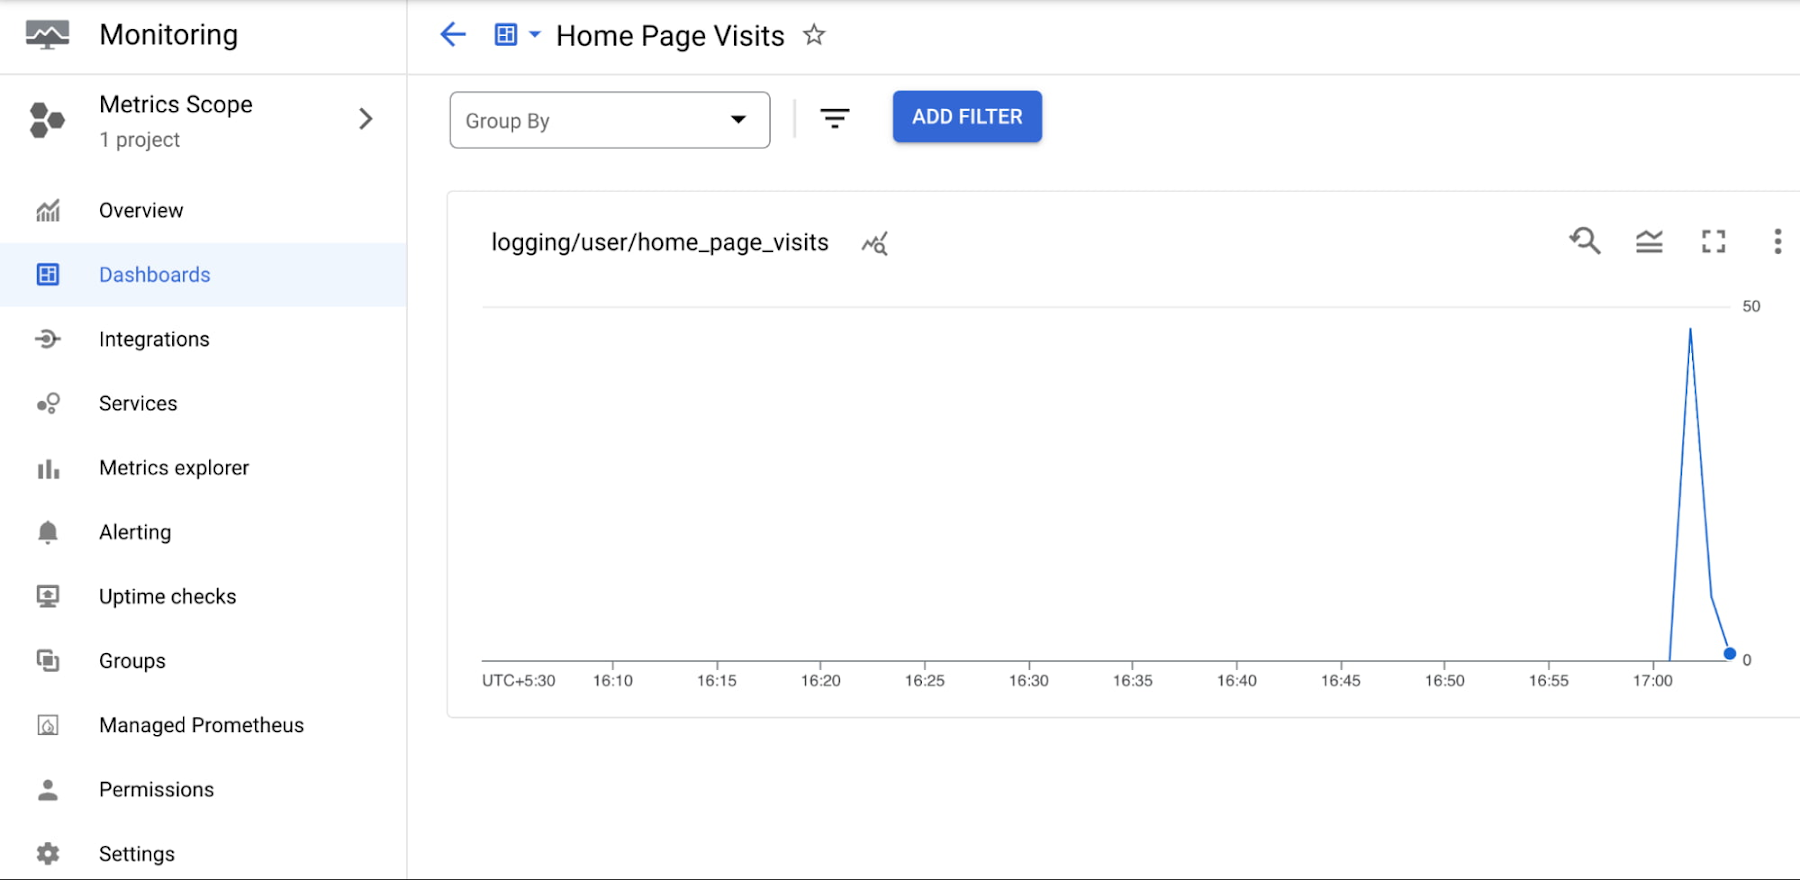

To create an alert on this value, all you need to do is click on the three dots in the chart above and select Convert to alert chart. This will present you a screen and options to monitor a certain threshold and if the value is above or below, you can raise a notification. Check out the documentation to create an Alert and Notifications.
Applying Log-based metrics to your use cases
The example that we saw was to demonstrate the process of creating log-based metrics but you can utilize it for some real-world scenarios based on your custom metrics.
Some of the scenarios could be:
A legacy application that logs error messages starting with “ERROR : <rest of the message>”. You can use log-based metrics to identify this pattern and track the number of errors.
A web application that logs specific transaction duration in the logs. For e.g. “Add Operation took 100 ms”. You could use a regular expression to extract out the duration and create a Distribution based log metric instead of a counter metric that we earlier saw. This can help you visualize the response times across different percentiles.
Note: In case you are looking for a powerful way to search through and analyze your logs using SQL, take a look at Log Analytics. Log Analytics allows you to use powerful search expressions (including the Regular Expression scenario mentioned here) via familiar SQL queries to inspect and analyze your logs.
Hope this guide was useful to help you understand the process of setting up a custom Log-based metric based on your log messages. Google Cloud services are well connected to help you navigate from inspecting the logs to converting them into a Log-based metric and then visualizing it via a custom dashboard in Cloud Monitoring.


