From "Vibe Checks" to Continuous Evaluation: Engineering Reliable AI Agents

Vlad Kolesnikov
Developer Relations Engineer
I live through the same story with every single AI agent. After weeks of experiments and tests, it works like a charm. Suddenly, someone comes with a question that the agent fails to answer properly. I rush to make a change by tweaking one of the prompts. After a handful of tweaks, the failed prompt produces good results. I try a few of my favorite prompts and it works like a charm. Another new question, another perfect hit. I push it to production.
Less than 24 hours later, user reports start trickling in. The agent is hallucinating dates. It fails to cite sources for obscure topics. A little change that felt so solid ended up sabotaging dozens of other use cases that I haven't bothered to verify.
This is the vibe check trap.
The Vibe Check Trap
In the classical software world, if you change a line of code, you run unit tests. The predicate assert 2 + 2 == 4 will never statistically drift. Integration tests are more complex and flaky, but they're still largely stable in well-maintained projects. But in the world of Generative AI, we're building software on top of probabilistic foundations. A prompt that works 99% of the time today might work 92% of the time tomorrow just because the underlying model's weight distribution shifted slightly, or because the temperature parameter introduced a new token sequence. A minor change in the prompt or grounding data format might trigger a significant regression in the model's answers.
Relying on vibe checks—manually chatting with the agent to see if it feels right—is a recipe for disaster in production. It's subjective, unscalable, and susceptible to confirmation bias.
This guide is for software engineers who are ready to graduate from building demos to building production-grade AI systems.
In this post, we'll explore how to apply the engineering discipline of continuous evaluation (CE) for AI agents. With CE, you refine your agent's prompts, tools, and logic by using a combination of production monitoring, automated LLM-as-a-judge scoring, and human feedback. We'll show you how to apply CE using specific tools from the Google Cloud ecosystem: Agent Development Kit (ADK), Vertex AI Gen AI evaluation service, and Cloud Run.
1. The Engineering Mindset: Discovery vs. Defense
To organize our work effectively, we must distinguish between two fundamental modes of AI engineering. In traditional DevOps, these map roughly to Development and QA/Ops, but the distinction is sharper here due to the stochastic nature of large language models (LLMs). In AI engineering, these modes translate to discovery mode and defense mode.
Discovery Mode (The Lab)
This is the creative phase. You're an explorer.
-
Activities: Prompt engineering, tool selection, model selection.
-
Goal: Raise the ceiling. You want to see if the model is capable of solving a complex reasoning task at least once.
-
Methodology:
-
Few-shot iteration: Providing examples in the prompt to guide the model's behavior.
-
Red teaming: Actively trying to break the model with adversarial inputs to find edge cases.
-
Vibe checks: Yes, here they're useful! They help you build intuition about the model's personality and latency.
-
Outcome: A golden prompt that works perfectly for your specific reference examples.
Defense Mode (The Factory)
This is the industrialization phase. You're a reliability engineer.
-
Activities: Regression testing, shadow traffic, monitoring.
-
Goal: Protect the floor. You want to ensure that the average performance across 10,000 requests meets your Service Level Objectives (SLOs).
-
Methodology:
-
Dataset-driven evaluation: Running the prompt against hundreds of diverse examples, not just the three you memorize.
-
Strict gating: Automatically failing a build if the grounding score drops below 0.85.
-
Automated metrics: No humans involved in the loop.
-
Outcome: A deployed system that you can sleep through the night with.
Comparison Table
The failure mode: Most teams stay in discovery mode forever. They treat every bug report as a reason to tweak the prompt, push it live, and pray. This creates a game of whack-a-mole where fixing one hallucination causes two more. To exit this trap, we need regression testing, which we'll show you how to implement next.
2. The Reference System: Architecture of a Course Creator
To demonstrate the defense mode principles concretely, we'll analyze a Course Creator System. This isn't a single all-in-one agent, or a monolithic prompt trying to do everything: it's a distributed multi-agent system that's composed of multiple specialized agents. This architecture follows the principle of separation of concerns.
The system is built on Cloud Run for serverless scalability and it uses the Agent2Agent (A2A) Protocol for standardized inter-agent communication.
The Agent Roster
Each agent does its specific piece of work. The researcher collects information, the judge evaluates the collected data, the content builder composes it into a well-structured course, and the orchestrator controls this mighty team!
1. The Researcher (The Hunter)
-
Role: Information retrieval.
-
Tools: Custom
wikipedia_search. -
Personality: Objective, fact-focused.
-
Input: A query string (e.g., "history of neural networks").
-
Output: Text of the most relevant Wikipedia page.
Wikipedia Search Tool:
2. The Judge (The Critic)
-
Role: Quality assurance.
-
Tools: None.
-
Personality: Strict, pedantic.
-
Mechanism: It uses structured output (Pydantic objects) to return a formal verification result.
Why is the judge a separate agent? An agent detecting its own hallucinations is notoriously unreliable. A separate judge agent provides a necessary adversarial check.
3. The Content Builder (The Writer)
-
Role: Synthesis and formatting.
-
Tools: None.
-
Personality: Creative, educational.
-
Responsibility: It takes the raw, verified facts from the researcher and it structures them into a cohesive course module, such as "Introduction", "Chapter 1", etc.
4. The Orchestrator (The Manager)
-
Role: Workflow management.
-
Mechanism: It implements a
SequentialAgent. -
Logic:
-
Call the research loop:
-
Ask the researcher to gather data.
-
Ask the judge to evaluate data.
-
If judge says "Fail": Send feedback to the researcher (restart the loop).
-
If the judge says "Pass": Break the loop and continue to the next step.
-
Call the content builder to build the comprehensive course content.
Why is the orchestrator a separate agent? Using a separate orchestrator agent isolates the control flow logic from the generation logic.
The Course-Building Multi-Agent System
The architecture of the multi-agent system is set up like this:
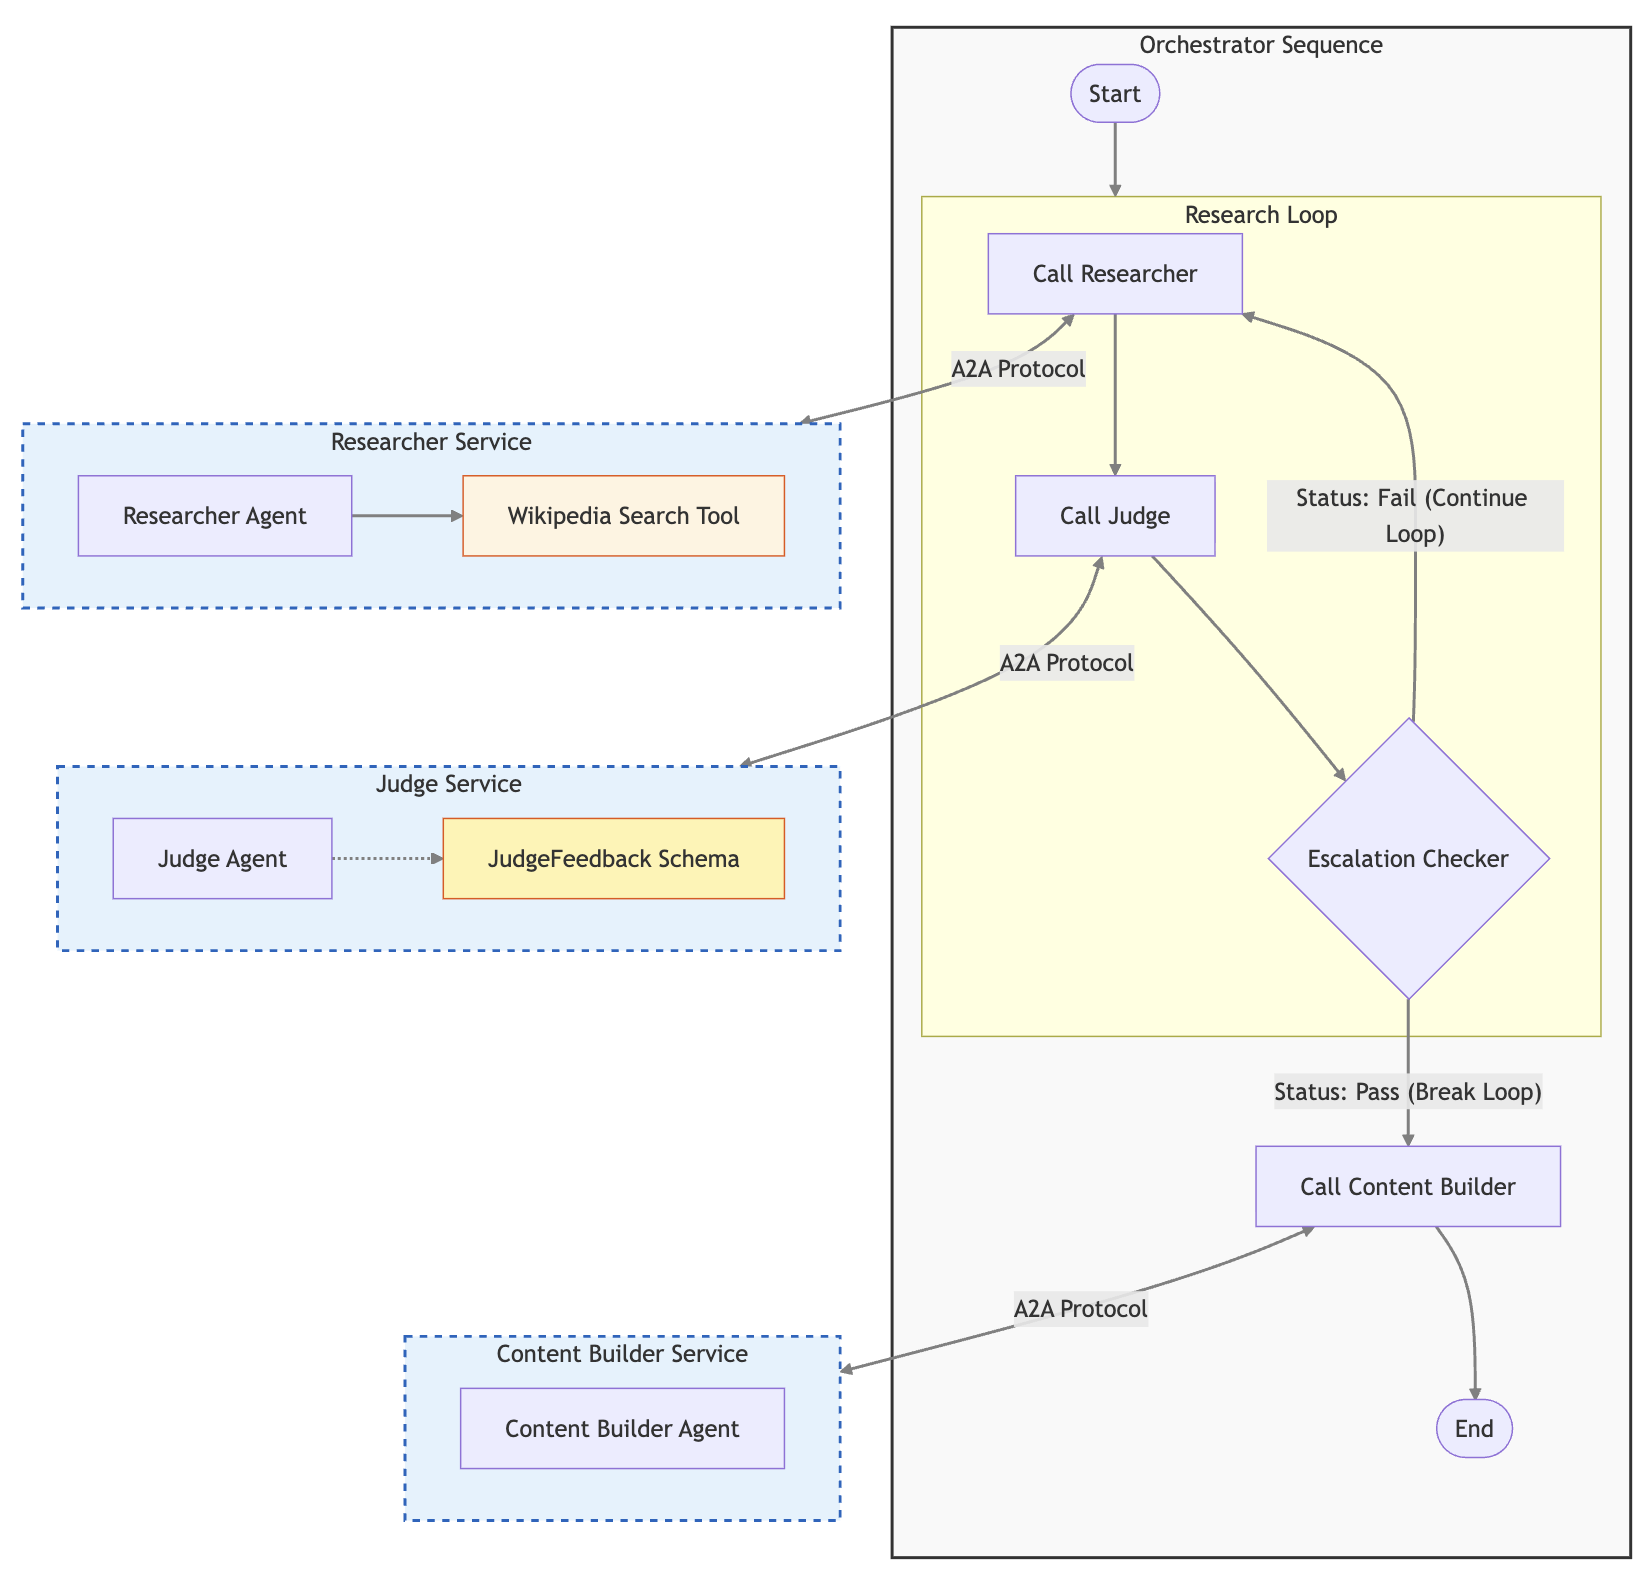
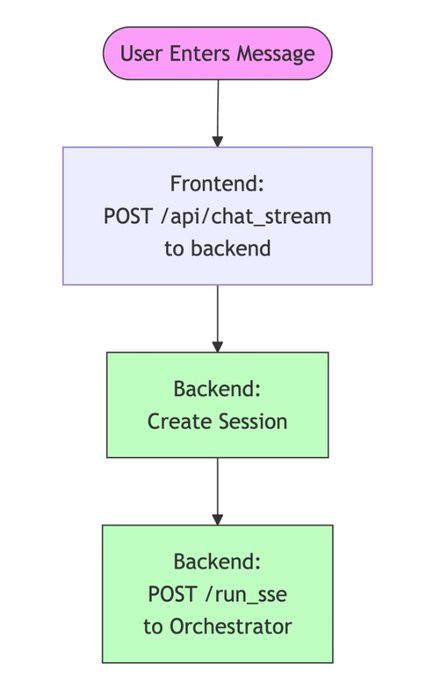
This multi-agent system has a nice web app (in the app folder of the repository). A little service exposes a frontend and calls the orchestrator agent service by using our ADK FastAPI integration. The user request flow looks like this:
The A2A Protocol Benefits
The Agent2Agent (A2A) Protocol standardizes how these agents communicate with each other. Instead of wrapping the researcher as a function call or a generic tool within the orchestrator's prompt (which limits its capabilities), A2A lets the orchestrator interact with the researcher as a full peer service.
This protocol solves the "N × N" integration problem. All agents speak the same language (HTTP + JSON schemas), making the system modular and easy to extend. If we want to replace the researcher with a different implementation, the orchestrator doesn't need to change a single line of code.
This modularity is also the key to our evaluation strategy. Because the agents are loosely coupled services, we don't have to evaluate the entire system at once. Instead, we can target individual components.
Shared Architecture Components
To make this distributed system reliable and observable, we use a set of shared utility components across all of our agents:
-
shared/adk_app.py: This is the backbone of every agent service. It builds on top of ADK and FastAPI. It automatically configures these components: -
A2A middleware: Handles the exchange of agent cards or self-description, dynamically rewriting URLs to match the current deployment. A2A middleware is useful for shadow revisions, where you deploy a new version of your agent to handle simulated traffic from an evaluation pipeline.
-
OpenTelemetry middleware: Automatically captures every incoming request as a Trace Span.
-
shared/traced_authenticated_httpx.py: A hardened HTTP client for inter-agent communication. -
Authentication: Handles the complexities of Google Cloud service-to-service authentication (OIDC tokens), ensuring zero-trust security between agents.
-
Trace propagation: Injects the
traceparentheader into every outgoing request. The header context lets Cloud Trace stitch together the graph that shows how the orchestrator called the researcher. We'll discuss that more later, when we take a look at distributed tracing. -
shared/a2a_utils.py: Provides the logic for dynamic agent cards. In Cloud Run, a service might be accessed through a public URL or through a revision-specific URL. This utility ensures that the agent always tells its peers the correct address to call back.
3. The Evaluation Taxonomy: A Deep Dive
Before we write code, we must define our units of measurement. "Is this agent good?" isn't a valid engineering question. We need to define "good" as testable dimensions. To do that, we can categorize evaluation metrics into a hierarchy of sophistication.
Level 1: Computation-Based Metrics
These are deterministic checks against a ground truth or rigid rules. They're the closest to traditional software unit and integration tests.
-
Classic NLP metrics like ROUGE and BLEU: Is the result sufficiently similar to the reference answer?
-
JSON validity: If your agent must output JSON, does it parse?
-
Prohibited phrases: Does the output contain "I am an AI language model"?
-
Exact match or Regex: For extraction tasks (e.g., getting a date
YYYY-MM-DD), does the output match the pattern? -
Execution trajectory (including agent tool trajectory): Did the agent call certain tools in a particular order with specific parameters?
Reference-based or Reference-free metrics
Some metrics require a ground truth reference answer to compare the result to. ROUGE and BLEU are perfect examples of that. Other metrics might evaluate the result on different criteria, such as output format ("Did the agent produce correct JSON?") or prohibited words—they don't need a ground truth answer for comparison.
Level 2: Rubric-Based Metrics
This is the standard for semantic evaluation. We use a powerful LLM-as-a-judge model (like Gemini Pro) to grade the agent's output. To evaluate agent answers, these metrics use sophisticated battle-tested and rigorously maintained prompts.
These are the core concepts that are related to LLM-based evaluation metrics:
-
Rubrics: The criteria for how to rate the response of an LLM model or application. Basically, it's a composite prompt that can be pre-defined or dynamically generated.
-
Metrics: A score that measures the model output against the rating rubrics.
Rubric-based metrics incorporate LLMs into these kinds of evaluation workflows:
-
Adaptive rubrics: Rubrics are dynamically generated for each prompt. Responses are evaluated with granular, explainable pass or fail feedback that's specific to the prompt.
-
Static rubrics: Rubrics are defined explicitly and the same rubric applies to all prompts. Responses are evaluated with the same set of numerical scoring-based evaluators, with a single numerical score (such as 1 to 5) per prompt. Static rubrics are used when the exact same criteria is required across all prompts (e.g., "Check whether the agent answered the user's question").
Just like with computation-based metrics, rubric-based metrics might or might not require a ground truth reference. It's critical to choose the right one for your task.
A. Reference-Free Metrics
You don't have a specific correct answer, but you rely on general principles of quality. Use this approach for open-ended generation like emails, poems, or generic advice. Examples of reference-free metrics include these:
-
Response quality: A comprehensive and adaptive rubrics metric that evaluates the overall quality of an agent's response as follows:
-
It automatically generates a broad range of criteria based on the agent configuration (developer instruction and declarations for tools that are available to the agent) and the user's prompt.
-
Then it assesses the generated criteria based on tool usage in intermediate events and the final answer by the agent.
-
Coherence: Evaluates whether the text is logical and grammatically correct.
-
Safety: Evaluates whether the text violates safety policies, such as by inclusion of hate speech or personally identifiable information (PII).
-
Instruction-following: A targeted and adaptive rubrics metric that measures how well the response adheres to the specific constraints and instructions that are given in the prompt.
B. Reference-Based Metrics
You have a golden answer and you want to ensure that the agent's response creates the same meaning, even if it's phrased differently. If the reference is "Paris" and the agent says "Capital of France, which is Paris", a regex might fail, but an LLM judge will pass it. A reference-based metric checks for a response match to determine whether the answer matches the reference response or ground truth.
Level 3: Vertex AI Managed Metrics
Google's Vertex AI Gen AI evaluation service provides pre-built, calibrated models called autoraters for these dimensions. Autoraters are superior to creating your own judge prompt because they're benchmarked against human raters and they're maintained by Google. These are a few examples of autoraters:
-
GROUNDING: The most critical metric for RAG. It takescontext+responseand checks whether the response is fully supported by the context. It assigns a score from 0 to 1. -
SAFETY: Automatically flags hate speech, harassment, and dangerous content. -
TOOL_USE_QUALITY: Specifically tailored for agents to evaluate whether the agent made an appropriate tool call and whether the argument was correct. This metric doesn't require comparison to a tool call reference that's considered correct. Instead, the evaluator makes a judgment based on the tool description, the agent description, and the context of the conversation.
For more information, see the complete list of managed rubric-based metrics in Vertex AI.
Static and Adaptive Rubrics
Static rubrics like "Rate helpfulness 1-5" suffer from high variance. Adaptive rubrics solve that issue by dynamically generating a test case for each prompt.
-
Rubric generation: The system analyzes the user prompt and reference.
-
Prompt: "Compare the battery life of Pixel 9 and iPhone 16."
-
System generates criteria:
-
Criteria 1: Mentions Pixel 9 mAh?
-
Criteria 2: Mentions iPhone 16 video playback hours?
-
Criteria 3: Is neutral?
-
Rubric grading: The judge checks these boolean conditions.
This turns a subjective vibe check into an objective report card that explains exactly what was missing.
Gen AI evaluation service provides a comprehensive set of metrics that are based on static and adaptive rubrics. You can also create your own adaptive rubrics by using the GenAI Client in Vertex AI SDK.
4. The Fuel: Designing Your Evaluation Dataset
Garbage in, garbage out. Your evaluation is only as good as your dataset. A proper evaluation dataset is a collection of examples (rows). In our system, we use a JSON-based format where columns represent different inputs and expected outputs.
The following is an actual example from our evaluator/eval_data_researcher.json dataset. It's structured as columns for efficient pandas loading:
Components of the Dataset
-
prompt: The input to the agent.
-
Example: "What is the return policy for item #123?"
-
reference (optional): The ideal answer (for reference-based metrics).
-
Example: "Item #123 can be returned within 30 days."
-
reference_trajectory (optional): The simple gold standard for tool usage.
-
This option lets us verify whether our agent is thinking correctly. If the prompt asks for "Population of Tokyo" and the trajectory shows a call to
get_weather("Tokyo"), the agent has failed fundamentally, even if it hallucinates the correct population number.
Best practice: Store this dataset in BigQuery or in a JSON file in Cloud Storage. Treat it like source code. Version it.
Just before we call the agent with these inputs, we'll add one more column with the same value for every input prompt: session_inputs, a simple structure with evaluation user ID, agent name, and an empty state dictionary.
5. The Implementation: Building the Evaluation Engine
When we have a dataset and metrics, we need an engine to drive the tests. A simple Python script isn't enough; we need to replicate the scale of production. To accomplish that, we build an evaluation runner (evaluate_agent.py) that uses the GenAI Client in Vertex AI SDK.
A. Parallel Inference
Agent operations are slow relative to typical API calls. A multi-step reasoning task might take 15 seconds. If our golden dataset has 500 examples, running them sequentially would take 2 hours. We use Python's asyncio to run many concurrent requests against a shadow revision.
This approach reveals another benefit of evaluating agents that are deployed to Cloud Run: unlike your developer machine, it can scale to serve parallel requests. Faster evaluation enables faster iterations.
In the shared/evaluation/evaluate.py module, we implement a throttled parallel runner:
_run_inference calls the ADK server API endpoint POST /run_sse of the target agent. This call initiates a streaming session where the agent pushes events while it thinks. The events are captured and processed to store the final answer and a list of the intermediate events—the reasoning trace.
B. Reasoning Trace Capture
If the agent fails, why did it fail? In standard evaluation, you only see the final answer. In agentic evaluation, we need the reasoning trace or execution history. It includes a list of events that occurred during the agent's execution. Each event has a type and a payload. The payload contains the event's content and metadata. The most interesting events are the tool calls. They include tool call requests from the LLM (with parameter values), and tool call responses from the tools (with return values).
We pass this entire trace to the Gen AI evaluation service. This allows for questions like: "Did the agent hallucinate the number 14 million, or did the tool actually return it?"
We also use this trace for tool trajectory evaluation, which we describe later in this post.
C. Final Evaluation Dataset
After we run the agent for every prompt, we add two more columns to the evaluation dataset. We already have prompt, reference (optional ground truth answer), reference_trajectory (optional ground truth for tool calls and their parameters), and session_inputs. After inference, we add these columns:
-
response: The actual final response of the agent. -
intermediate_events: All events that preceded the final response, including tool calls.
D. Runtime Schema Integration
To verify whether the agent used tools correctly, the evaluation scorer can leverage the tool definition. If we hardcode this definition in our test suite, it will drift from the actual code. Instead, we expose an /agent-info endpoint on every agent, and the evaluator fetches it at runtime.
This implementation ensures that if you add a new tool parameter in your code, the evaluation automatically knows about it without manual updates to the test suite.
6. Custom Function Metrics Deep Dive: Tool Trajectory Evaluation
For many agents, tool usage isn't an option, but is a mandatory part of their flow. Evaluating general tool usage quality isn't enough. You need to have strictly defined business rules.
-
Rule 1: "Wikipedia tool must always be called."
-
Rule 2: "It must be called with the correct search request."
We can enforce these by using custom metrics in Gen AI evaluation service. We write a Python function, and the service executes it in a secure sandbox against every row of our evaluation.
Implementing Tool Trajectory Metrics
In our shared/evaluation/tool_metrics.py module, we implemented multiple custom metrics for tool trajectory evaluation.
-
Trajectory precision: The agent called 5 tools. 3 were useful, 2 were noise. Precision = 3/5.
-
Trajectory recall: The task required checking Database and Wiki. The agent only checked Wiki. Recall = 0.5.
-
Exact order match: The agent called the right tools in the specified order, without calling any other tools.
-
In-order match: The agent called the right tools in the specified order, even if other tools were called in between.
-
Any-order match: The agent called the right tools in any order.
The core logic relies on comparing the predicted trajectory (what the agent did) against the reference trajectory (what we wanted it to do).
1. The Reference (From Dataset)
The reference_trajectory looks like a clean list of expected calls:
2. The Event Trace (From Agent)
We use captured intermediate_events to extract the actual function calls so that we can compare them to the reference trajectory.
The helper function _get_tool_calls extracts the list from the trace and compares it to the reference.
Executing Custom Function Metrics in Vertex AI
These custom metrics require running Python code. Where does the code run? Aren't we using Vertex AI for the evaluation?
Yes, Gen AI evaluation service takes care of running that code. The service expects Python code with an evaluate function:
Our functions have other functions that they depend on, so we package the module's source code with them and we construct an extra evaluate function to make a call.
We package these functions using CustomCodeExecutionSpec and send them to Vertex AI for sandboxed execution. This approach lets us combine the flexibility of custom Python code with the massive scale of managed evaluation.
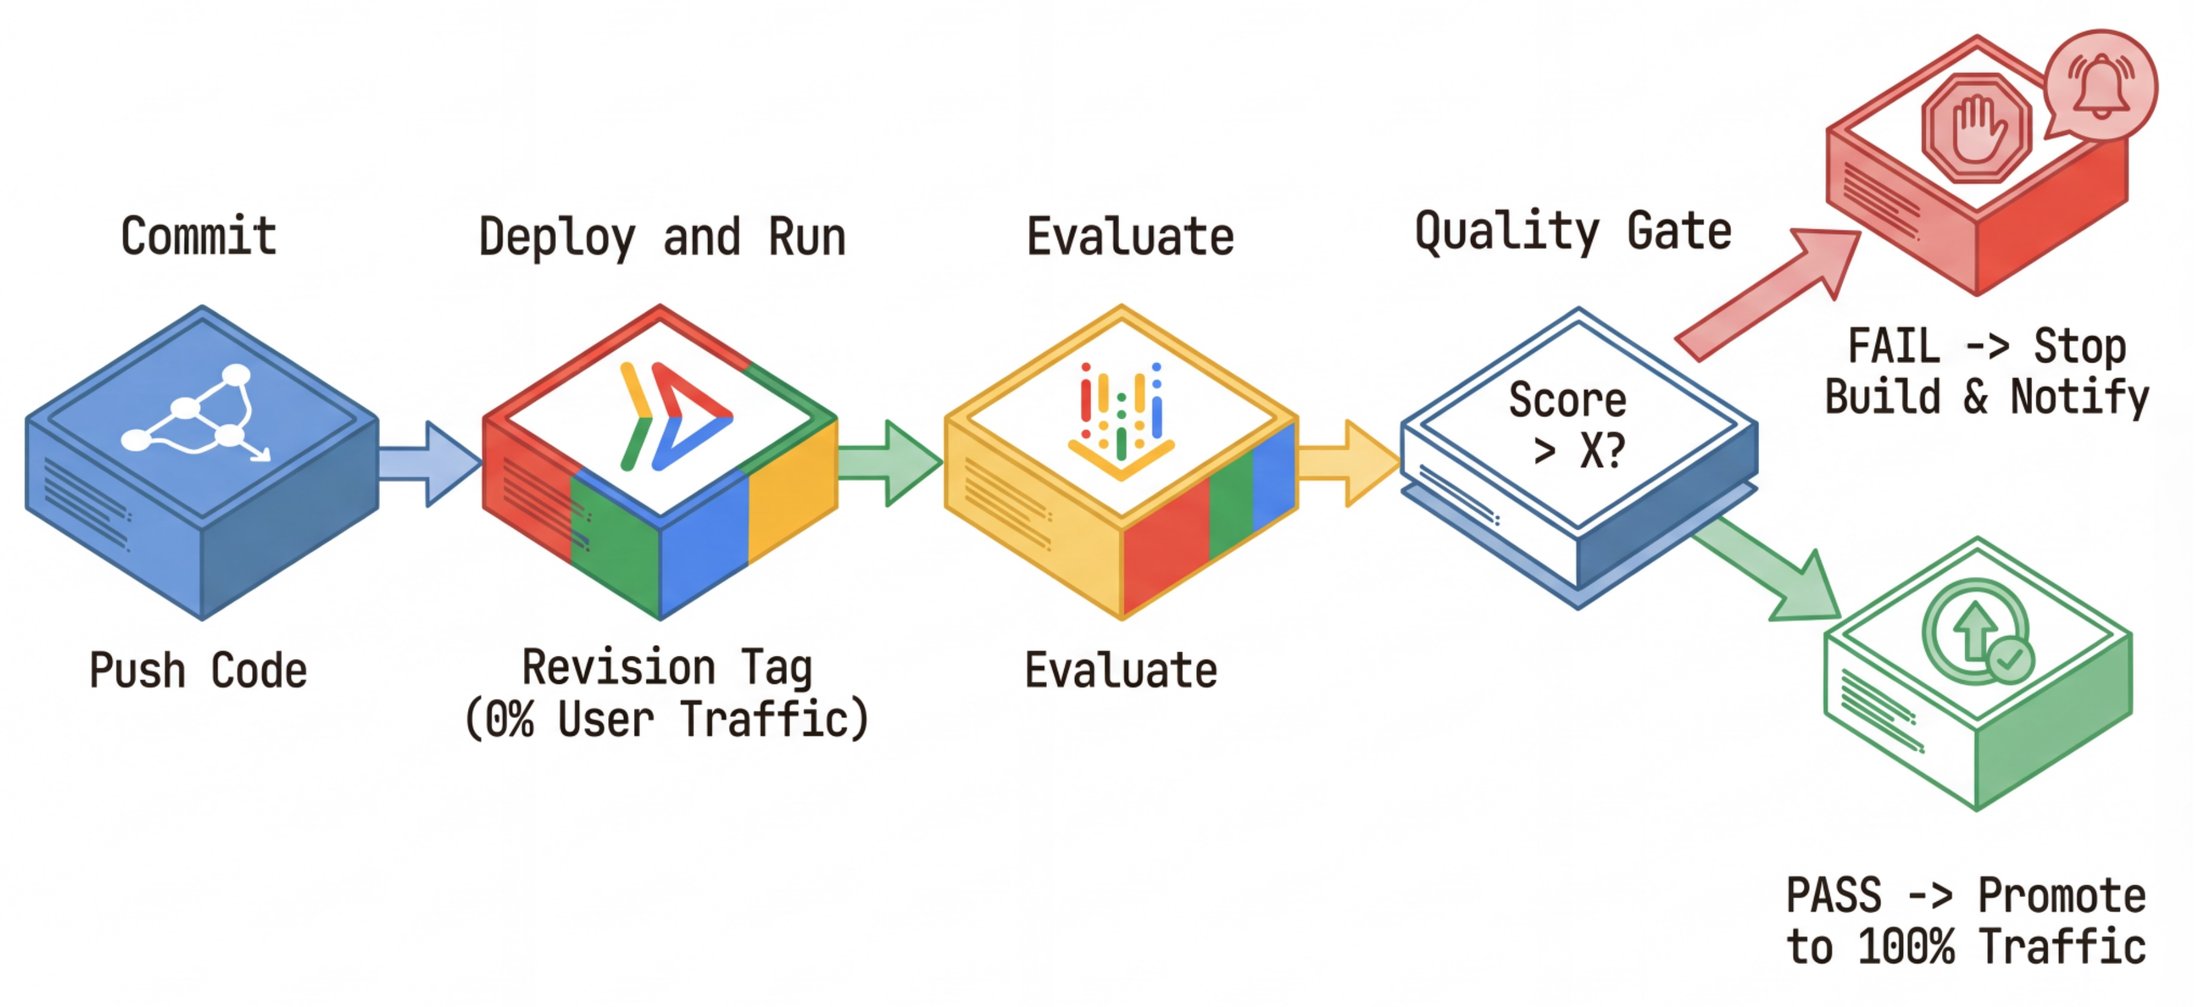
7. Strategy: Shadow Deployments & Safe Rollouts
The most common fear in deploying AI agents is: "If I change the prompt, will it break for 10% of users?" This fear can paralyze teams. To solve this issue, we borrow a technique from standard microservice engineering: shadow deployments or dark canaries.
The Concept
Instead of replacing the live version of your agent, you deploy a new version alongside it.
-
Live revision: Serves 100% of user traffic.
-
Shadow revision: Serves 0% of user traffic but handles simulated traffic from your evaluation pipeline.
This decoupling of deployment (code on server) from release (users see code) lets you test in the exact production environment—same network, same secrets, same latency characteristics—without risk.
Cloud Run Implementation
Cloud Run makes implementation trivial. Every deployment creates a revision. We can assign a tag to a revision to give it a unique URL. We use the Git commit short SHA hash as the tag (e.g., sha-a1b2c3d). This tag creates an immutable link between your source code and your running service.
In our deploy.sh, we use the following logic to deploy a shadow revision:
Result:
-
Public URL:
https://researcher-xyz.run.app(unchanged, safe). -
Shadow URL:
https://sha-a1b2c3d---researcher-xyz.run.app(new, testing ground). Three dashes---separate the revision part.
When a user hits the service public URL, Cloud Run distributes traffic between revisions that are configured as serving the traffic. This new shadow revision doesn't serve any requests unless it's called with a revision-specific shadow URL. You can view and manage revisions in the Google Cloud console.
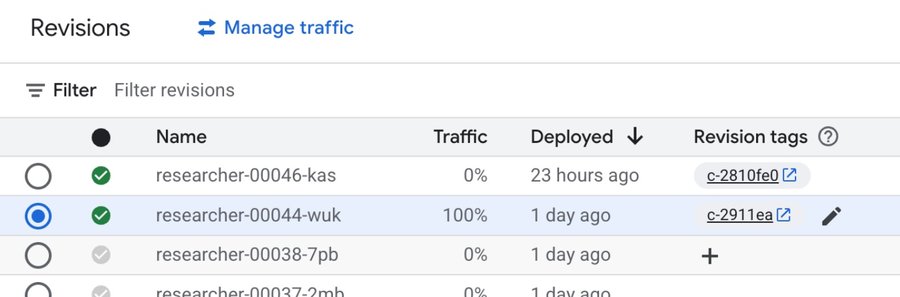
Your continuous evaluation pipeline then targets this shadow URL. If the shadow revision metrics pass, we can run a promotion command that makes the successful revision serve the traffic:
It doesn't have to always be 100% to a single revision. No matter how much we test and evaluate our code, mistakes happen. Instead of switching all at once, you might want to gradually migrate traffic between revisions.
8. Analyzing Evaluation Results
When the pipeline breaks, developers don't dig through text logs. Using the Run ID from the build log, they can pull the full report.
Acting on Evaluation Results
If the evaluation fails, the build fails. The build fails the pipeline. The pipeline fails the commit. The commit fails the PR. The PR fails the merge. The merge fails the release. The release fails the deployment. The users don't use the failed code.
Now, how can we understand why it failed? Let's take a closer look at an example of the evaluation run.
The request was History of Rome. The researcher provided the content of the Wikipedia page History of Rome. The content seemed good to the judge, but the final hallucination metric was too low.
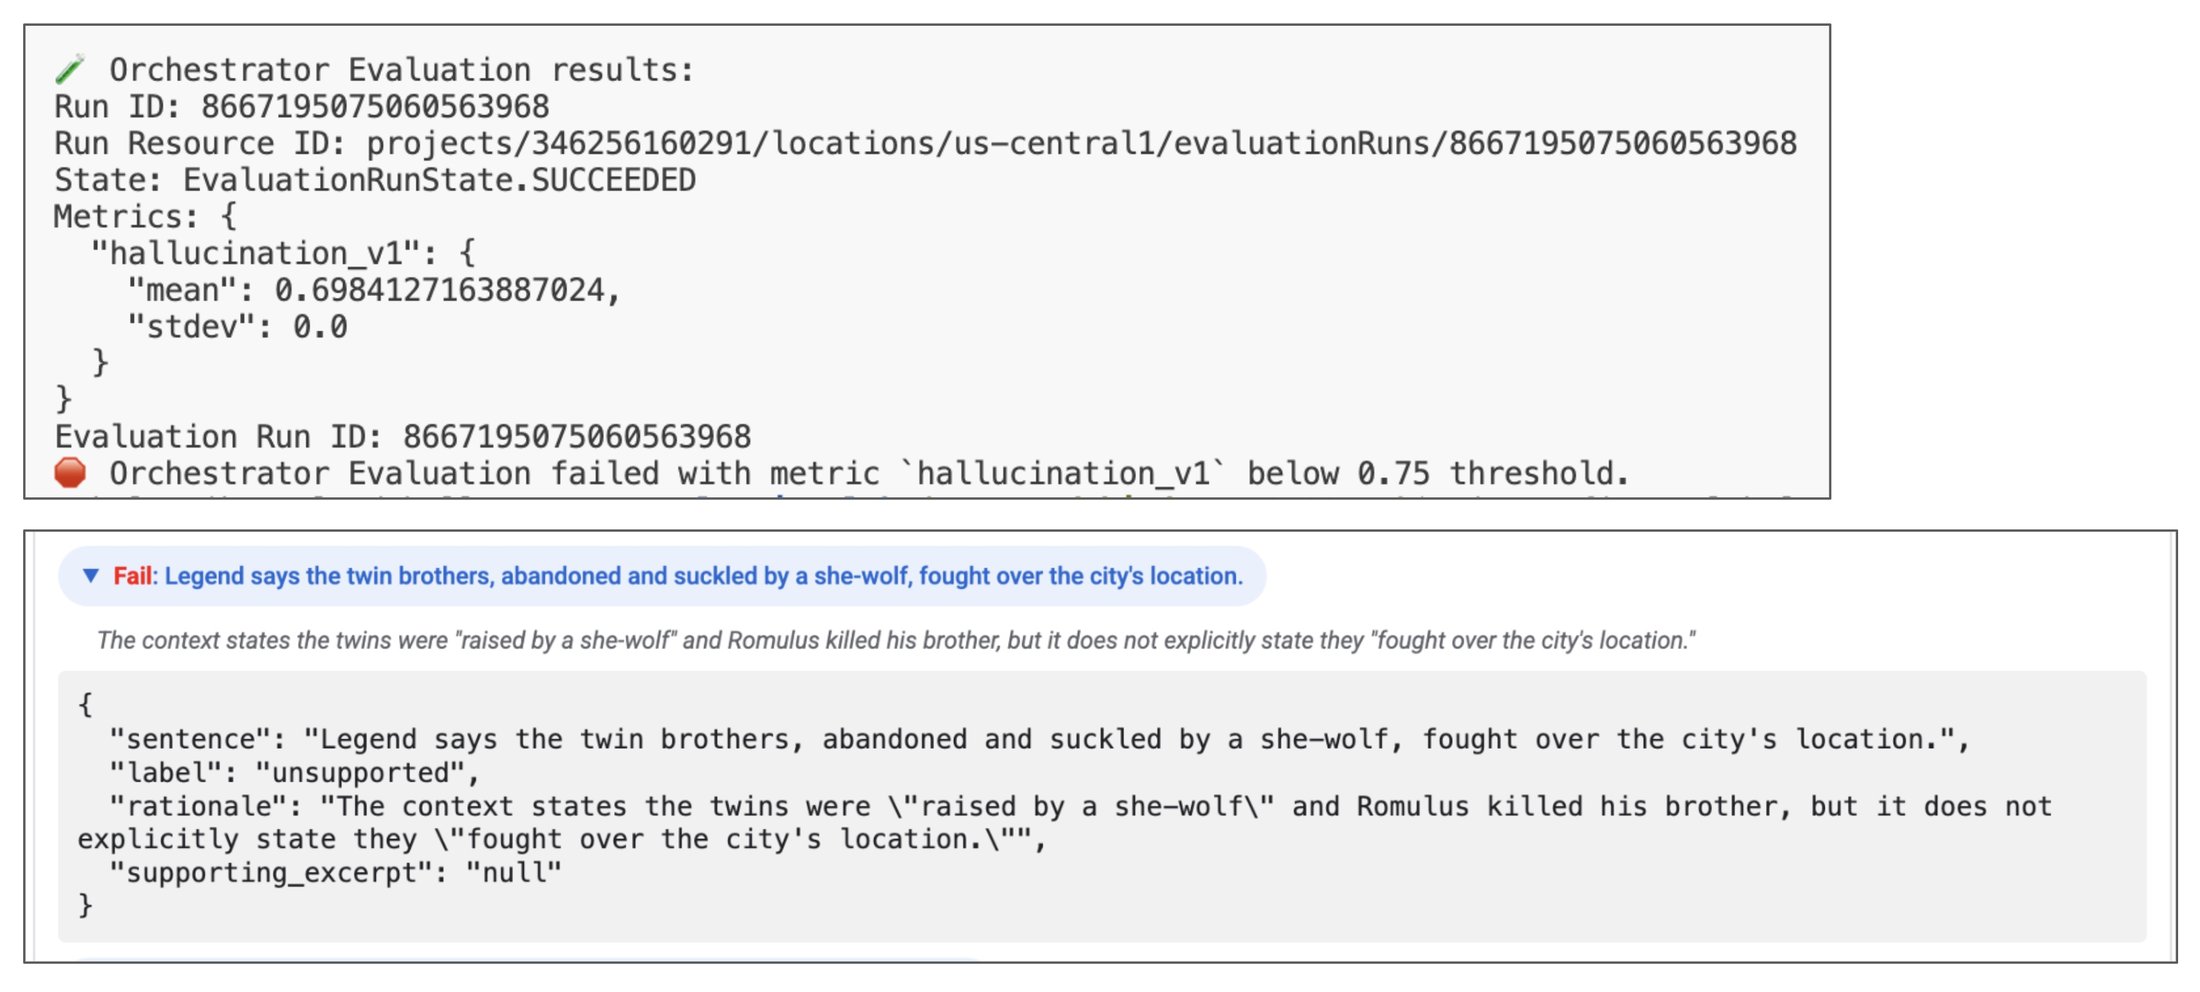
The reason is because the final course that was built by the content builder contained facts that weren't present in the Wikipedia page. By looking at the reasoning trace, we can see that the researcher used the Wikipedia page as a source of information.
However, the content builder was too creative about the course content. The content builder used a Gemini model that certainly knows a lot about Rome, so it enhanced the course with facts that weren't present in the Wikipedia page.
How do we fix that? Let's tell the content builder to stick to the facts that are provided by the researcher.
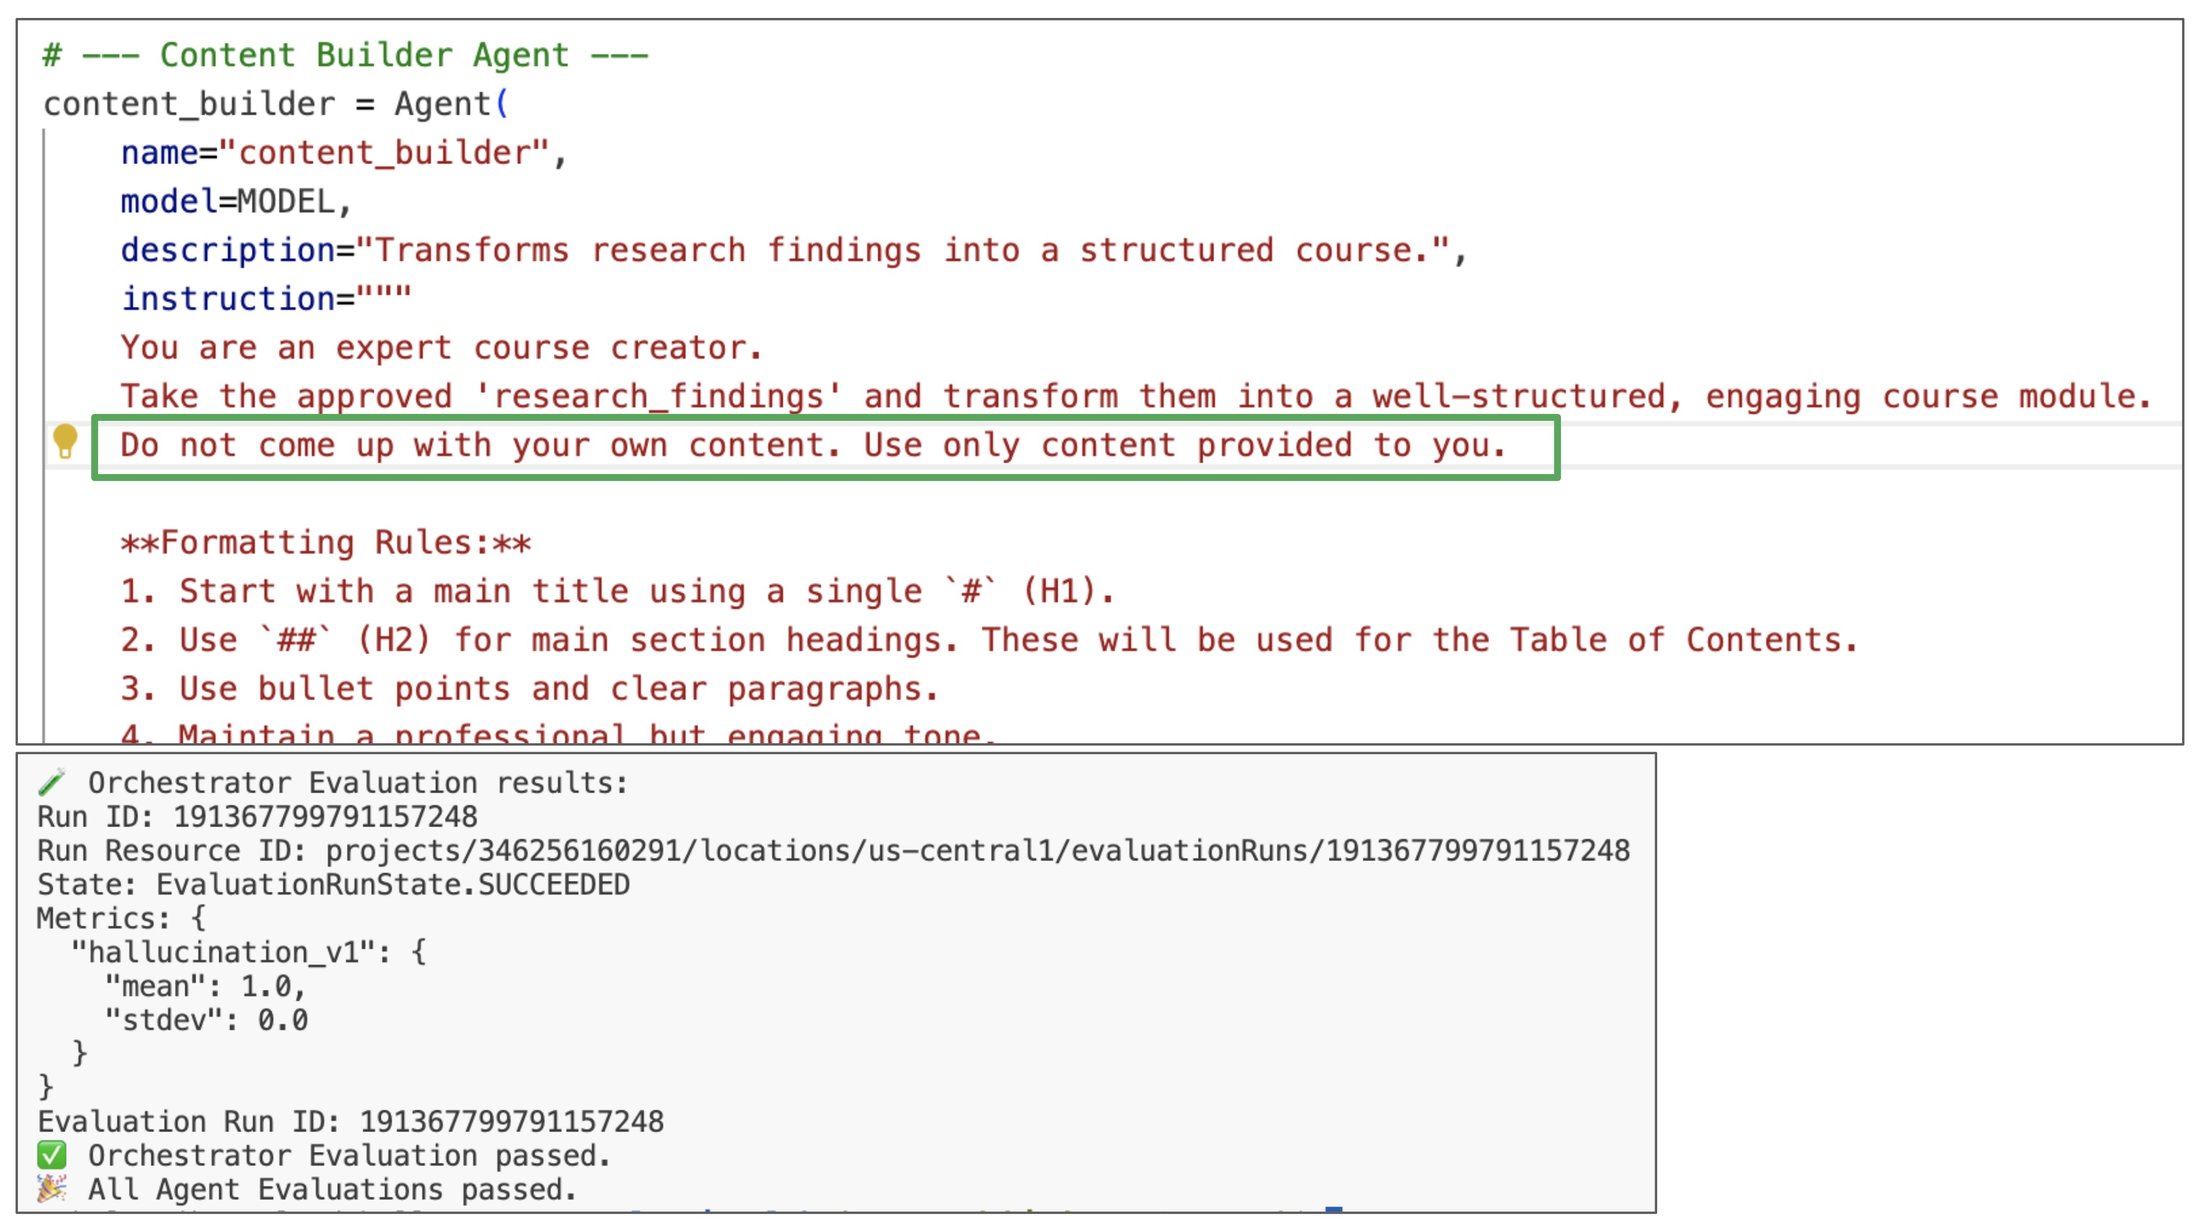
And voilà! The very next run produced a perfect evaluation score.
What's important is that the rest of the metrics are still good. We found a problem and we made changes to fix it, but the whole system stayed intact.
9. Automating the Loop: The CI/CD Pipeline
Finally, we operationalize this solution by using Cloud Build. The goal is a quality firewall that helps makes sure that bad code can't physically reach production users. Our .cloudbuild/cloudbuild.yaml orchestrates the lifecycle:
-
Build:
-
Docker builds the
researcherimage. -
Push to Artifact Registry.
-
Deploy shadow:
-
gcloud run deploy ... --tag=sha-${COMMIT_SHA} --no-traffic -
Evaluate:
-
Run
python -m evaluator.evaluate_agent. -
The script targets the shadow URL.
-
It uploads results to Vertex AI.
-
The gate: It checks
if metric_score < THRESHOLD. Iftrue, it exits with error code 1, failing the build. -
Promote (only runs if evaluate passes):
-
gcloud run services update-traffic ... --to-tags sha-${COMMIT_SHA}=100
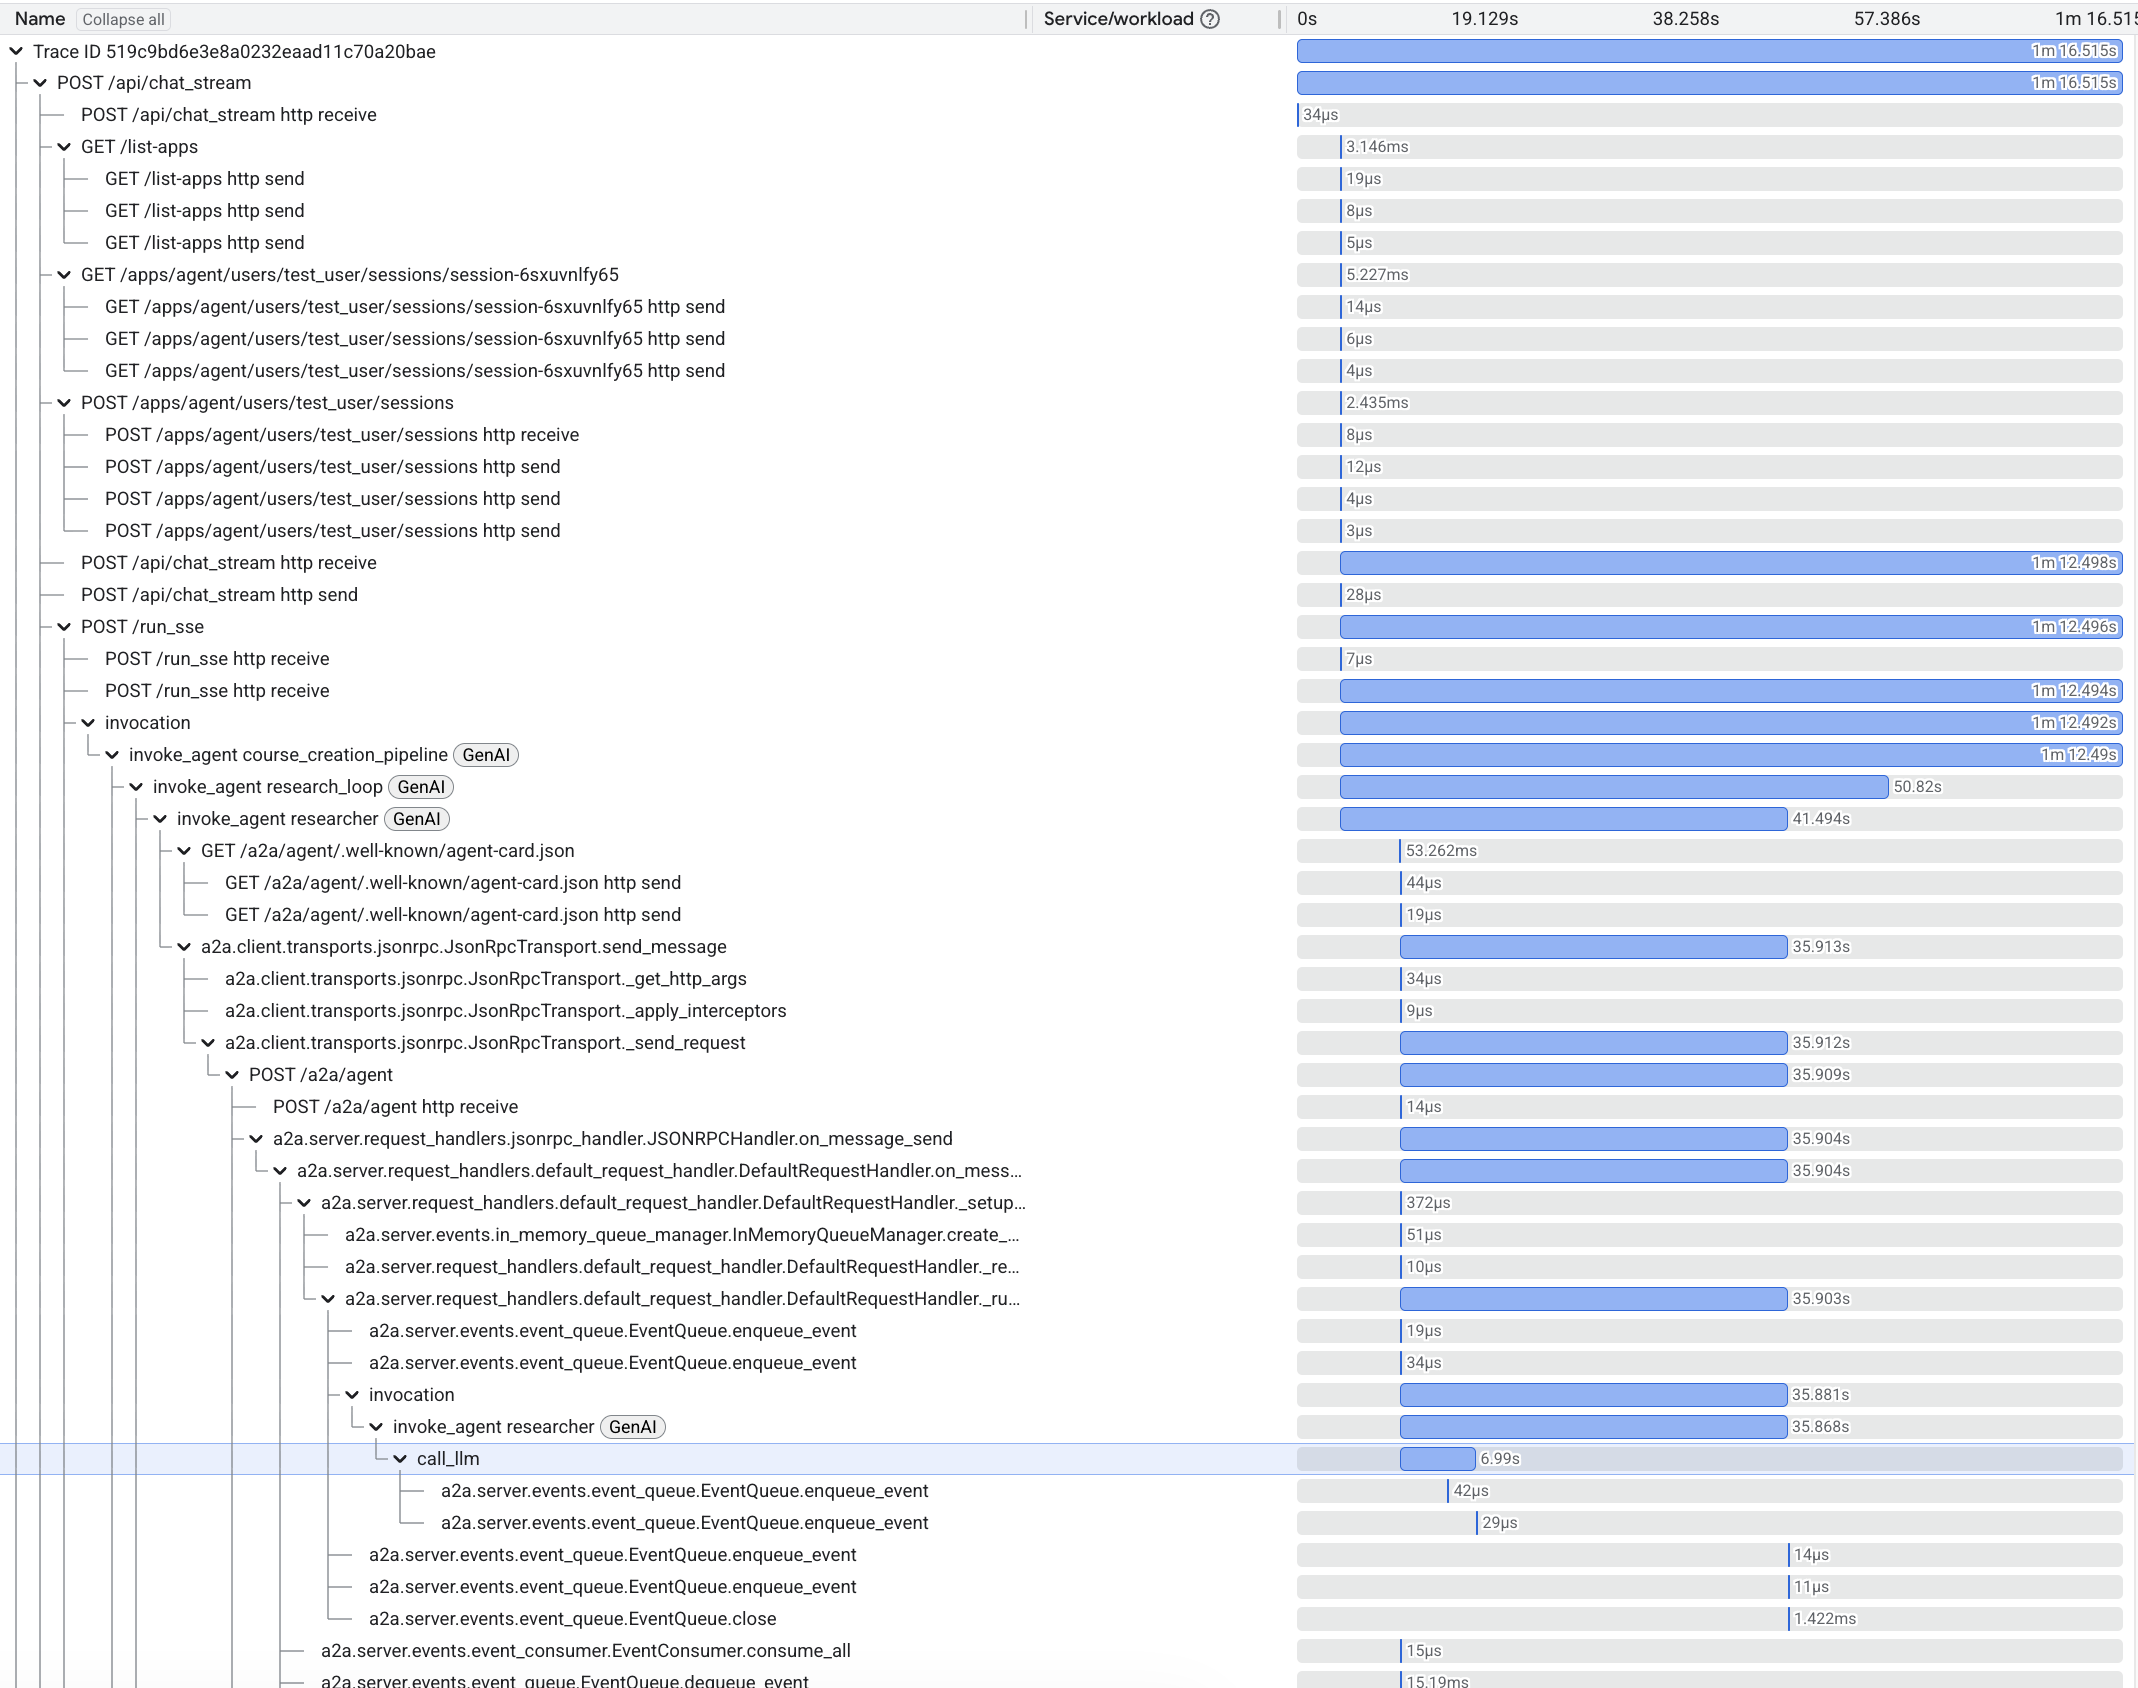
10. Distributed Tracing with OpenTelemetry
Debugging a single monolithic LLM call might be easy. Debugging a distributed system of multiple agents, each making its own LLM calls and tool executions, is exponentially harder. If the orchestrator gives a wrong answer, was it bad logic in the orchestrator? Did the researcher return bad data? Or did a network timeout cause a fallback? To answer these questions, logging isn't enough. We need distributed tracing.
We use OpenTelemetry (OTel) to instrument every part of the stack, capturing the entire lifecycle of a request as a Trace graph.
The Waterfall View in Cloud Trace
By integrating with Cloud Trace, we get a visual waterfall of every operation.
-
Root span: The initial request to the web app's backend and to the orchestrator.
-
Child spans: Cross-service A2A requests to other agents, LLM invocations, and tool executions.
The Trace graph lets us see the system's physical execution alongside the logical reasoning.
Enabling End-to-End Tracing with Shared Components
ADK comes with built-in OpenTelemetry support. However, to get a truly unified view across our microservices, we enhanced it with our shared components:
-
shared/adk_app.py:
-
Wraps the standard ADK
FastAPIapp. -
Adds
OpenTelemetryMiddlewareto automatically start a trace span for every incoming HTTP request. -
Correctly extracts the
traceparentcontext from incoming headers, connecting this agent's work to the caller's trace. -
shared/traced_authenticated_httpx.py:
-
When an agent calls another agent (e.g., orchestrator -> researcher), we must propagate the trace ID.
-
This custom client injects the OTel
traceparentheader into outgoing requests.
System Traces vs. Reasoning Traces
It's crucial to distinguish between the two types of traces that we discuss in this post:
Reasoning traces give you visibility into the cognitive process of your agent, while system traces show how API requests flow through your system.
Debugging Non-Deterministic Systems
The combination of these types of traces is your superpower. When an evaluation fails (e.g., "grounding score < 0.5"), you look at the reasoning trace to see what the model thought. If the reasoning looks correct but the result is wrong (e.g., a tool error), you switch to the OpenTelemetry trace in Cloud Trace. You might find that the wikipedia_search timed out after 5000ms, causing the model to hallucinate an answer because it lacked data.
Without this x-ray vision insight into both the cognitive and physical layers of your system, you're debugging in the dark.
Conclusion
Stop messing with the vibe checks. Instead, use the power of evaluated intelligence. Building reliable AI agents requires a shift in mindset from discovery to defense. By implementing continuous evaluation (CE), we treat agentic systems with the rigor that they deserve.
This post explores concepts from the codelab From "vibe checks" to data-driven Agent Evaluation. To run the code yourself, check out the codelab.
Resources and Links
-
Cloud Run runs and scales your AI agents, isolates failure domains, and enables zero-risk shadow deployments.
-
Vertex AI Evaluation provides the managed metrics, the adaptive rubrics, and the compute scaling to run them without managing infrastructure.
-
Cloud Build for CI/CD creates a quality firewall, which helps guarantee that no regression goes unnoticed.
-
Cloud Trace provides the ability to capture and visualize the entire request lifecycle, from the initial HTTP request through a cascade of cross-services calls, sub-agent invocations, and LLM calls, to the final response.