Debugging cloud spanner latency using OpenCensus and Go client library
Tomoaki Fujii
Technical Solutions Engineer
Debugging cloud spanner latency using OpenCensus and Go client library
You may have faced a situation where your client reported high latency while your Cloud Spanner metrics didn't show the corresponding latency. This article describes a case study of increased client side latency caused by session pool exhaustion and how you can diagnose the situation by using OpenCensus features and Cloud Spanner client library for Go.
Case study
Here's the overview of the experiment.
Go Client library version: 1.33.0
SessionPoolConfig: {MaxOpened: 100, MinOpened: 40, MaxIdle: 20, WriteSessions: 0.20}
By using the session pool, multiple read/write agents perform transactions in parallel from a GCE VM in us-west2 to a Cloud Spanner DB in us-central1. Generally, you are recommended to keep your clients closer to your Cloud Spanner DB for better performance. In this case study, a distant client machine is deliberately used so that the network latency is more distinguishable and sessions are used for a decent amount of time without overloading the client and servers.
As a preparation for the experiment, this sample leaderboard schema was used. As opposed to using random PlayerId between 1000000000 and 9000000000 in the sample code, sequential ids from 1 to 1000 were used as PlayerId in this experiment. When an agent ran a transaction, a random id between 1 and 1000 was chosen.
Read agent:
(1) Randomly read a single row, do an iteration, and end the read-only transaction.
"SELECT * FROM Players p JOIN Scores s ON p.PlayerId = s.PlayerId WHERE p.PlayerId=@Id ORDER BY s.Score DESC LIMIT 10"(2) Sleep 100 ms.
Write agent:
(1) Insert a row and end the read-write transaction.
"INSERT INTO Scores(PlayerId, Score, Timestamp) VALUES (@playerID, @score, @timestamp)"(2) Sleep 100 ms.
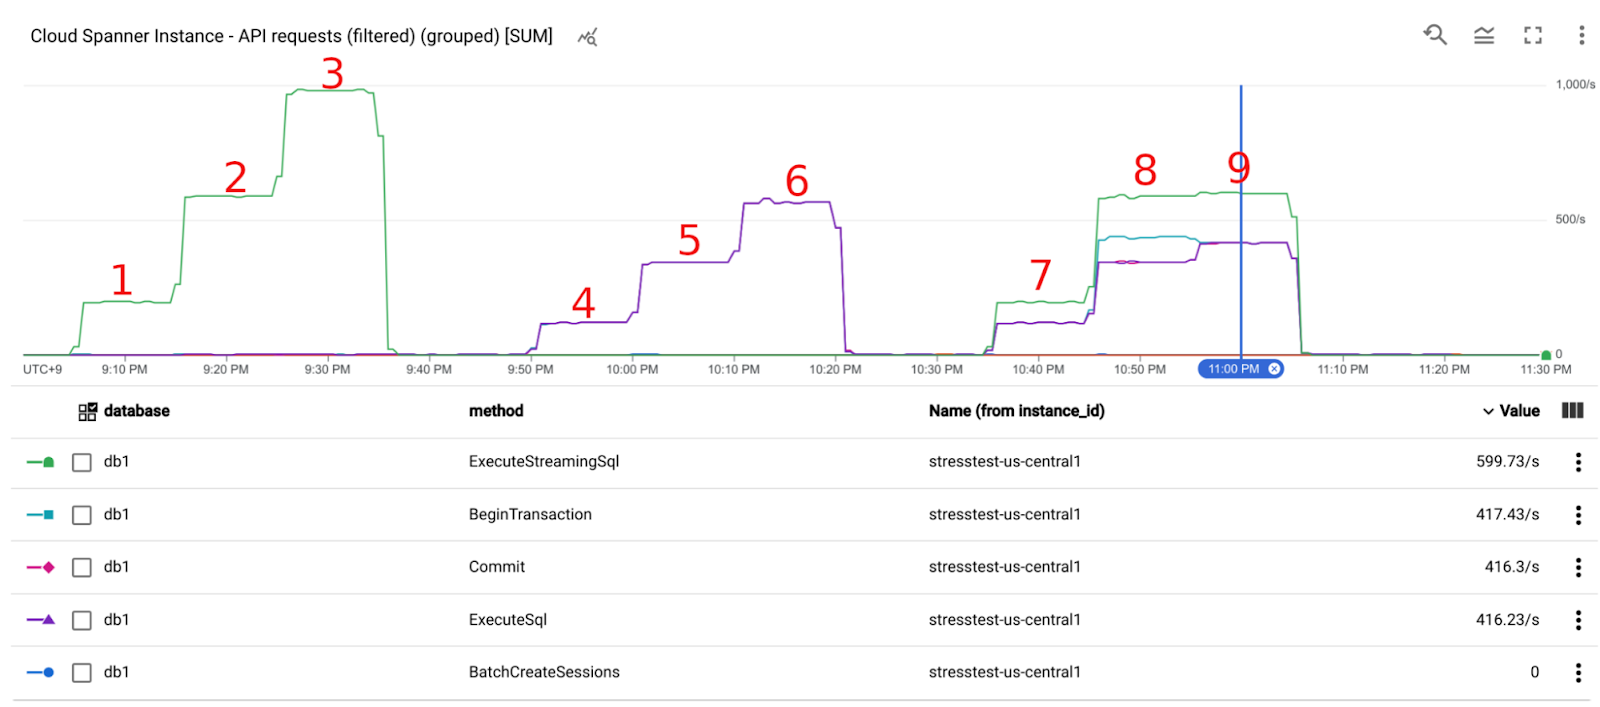
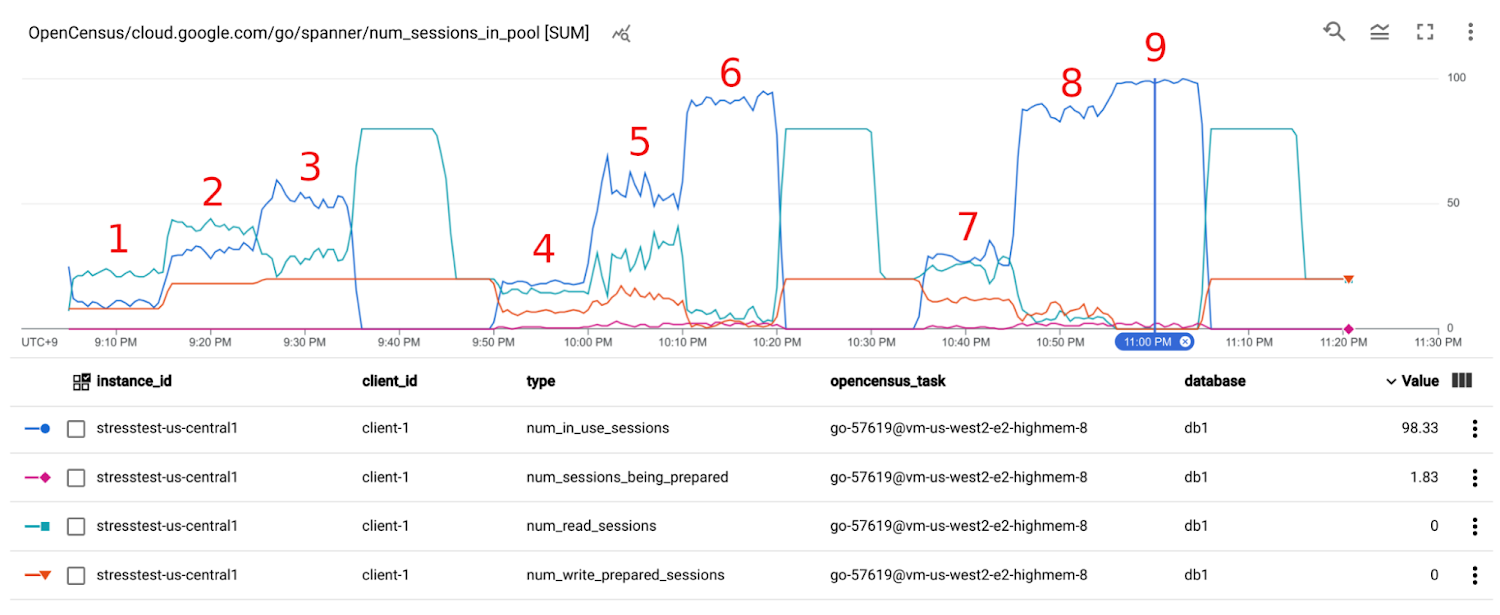
Each scenario had a different concurrency where each agent continued to repeat (1) ~ (2) for 10 minutes. There was a 15 minute interval between 3 and 4, and between 6 and 7, by which you'll see the session pool shrink behavior.


The following graph shows the throughput (requests per second). Until Scenario 8, the throughput increased proportionally. However, in Scenario 9, the throughput didn't increase as expected. And server side metrics don't indicate that the bottleneck is on the server side.

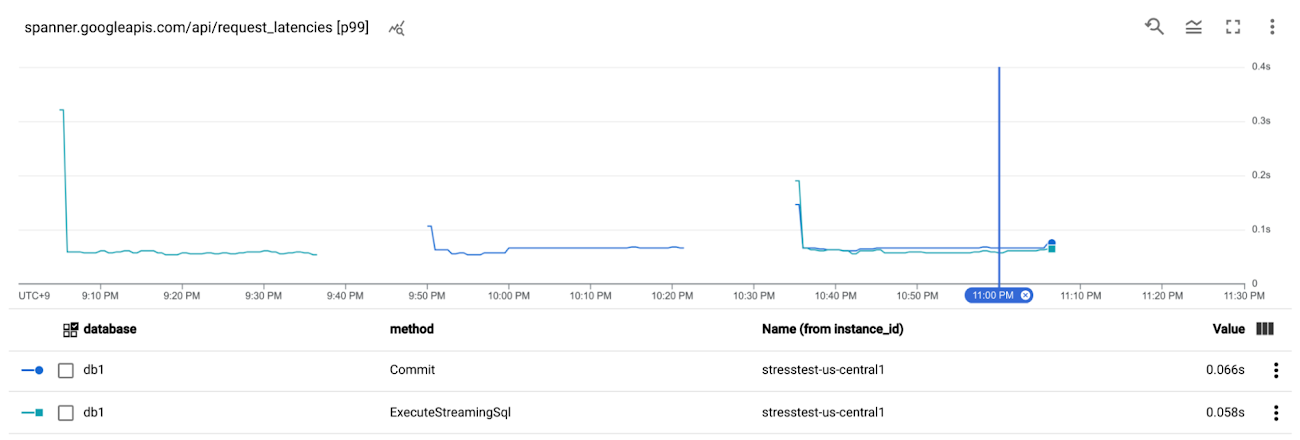
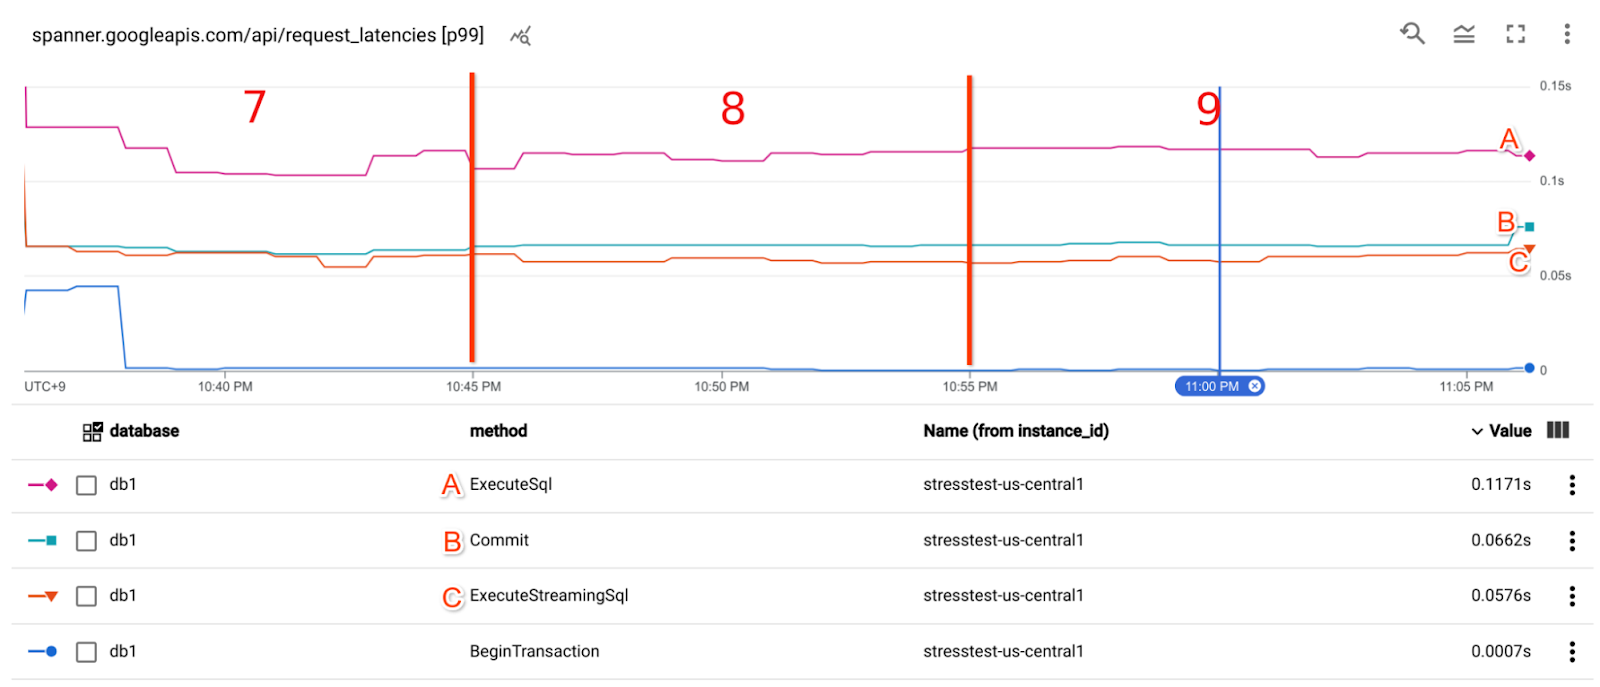
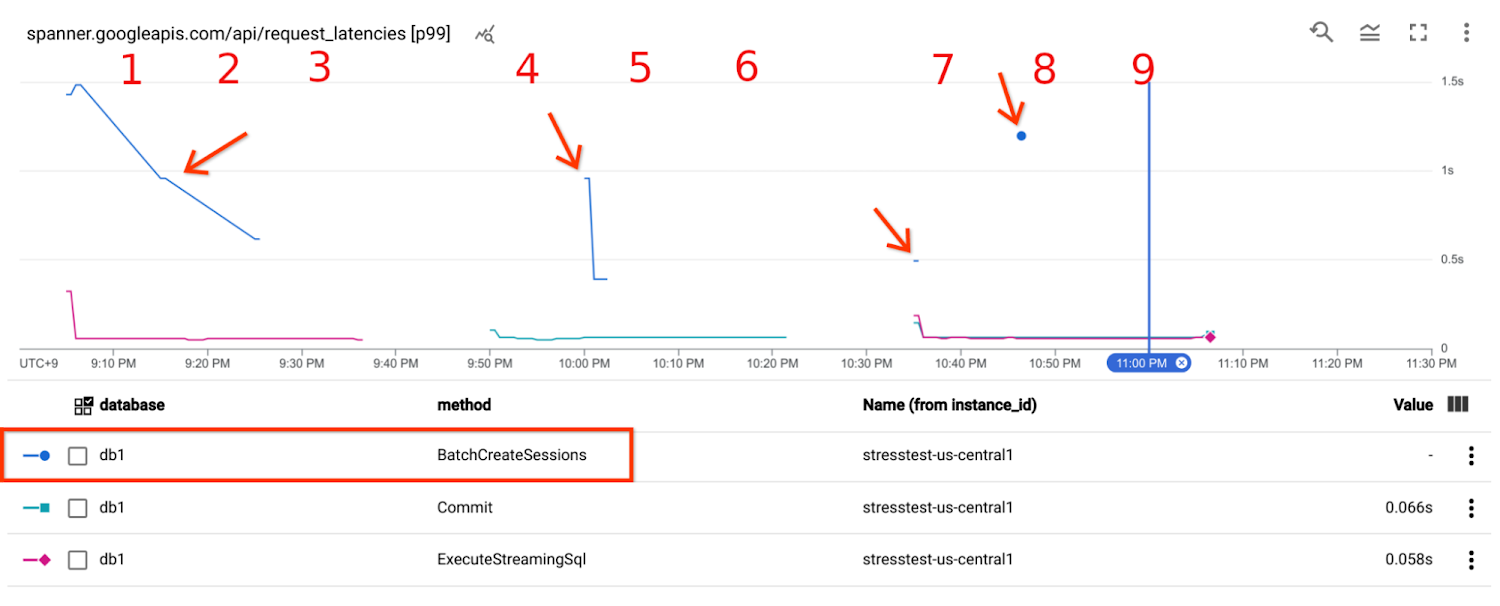
Cloud Spanner API request latency (spanner.googleapis.com/api/request_latencies) was stable for ExecuteSql requests and Commit requests throughout the experiment, mostly less than 0.07s at p99.

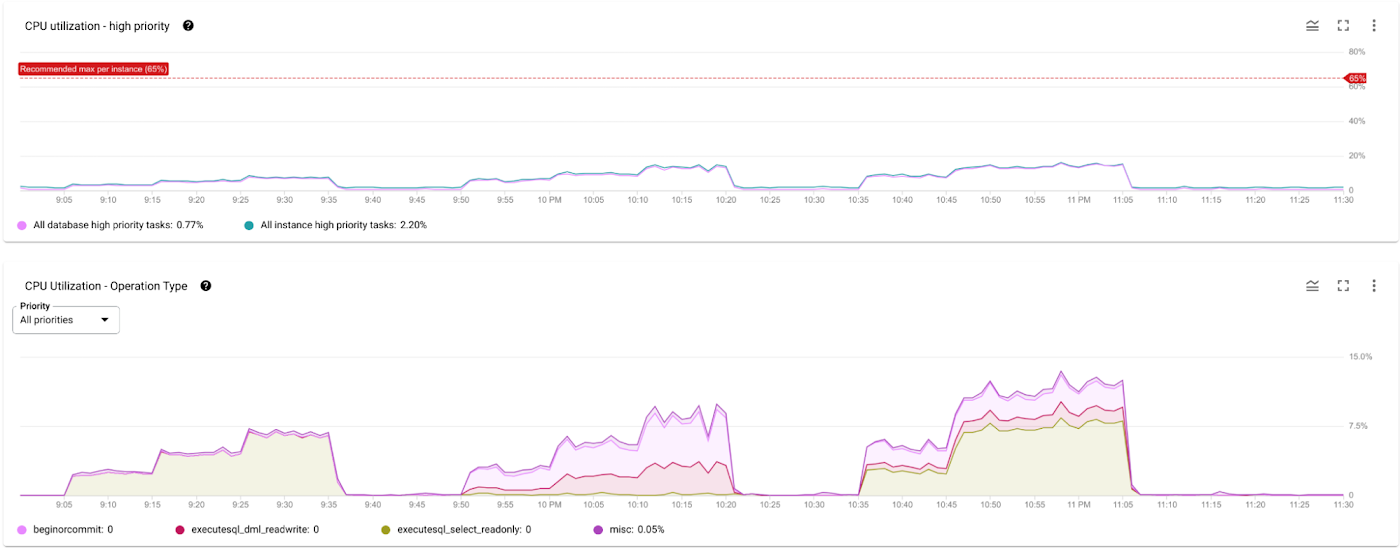
Instance CPU utilization was low and under the recommended rate (high priority < 65%) all the time.

How to enable OpenCensus metrics and traces
Before looking into actual OpenCensus examples and other metrics, let's see how you can use OpenCensus with the Cloud Spanner library in Go.
As a simple approach, you can do this way.
This enables the GFELatency metric, which is described in Use GFE Server-Timing Header in Cloud Spanner Debugging.
This enables all session pool metrics, which are described in Troubleshooting application performance on Cloud Spanner with OpenCensus.
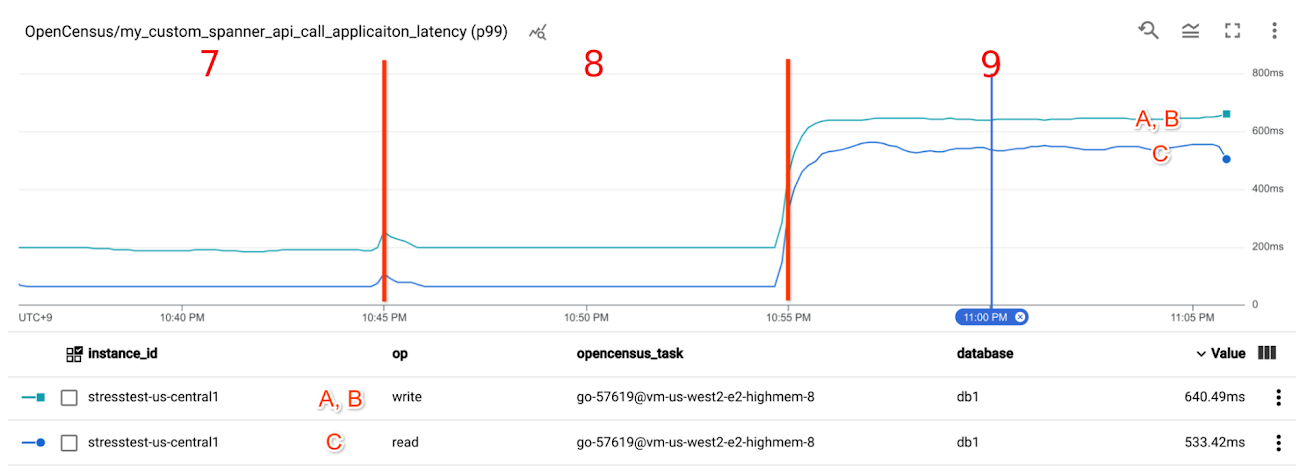
Additionally, you may want to register and capture your own latency metrics. In the code below, that is "my_custom_spanner_api_call_applicaiton_latency", and the captured latency is the time difference between the start and the end of a transaction. In other words, this is the end-to-end Cloud Spanner API call latency from a client application's point of view. At the bottom of the main function above, you can add the following code.
After that you can measure the latency like this.
Observations from the case study.
Let's check the collected stats from the server side to the client. In the diagram below, which is from Cloud Spanner end-to-end latency guide, let's check the results from 4 -> 3 -> 2 -> 1.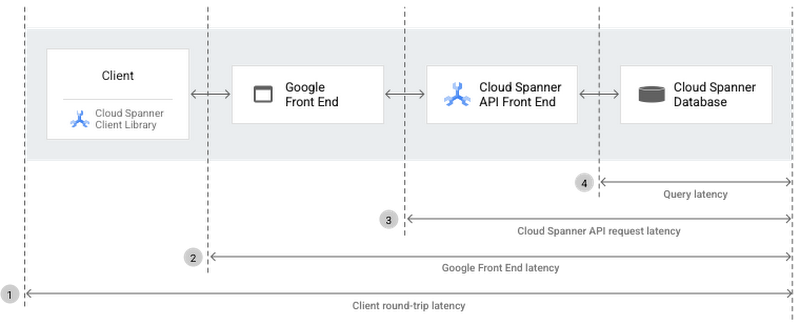

Query latency
One of the convenient approaches to visualize Query latency is to use Query insights. You can get the overview of the queries and tags that cause the most database load within the selected time range. In this scenario, Avg latency (ms) for the read requests was 1.84. Note that the "SELECT 1" queries are issued from the session pool library to keep the sessions alive.
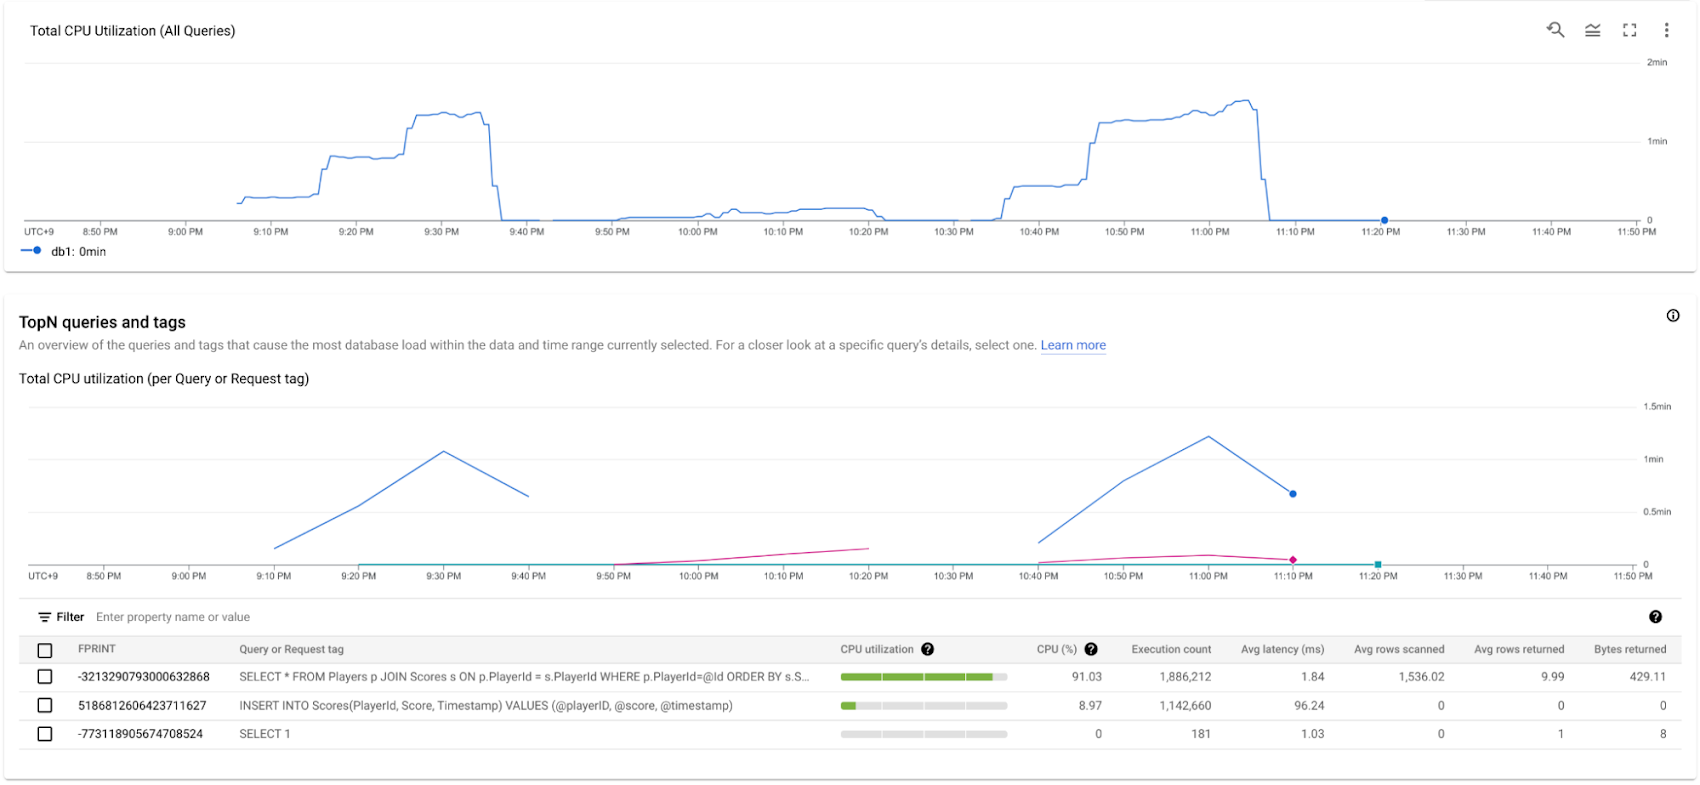

For more details, you can use Query statistics. Unfortunately, mutation data is not available in these tools, but if you're concerned about lock conflicts with your mutations, you can check Lock statistics.
Cloud Spanner API request latency
This latency metric has a big gap compared to the query latency in Query Insights above. Note that INSERT query involves ExecuteSql call and Commit call, as you can see them in a trace later. Also note that ExecuteSql has some noise due to session management requests. There are 2 main reasons for the latency gap between Query latency and Cloud Spanner API request latency. Firstly, Query Insights shows average latency, whereas the stats below are at 99th percentile. Secondly, the Cloud Spanner API Front End was far from the Cloud Spanner Database. The network latency between us-west2 and us-central1 is the major latency factor.

Google Front End latency
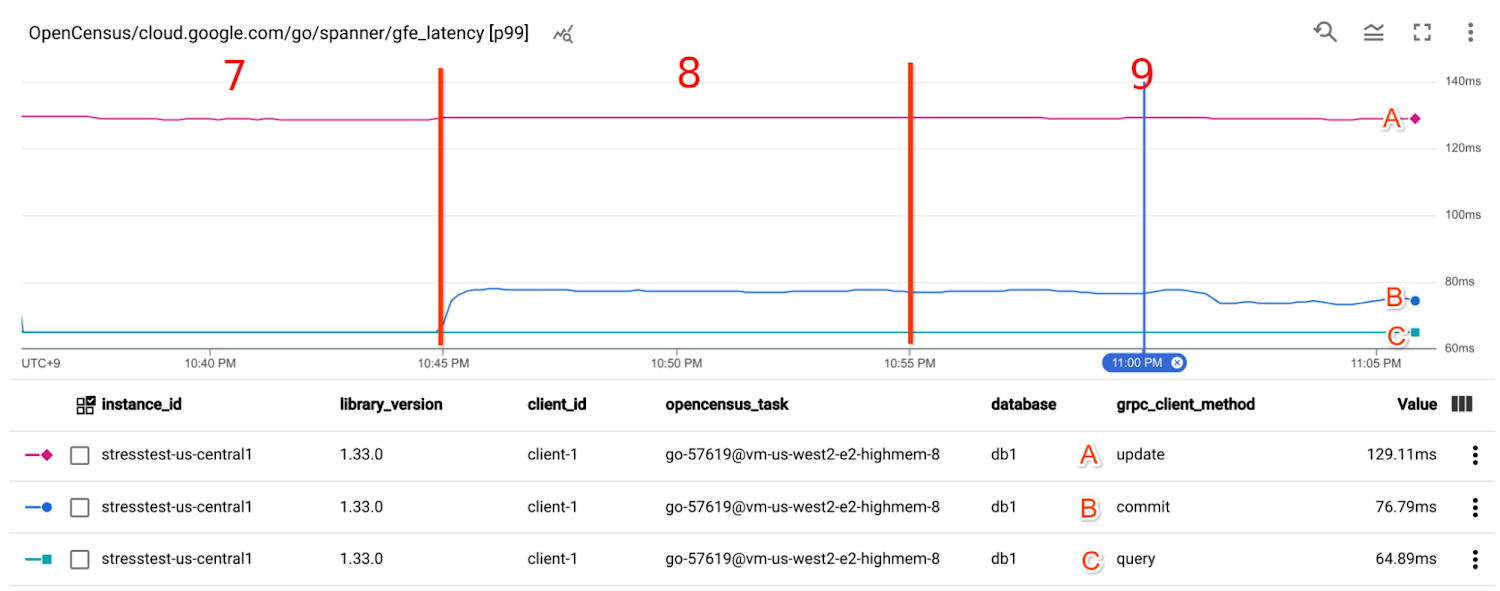
GFE latency metrics (OpenCensus/cloud.google.com/go/spanner/gfe_latency) basically shows the same as the Cloud Spanner API request latency.
By comparing Cloud Spanner API request latency and Google Front End latency, you can interpret that there wasn't any major latency gap between Google Frontend and Cloud Spanner API Front End throughout the experiment.

[Client] Custom metrics
my_custom_spanner_api_call_applicaiton_latency shows much higher latency in the last scenario. As you saw earlier, the server side metrics Cloud Spanner API request latency and Google Front End latency didn't show such high latency at 11:00 PM.

[Client] Session pool metrics
The definition of each metric is as follows:
num_in_use_sessions: the number of sessions used.
num_read_sessions: the number of idle sessions prepared for read-only transactions.
num_write_prepared_sessions: the number of idle sessions prepared for read-write transactions
num_sessions_being_prepared: the number of sessions that at that moment is being used to execute a BeginTransaction call. The number is decreased once the BeginTransaction call has finished. (Note that this is not used in Java and C++ client libraries. These libraries take the so-called Inlined BeginTransactions mechanism, and don't prepare transactions beforehand.)
In the last scenario at around 11:00 PM, you can see that num_in_use_sessions were always close to the max of 100, and some were in num_sessions_being_prepared. That means the session pool didn't have any idle sessions throughout the last scenario.
With all things considered, you can assume that the high latency in my_custom_spanner_api_call_applicaiton_latency (i.e. end-to-end call latency captured in the application code) was due to the lack of idle sessions in the session pool.

Cloud Trace
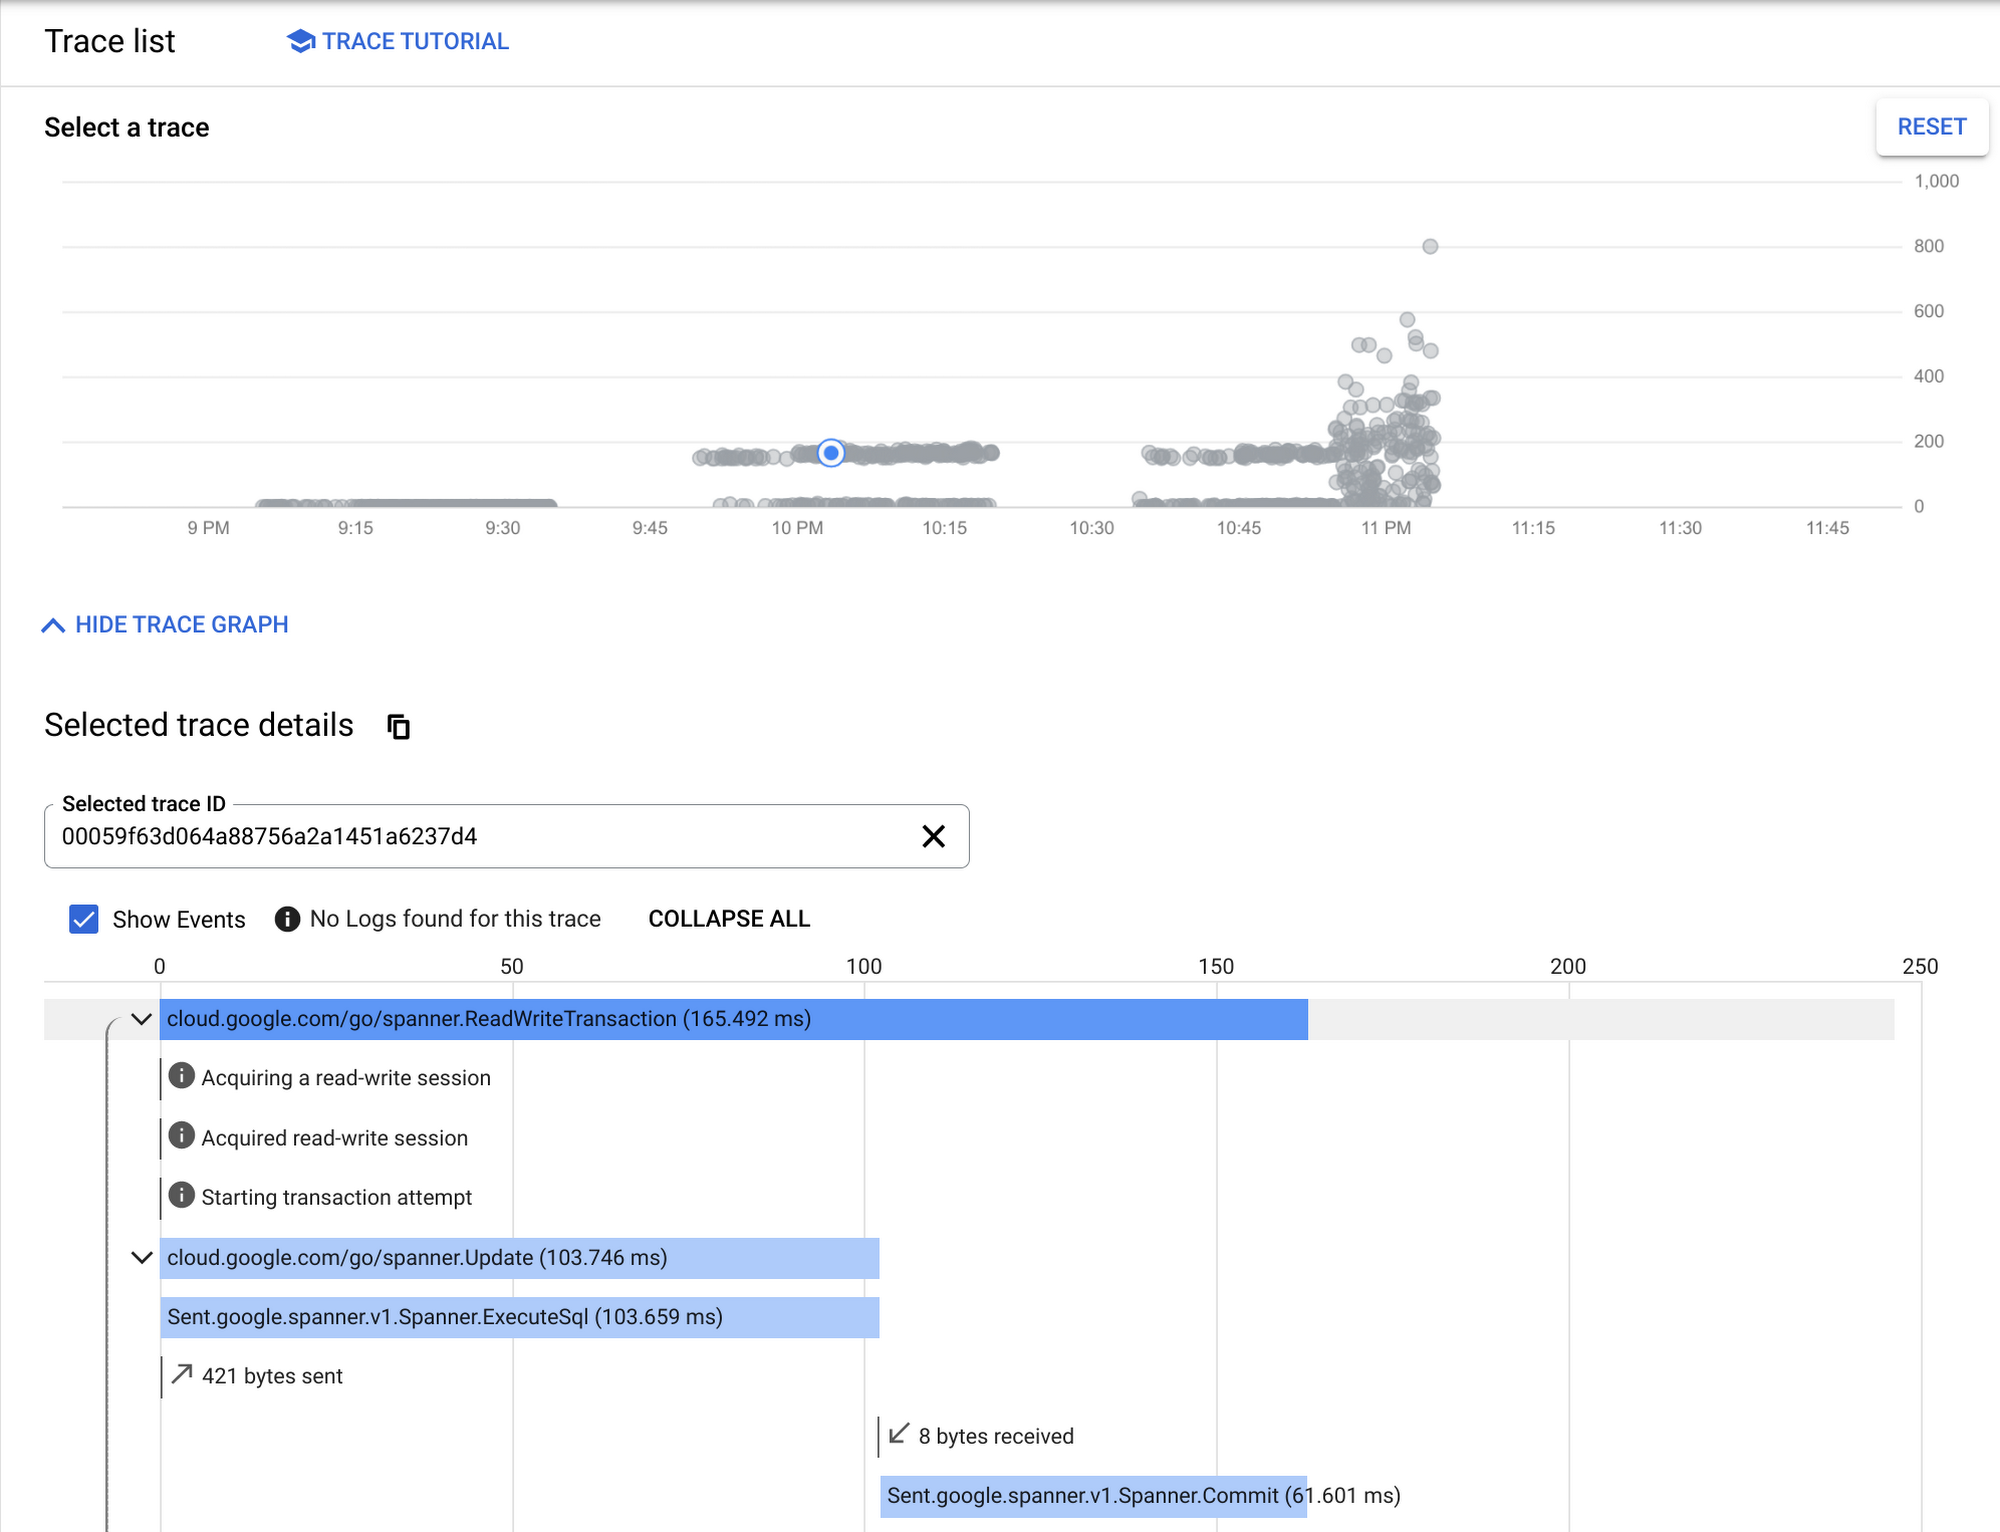
You can double-check the assumption by looking into Cloud Trace. In an earlier scenario at around 10 PM, you can confirm in the trace events that "Acquired read-write session" happened as soon as ReadWriteTransaction started.

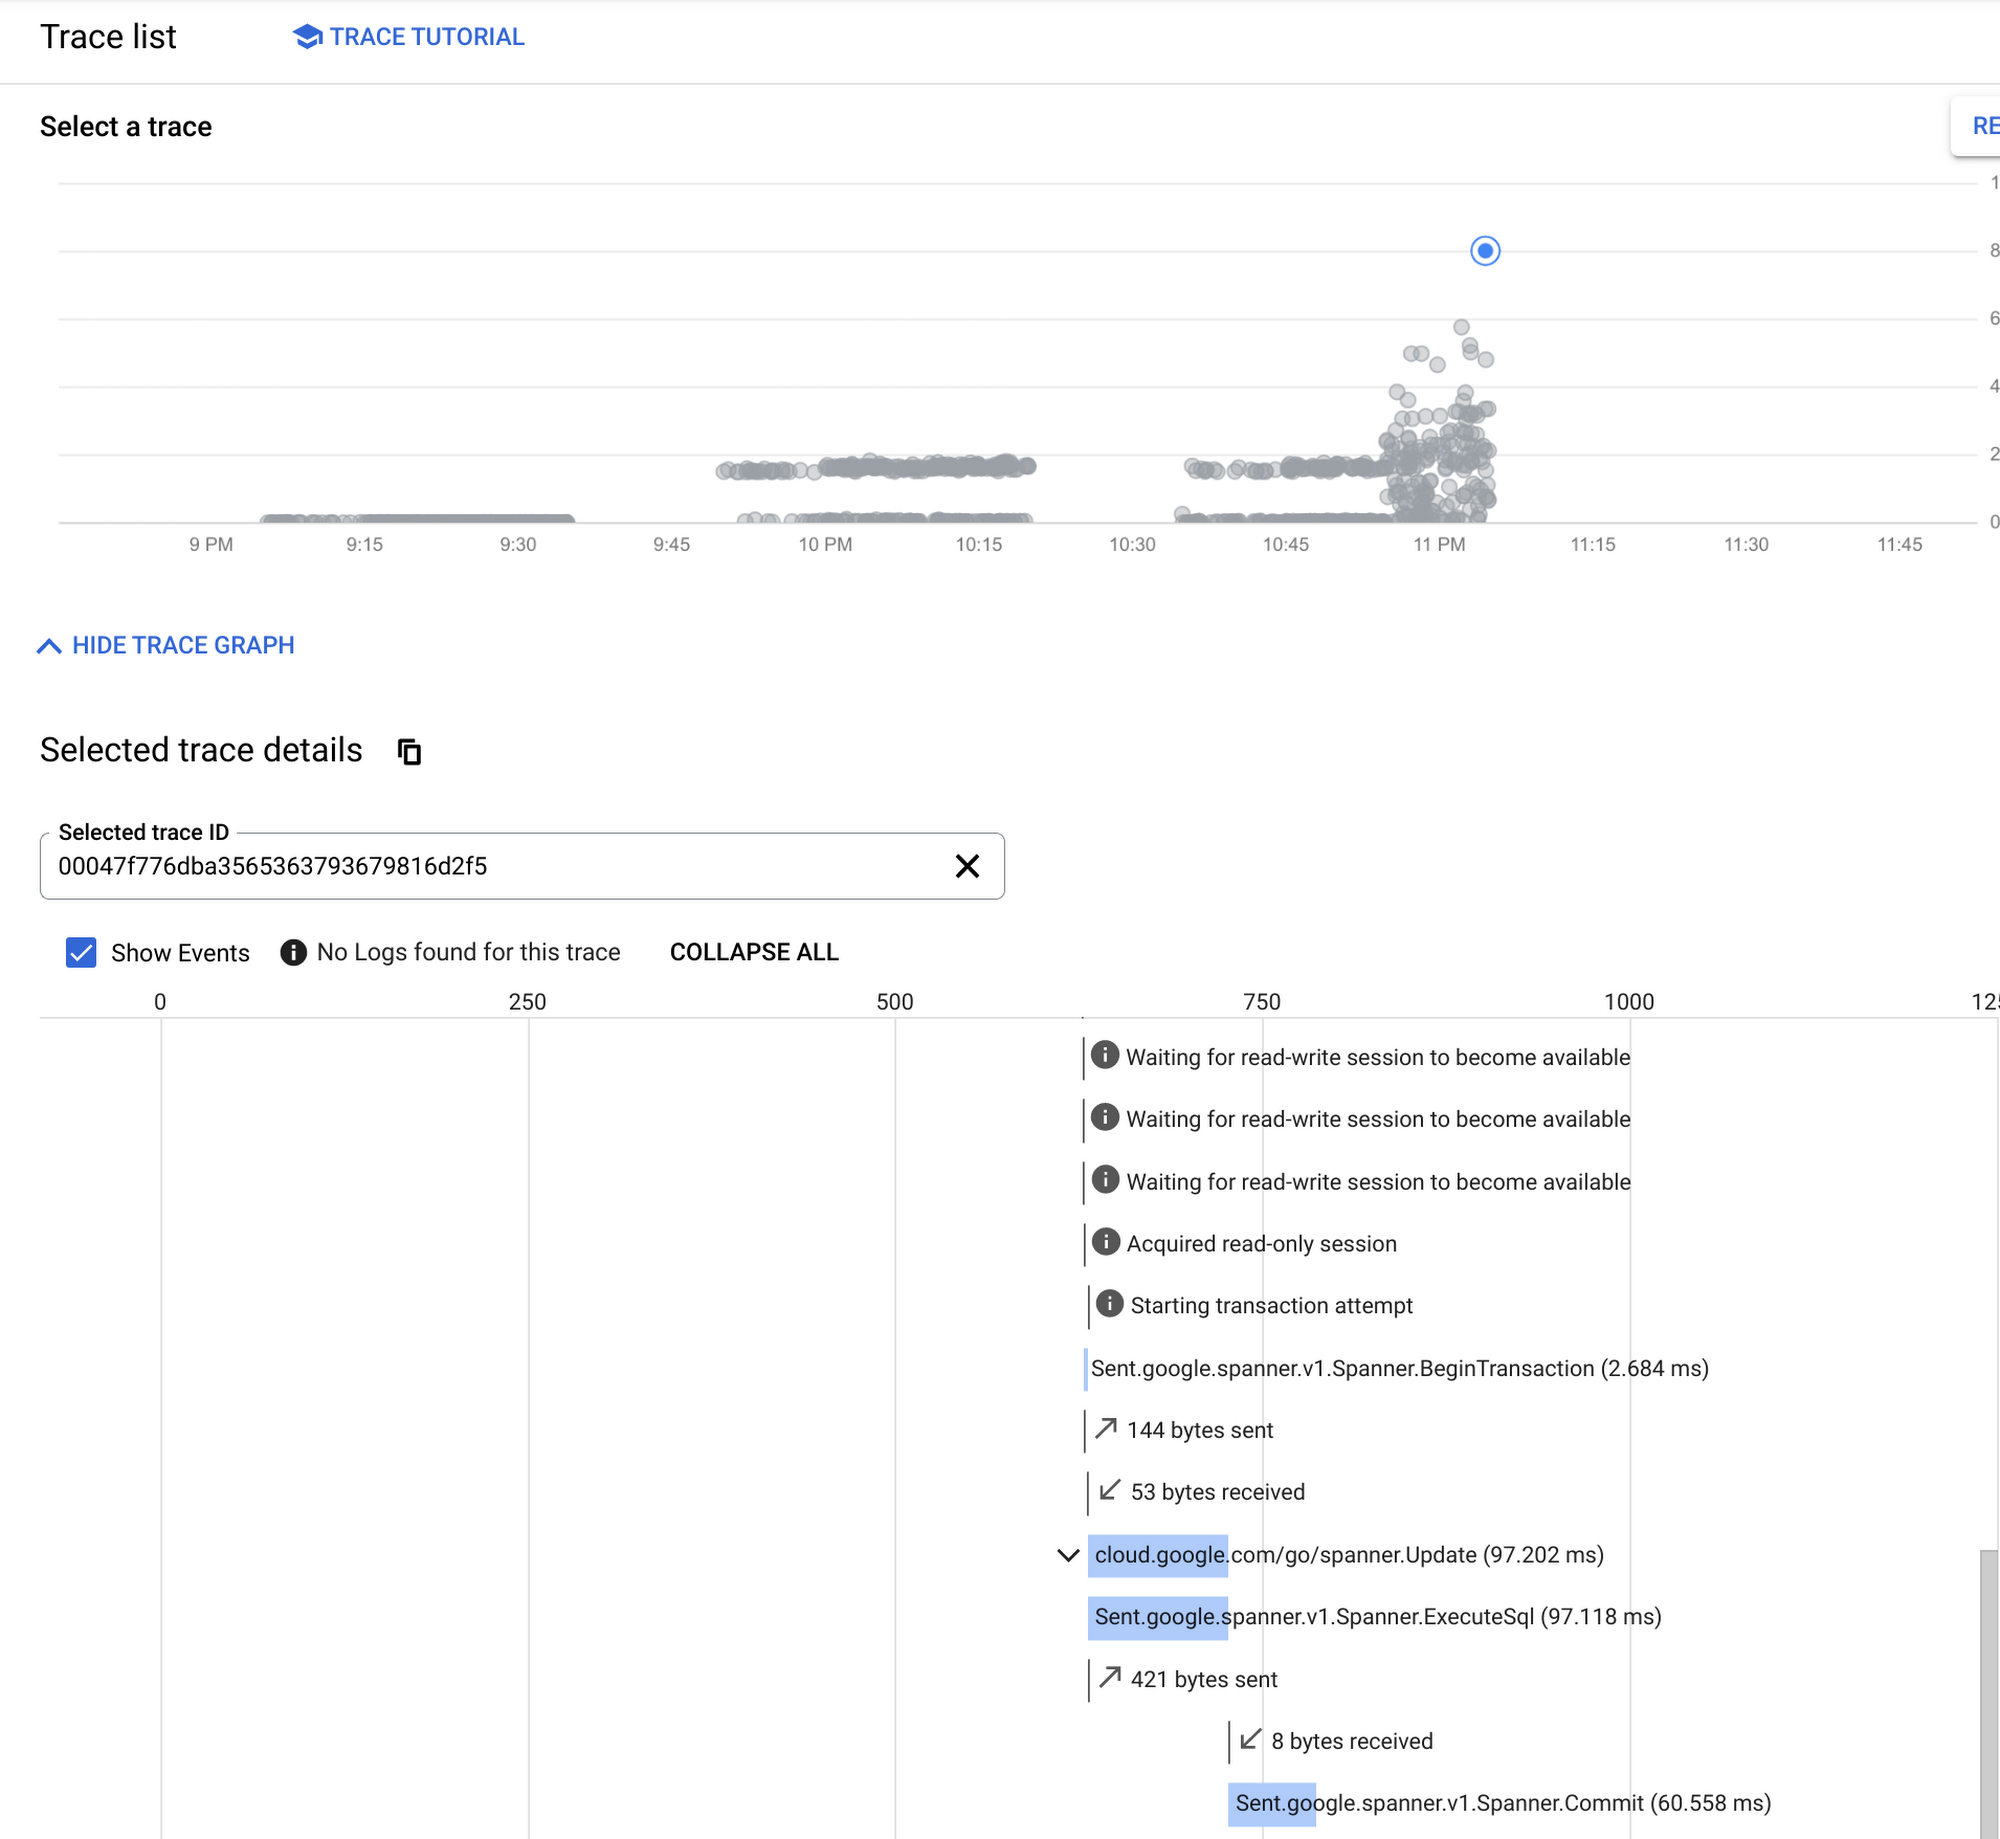
On the other hand, in the last scenario at around 11:00 PM,the following trace tells that the transaction was slow because it couldn't acquire a read-write session. "Waiting for read-write session to become available" repeated. Also, because the transaction was only able to get a read-session "Acquired read-only session", it needed to start a read-write transaction -- making a BeginTransaction call.

Remarks
There are some remarks in the case study and checking metrics:
1) There were some latency fluctuations in ExecuteSql and ExecuteStreqmingSql. This is because, when an ExecuteSql or ExecuteStreamingSql is made, PrepareQuery is executed internally and the compiled query plan and execution plan are cached. (See Behind the scenes of Cloud Spanner’s ExecuteQuery request). The cache happens at the Cloud Spanner API layer. If requests go through a different server, the server needs to cache them. The PrepareQuery call adds an additional round trip between the Cloud Spanner API Front End and Cloud Spanner Database.
2) When you look at metrics, especially at long tail (e.g. 99th percentile), you may see some strange latency results where server side latency looks longer than client latency. This doesn't normally happen, but it could happen because of different sampling methods, such as interval, timing, distribution of the measurement points. You may want to check more general stats such as 95th percentile or 50th percentile if you want to check the general trend.
3) Compared to the Google Front End latency, the client side metric -- my_custom_spanner_api_call_applicaiton_latency as an example -- contains not only the time to acquire a session from the pool, but also various latency factors. Some of the other latency factors are:
Automatic retries against aborted transactions or some gRPC errors, depending on your client library. You can configure custom timeouts and retries.
Create additional sessions (You'll see BatchCreateSessions latency spikes in Cloud Spanner API request latency).
BeginTransaction for read-write transactions. They are automatically prepared for the read-write sessions in the pool. BeginTransaction calls can also happen if read-write transactions need to use read sessions due to lack of read-write sessions, or transactions for the read-write sessions are invalid or aborted.
Round trip time between the client and Google Front End.
Establishing a connection at TCP level (TCP 3-way handshake) and at TLS level (TLS handshake).
If your session pool metrics don't indicate an exhaustion issue, you may need to check other aspects.
4) You may see ExecuteSql calls outside of your application code. These are likely the ping requests by the session pool library to keep the sessions alive.
5) If your client performs read-write transactions very frequently and if you often see your read-write transaction request acquires a read-only session in your trace, setting a higher WriteSessions ratio would be beneficial because a read-write session calls BeginTransaction beforehand before the session is actually used. Manage the write-sessions fraction explains the default values for each library. On the other hand, if the traffic volume is low and sessions are often idle for a long time in your client, setting WriteSessions ratio to 0 would be more beneficial. If the sessions are not used so much, it's possible that the prepared transaction is already invalid and gets aborted. The cost of the failure is high compared to preparing read-write transactions beforehand.
6) A BatchCreateSessions request is a costly and time-consuming operation. Therefore, it's recommended to set the same value to MinOpened and MaxOpened for the session pool.

Conclusion
By using custom metrics and traces, you can narrow down the client side latency cause which is not visible in the default server side metrics. I hope this article will help you identify a real cause more efficiently than before.


