Troubleshooting application performance on Cloud Spanner with OpenCensus
Mayur Kale
Software Engineer
Kiranmayi Bhamidimarri
Software Engineer
This tutorial shows how to configure client-side metrics recording in your Cloud Spanner workloads using OpenCensus. While Cloud Spanner surfaces a number of helpful server-side metrics, applications can realize the added benefits of collecting metrics emitted by the Cloud Spanner client library. For example, only client-side metrics include session and transaction related information. These OpenCensus metrics will provide you with enough data to enable you to spot, and investigate the cause of any unusual deviations from normal behavior.
Before I dive into the details let me provide a brief introduction to OpenCensus.
OpenCensus provides libraries for C++, Java, Go, Python, Javascript, .Net, Ruby, and PHP that that capture distributed traces and metrics from applications, and send this telemetry to backends like Cloud Monitoring, Cloud Trace, Prometheus, Jaeger, Datadog, etc. More info and the user manual are available on opencensus.io. In this blog, we explore the client-side metrics in Java through an example.
Before you begin
Make sure you’re using Java 8 or greater and Apache Maven.
Our example will run on Google Cloud and emit metrics to Cloud Monitoring and Traces to Cloud Trace, however you can run your code anywhere and can use any exporter that OpenCensus supports.
Client-side metrics for investigating the use and abuse of the session pool
These simple metrics should allow you to diagnose a range of different issues, from the effects of changing the min/max session configuration, to detecting session leaks. You may find the below metrics in the Cloud Spanner Java and Go client libraries.
Sessions are a central concept in the Cloud Spanner API. All Spanner reads and writes are performed through a session. A session can have only one active transaction at any time.
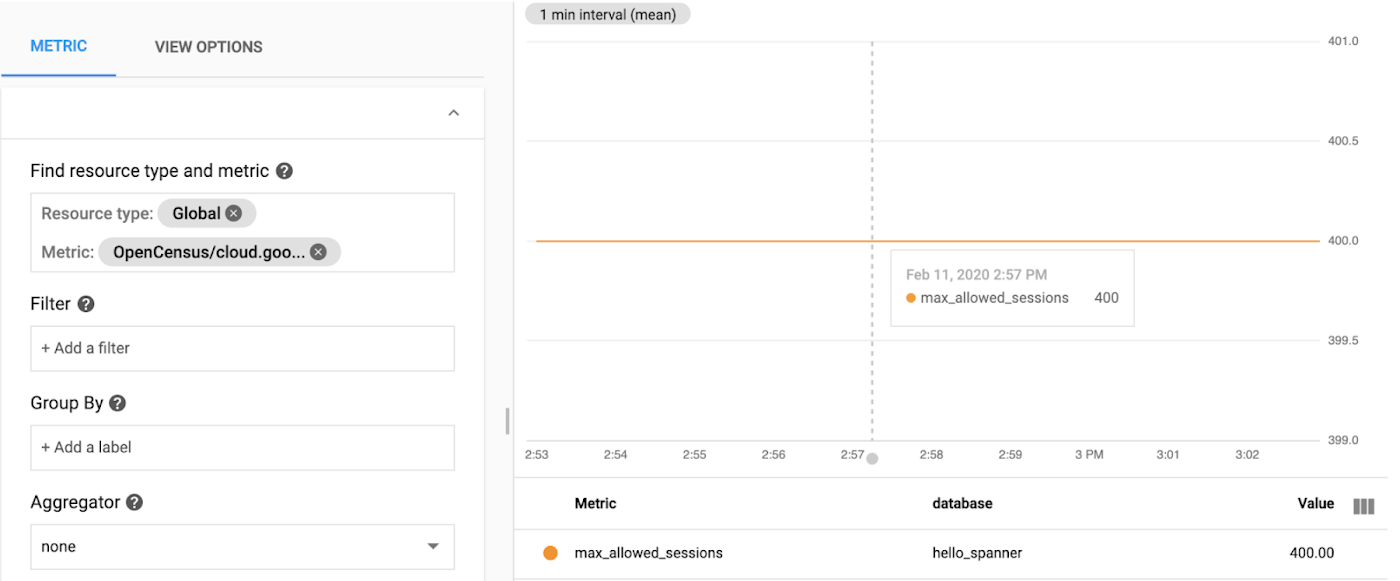
1. Tracking the number of max-allowed sessions, configurable by the usercloud.google.com/java/spanner/max_allowed_sessions: This shows the maximum number of sessions allowed. If the current number of sessions in the pool is less than this and they are all in use, then a new session will be created for any new operation. If the current number of in-use sessions are the same as this number and a new request comes, the pool can either block or fail. This metric is labeled by database name, instance name and library version

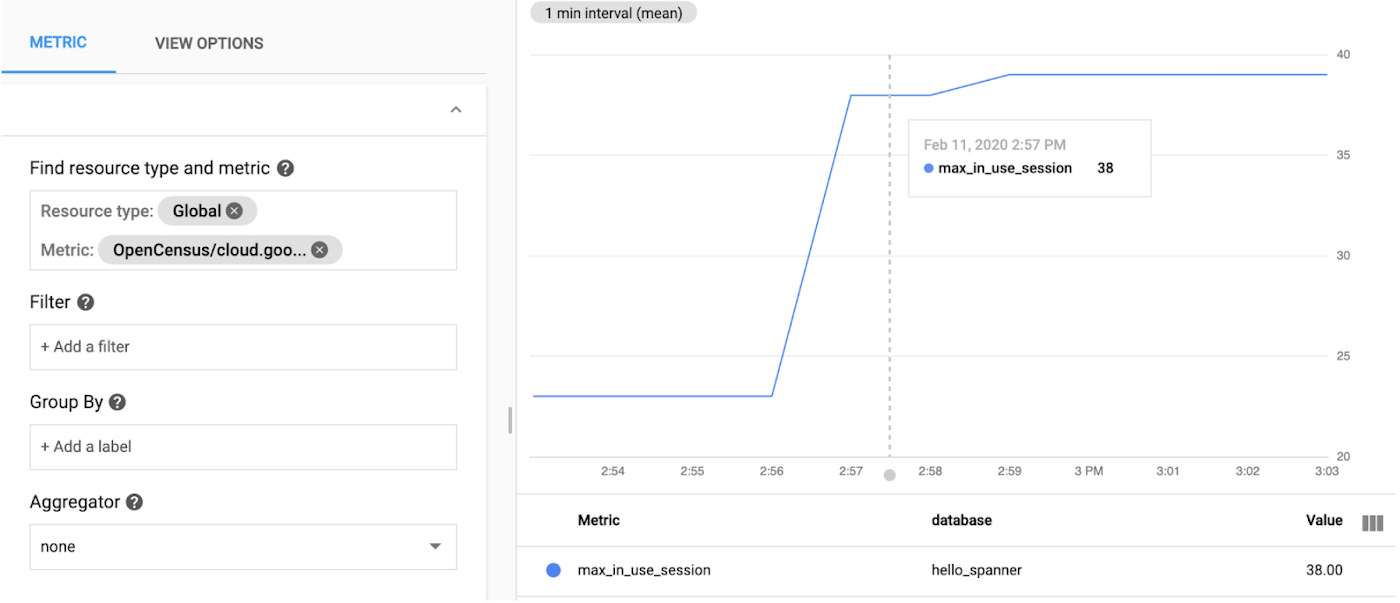
2. Tracking the number of max-in-use sessionscloud.google.com/java/spanner/max_in_use_sessions: This returns the maximum number of sessions that have been in use during the last maintenance window interval, so as to provide an indication of the amount of activity currently in the database. It is specific to the database and instance name it runs in. A maintenance window is a set 10 minute interval. After a complete maintenance window has passed, the value is reset to zero (and then starts increasing again). The value is updated every time a session is checked out of the pool.

3. Tracking the number of sessions in poolcloud.google.com/java/spanner/num_sessions_in_pool: This metric allows users to see instance-level and database-level data for the total number of sessions in the pool at this very moment. This metric lists the number of num_in_use_sessions, num_sessions_being_prepared, num_read_sessions and num_write_prepared_sessions. The metric num_sessions_being_prepared is currently unsupported and is set to 0 by default. The num_read_sessions and num_write_prepared_sessions together indicate the number of sessions in the pool. The num_in_use_sessions indicates the number of sessions currently being used.


4. Tracking the number of requests to get session timeouts (cumulative)cloud.google.com/java/spanner/get_session_timeouts: This gives you an indication of the total number of get session timed-out instead of being granted (the thread that requested the session is placed in a wait queue where it waits until a session is released into the pool by another thread) due to pool exhaustion since the server process started. Consider this value in combination with the value of currently in_use_sessions to understand the load on the database. This metric is labeled by database name, instance name and library version. In such a situation, you should observe a value for currently in_use_sessions that is equal to (or almost equal to) max_allowed_sessions all the time. While that is an indication that something is not well, it could also be that the application and the session pool are operating at their max, but without actually being exhausted.
Below are the steps to troubleshoot this problem:
Check your application log for
LeakedSessionExceptionsthat occur when you close your Spanner instance. (Closing a Spanner instance will close the session pool, and closing the session pool will trigger these LeakedSessionExceptions for all sessions that have not been checked back into the session pool before closing the pool.)If you have
LeakedSessionExceptions: Investigate the stack trace of these and fix the code that is checking out the session, but not checking them back in, for example not closing allResultSetsor by not closing a read-only transaction.If you do not have
LeakedSessionExceptions: IncreaseSessionPool.maxSessions.
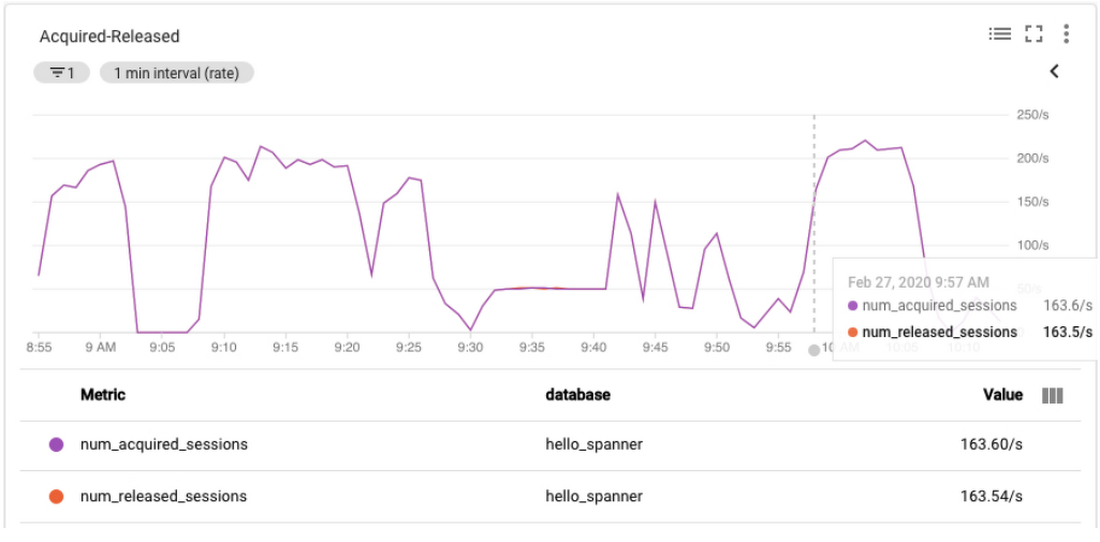
5. Tracking the number of acquired and released sessionscloud.google.com/java/spanner/num_acquired_sessions: This metric allows users to see the total number of acquired sessions.
cloud.google.com/java/spanner/num_released_sessions: This metric allows users to see the total number of released (destroyed) sessions.
Under ideal conditions, the number of acquired sessions should be equal to (or almost equal to) the released session count. If the difference between the two is steadily increasing, it is certainly an indication that there is a session leak. The metric is also an indication of the load on the system, so if you were to present it as a timeline, you would be able to recognize peak and low load moments.

6. Tracking the roundtrip and GFE latenciesOpenCensus/grpc.io/client/roundtrip_latency: This metric provides the time between the first byte of the API request sent to the last byte of the response received.
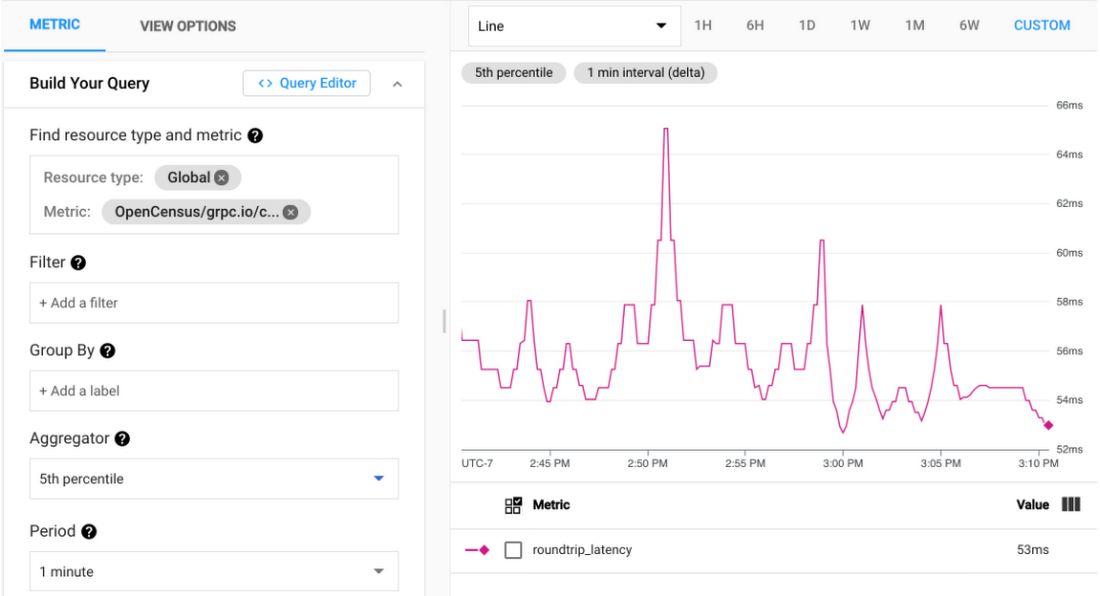

cloud.google.com/java/spanner/gfe_latency: This metric provides the latency between Google's network receiving an RPC and reading back the first byte of the response.
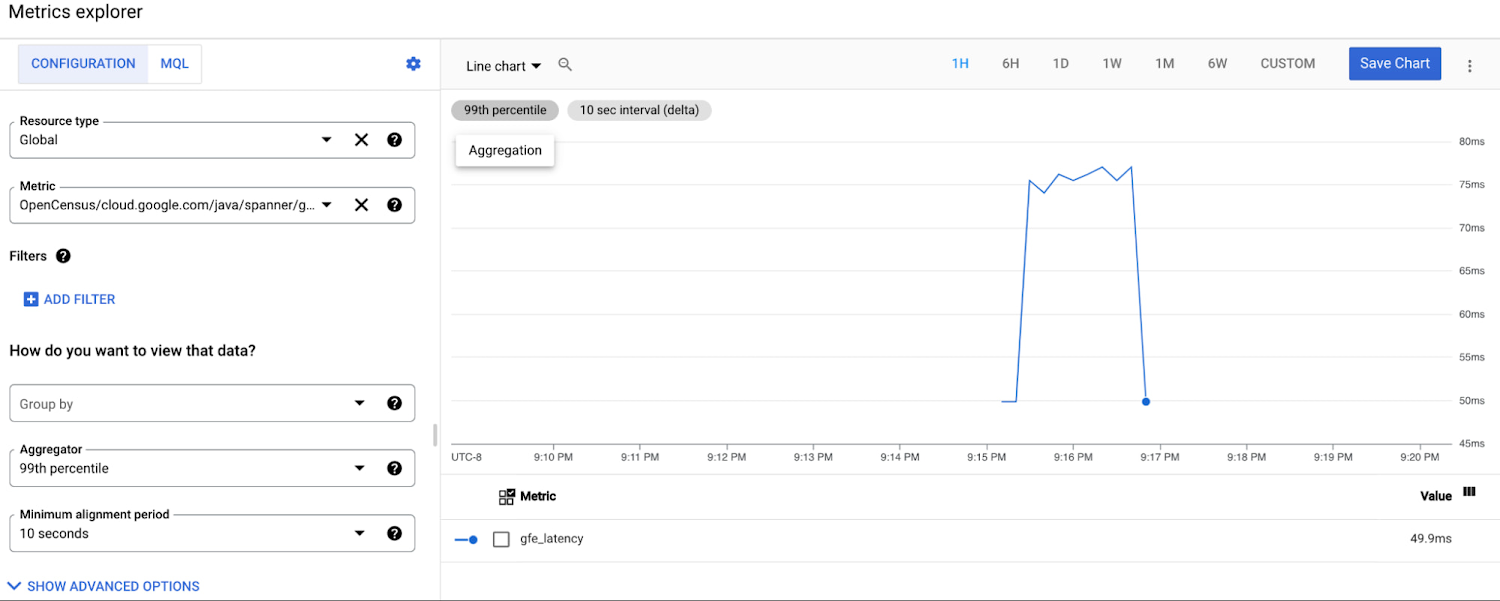

cloud.google.com/java/spanner/gfe_header_missing_count: This metric provides the number of RPC responses received without the server-timing header, most likely meaning that the RPC never reached Google's network.
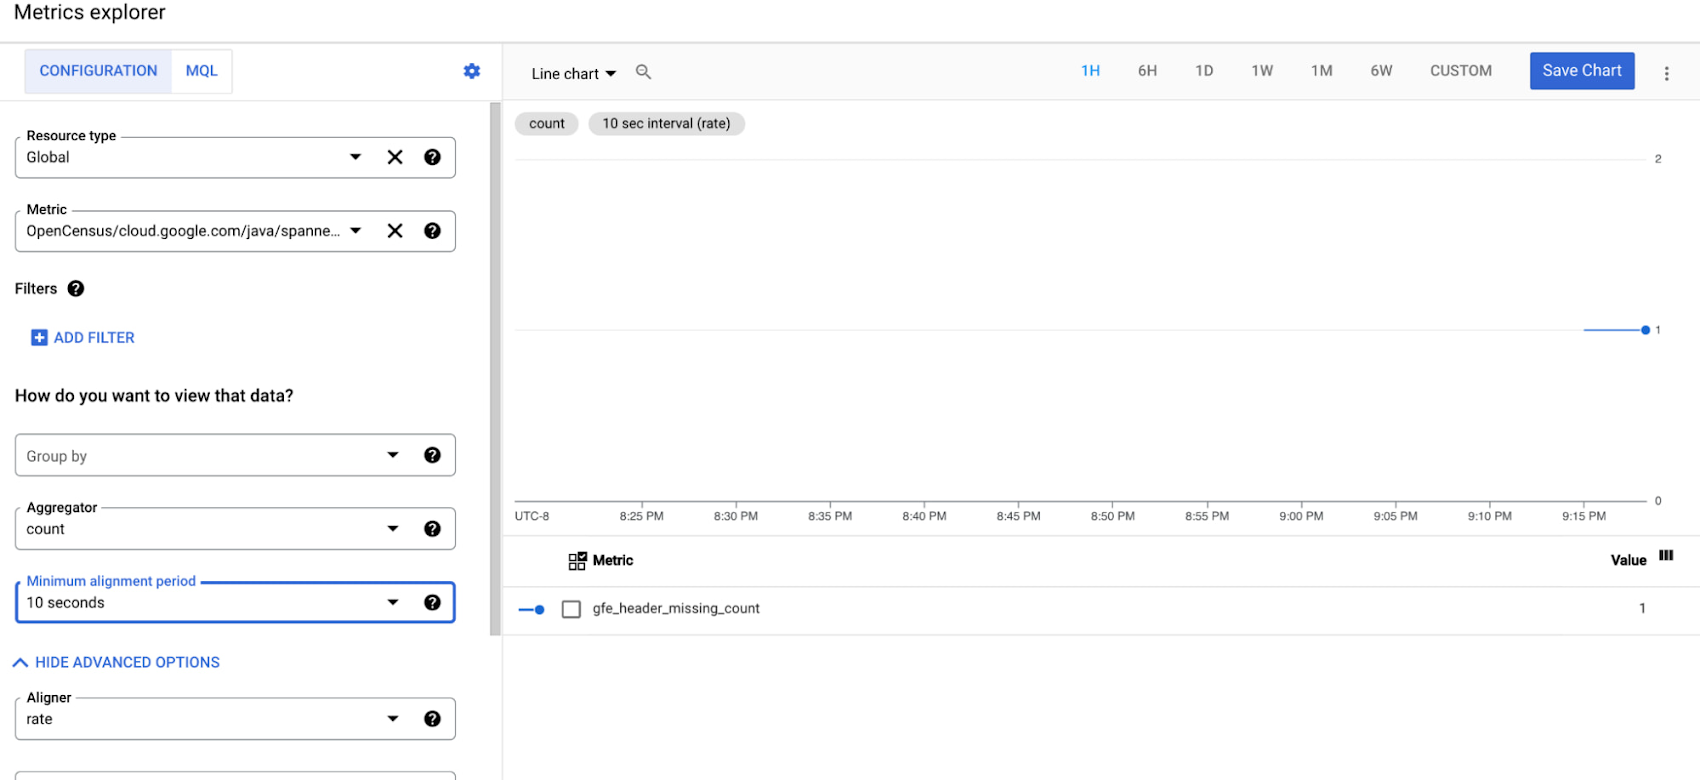

Currently the gfe_latency and gfe_header_missing_count metrics are available in the Cloud Spanner java client library only. We are in the process of adding support in our Go client library.
By comparing the latencies between client, GFE and Spanner query execution, users and support engineers should now be able to narrow down the cause of slow Spanner operations. For example,
High round-trip latency, high GFE latency and high Cloud Spanner query latency: If the query execution latency is high, users can focus on optimizing schema, indexing and the query for better performance.
High round-trip latency, high GFE latency and low Cloud Spanner query latency: If your application experiences end-to-end latency and Google Front End latency that is higher than expected, but the latency metrics for Cloud Spanner query execution and GFE latency are significantly lower than the total end-to-end latency, there is likely an issue with GFE. Users can include this information in the support tickets so that support engineers can focus on GFE troubleshooting.
High round-trip latency, low GFE latency and low Cloud Spanner query latency: If your application experiences latency that is higher than expected, but the latency metrics for Cloud Spanner query execution and GFE latency are significantly lower than the total end-to-end latency, there might be an issue in your application code. If your application has a performance issue that causes some code paths to be slow, the total end-to-end latency for each request might increase. To check for this issue, benchmark your application to identify code paths that are slower than expected. You can also comment out the code that communicates with Cloud Spanner, then measure the total latency again. If the total latency doesn't change very much, then Cloud Spanner is unlikely to be the cause of the high latency. This could indicate a networking issue between the client and the GFE and needs fixing of the network routing.
To set up and enable Metrics, follow these steps:
Step 1 — Setting Up and Enabling Enhanced Metrics
In order to capture client-side metrics and distributed traces from the Cloud Spanner client, we need to use OpenCensus Observability Ready Util for Java. This package provides a convenient wrapper so that developers can use OpenCensus easily.
By default, OpenCensus Observability Ready Util does the following things:
Enables basic RPC (is a single call against a gRPC service, either streaming or unary) views to surface below mentioned server-side metrics. To consume the GFE latency metrics, you have to register the views.
Sets probabilistic sampling rate to 0.0001 (1 in 10,000)
Creates and registers OCAgent Trace Exporter to collect traces
Creates and registers OCAgent Metrics Exporter to collect metrics.
If you are using Maven, add this to your pom.xml file
If you are using Gradle, add this to your dependencies:
Configure OpenCensus and register views
The Cloud Spanner client supports OpenCensus Metrics, which gives insight into the client internals and aids in debugging/troubleshooting production issues. Metrics prefixed with cloud.google.com/java/spanner/ focus on operational level metrics. RPC level metrics can be gleaned from gRPC’s metrics, which are prefixed with grpc.io/client/.
Step 2 — Deploy and run the OpenCensus agent
The ocagent can be run directly from sources, binary, or a Docker image. To install and build the agent, please follow the instructions from here.
Step 3 — View the captured metrics with Stackdriver Metrics Explorer
After you have enabled Metrics for your spanner client, you can view the metrics using Stackdriver Metrics Exporter.
Navigate to the Metrics Explorer.
In the “Find” resource type and metric field, enter the following: cloud.google.com/java/spanner/in_use_sessions
Select this metric from the list.
In the right pane, the count of in-use sessions.
Step 4 — Time to clean up
Since this tutorial uses multiple GCP components, please be sure to delete the associated resources once you are done.
Sample Java Application:
To run a demo and capture the metrics, you need to clone the application that follows to generate a sample load on Cloud Spanner and enable Opencensus metric collection. Please see below for a detailed guide:
Clone the source repository for this tutorial:
$ git clonehttps://github.com/cloudspannerecosystem/spanner-oc-java.gitUpdate the Java application with some configuration specific to your project. Navigate to the folder containing the Java source:
$ cd src/main/java/com/example/spannerConfigure the environment variable in the application code to use the Cloud Spanner instance and database.
To build the example:
$ mvn clean packageRun the following Maven commands to build and run the program: $ mvn exec:java -Dexec.mainClass=com.example.spanner.App
Go to http://localhost:8080/spanner/, and start sending read requests.
OpenCensus’s integration with Cloud Spanner thrives on being able to detect any unusual deviation from the normal in one or more metrics. The number of recently in-use sessions is a good example of a metric that needs a baseline to tell you if a measurement is reasonable or a sign of a problem. Having established a baseline for the metric, you’ll be able to spot, and investigate the cause of any unexpected deviations from normal behavior.
I hope this simple getting started guide gets you up and running. Let us know in the comment section below if you find this helpful and any suggestions or questions you may have.


