Use Process Metrics for troubleshooting and resource attribution
Rahul Harpalani
Product Manager
Try Google Cloud
Start building on Google Cloud with $300 in free credits and 20+ always free products.
Free trialWhen you are experiencing an issue with your application or service, having deep visibility into both the infrastructure and the software powering your apps and services is critical. Most monitoring services provide insights at the Virtual Machine (VM) level, but few go further. To get a full picture of the state of your application or service, you need to know what processes are running on your infrastructure. That visibility into the processes running on your VMs is provided out of the box by the new Ops Agent and made available by default in Cloud Monitoring. Today we will cover how to access process metrics and why you should start monitoring them.
Better visibility with process metrics
The data gathered by process metrics include CPU, memory, I/O, number of threads, and more, for any running processes and services on your VMs. When the Ops Agent or the Cloud Monitoring agent is installed, these metrics are captured at 60-second intervals and sent to Cloud Monitoring so you can visualize, analyze, track, and alert on them. A single VM may run tens or hundreds of processes, while you may have tens of thousands running across your fleet of VMs.
As a developer, you may only care about seeing inside a single VM to troubleshoot and identify memory leaks or the source of performance issues.
As an operator or IT Admin, you may be interested in aggregate resource consumption, building baseline views of compute, storage, and networking usage across your VM fleet. Then, when those baseline consumption levels break normal behaviors, you will know when to investigate your systems.
Built for scale and ease of use
Cloud Monitoring is built on the same advanced backend that powers metrics across Google. This proven scalability means your metrics ingestion will be supported despite the extremely high cardinality. Additionally, our agents do not require any config file changes to turn on process metric monitoring.
Lastly, our goal is to provide you the observability and telemetry data where, and when, you need it. So, like the rest of the operations suite, we deliver process metrics in the context of your infrastructure, directly in the VM admin console.
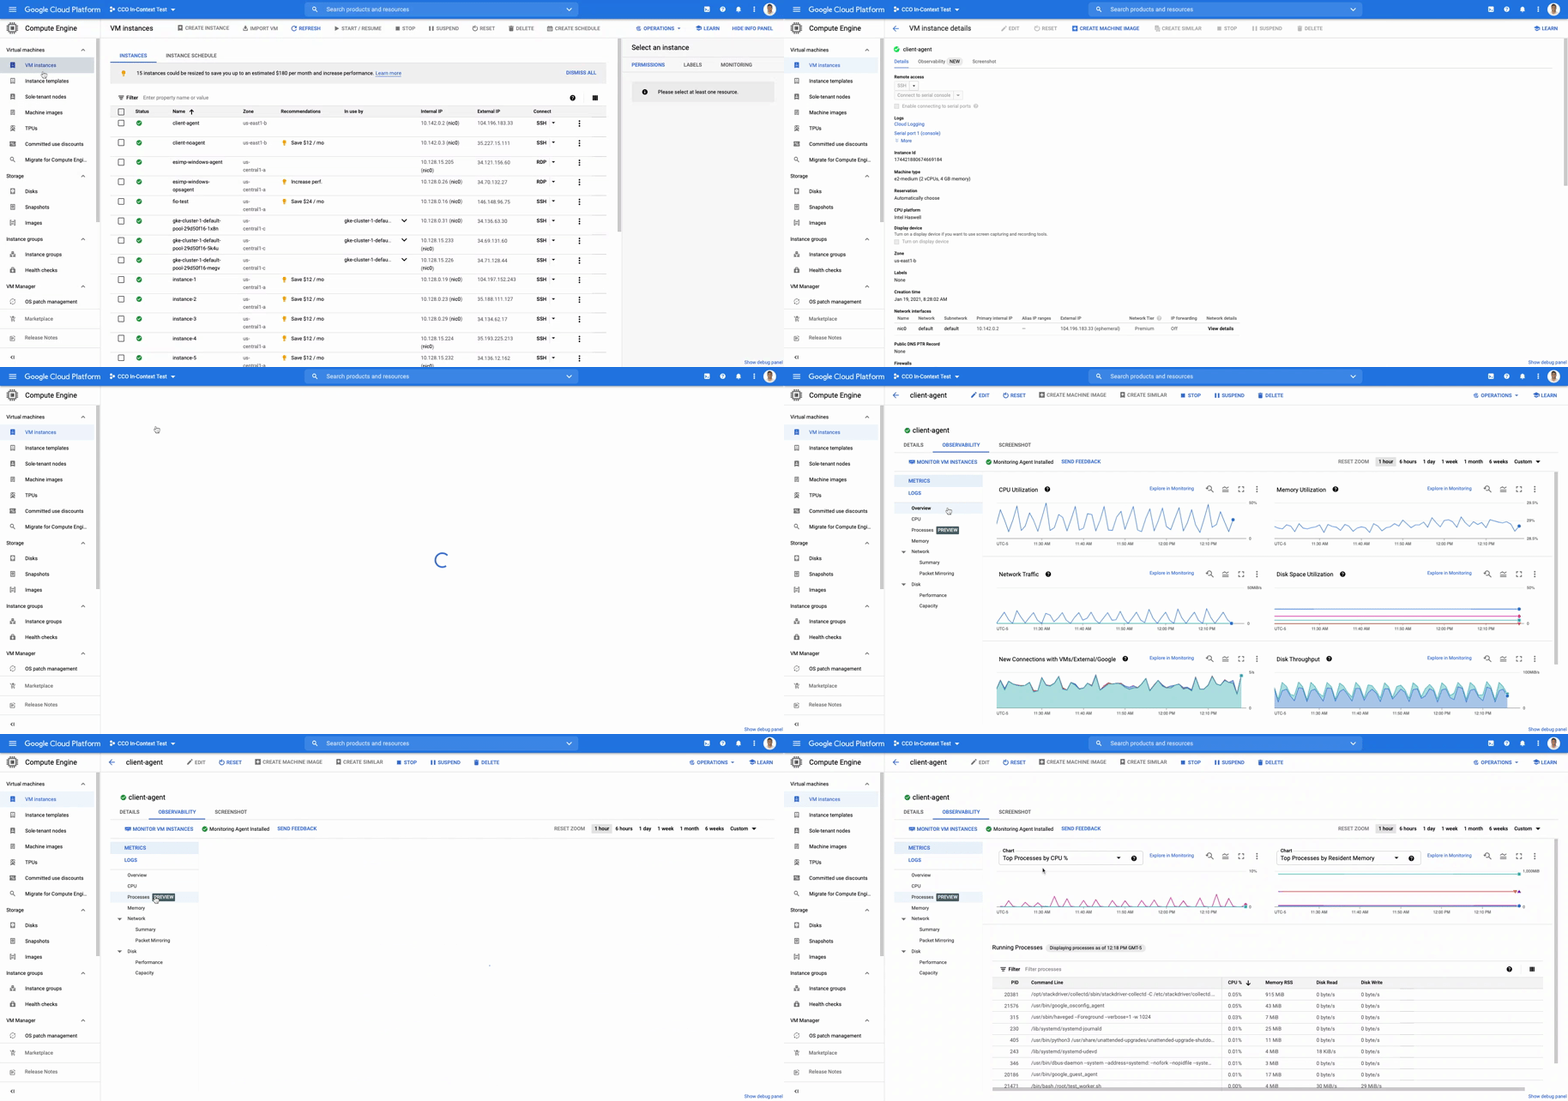

The navigation is simple. Once you have the Ops Agent or the Cloud Monitoring agent installed in your VMs:
Go to the Compute Engine console page and click on VM Instances
Select the VM that you want to investigate
In the navigation menu on the top, click Observability
Click on Metrics
Lastly, click on Processes
In the window on the right you will see a chart and a table with all of the processes in your VM. You can also filter by time frame and sort by name or value. You do not need to do anything, other than have the agent installed, for the process to be detected and displayed.
Fleet-wide metrics monitoring
Cloud Monitoring gives you a look across your fleet of VMs so you can identify the aggregated usage of resources by processes. This level of broad, yet granular, insight can drive your decisions around which software to run or how many VMs you need to optimally power your apps and services. Admins can perform a cost-savings analysis if they determine that certain processes are slowing down the work of a large number of VMs. The larger numbers of less powerful VMs can be replaced by fewer, more capable VMs.
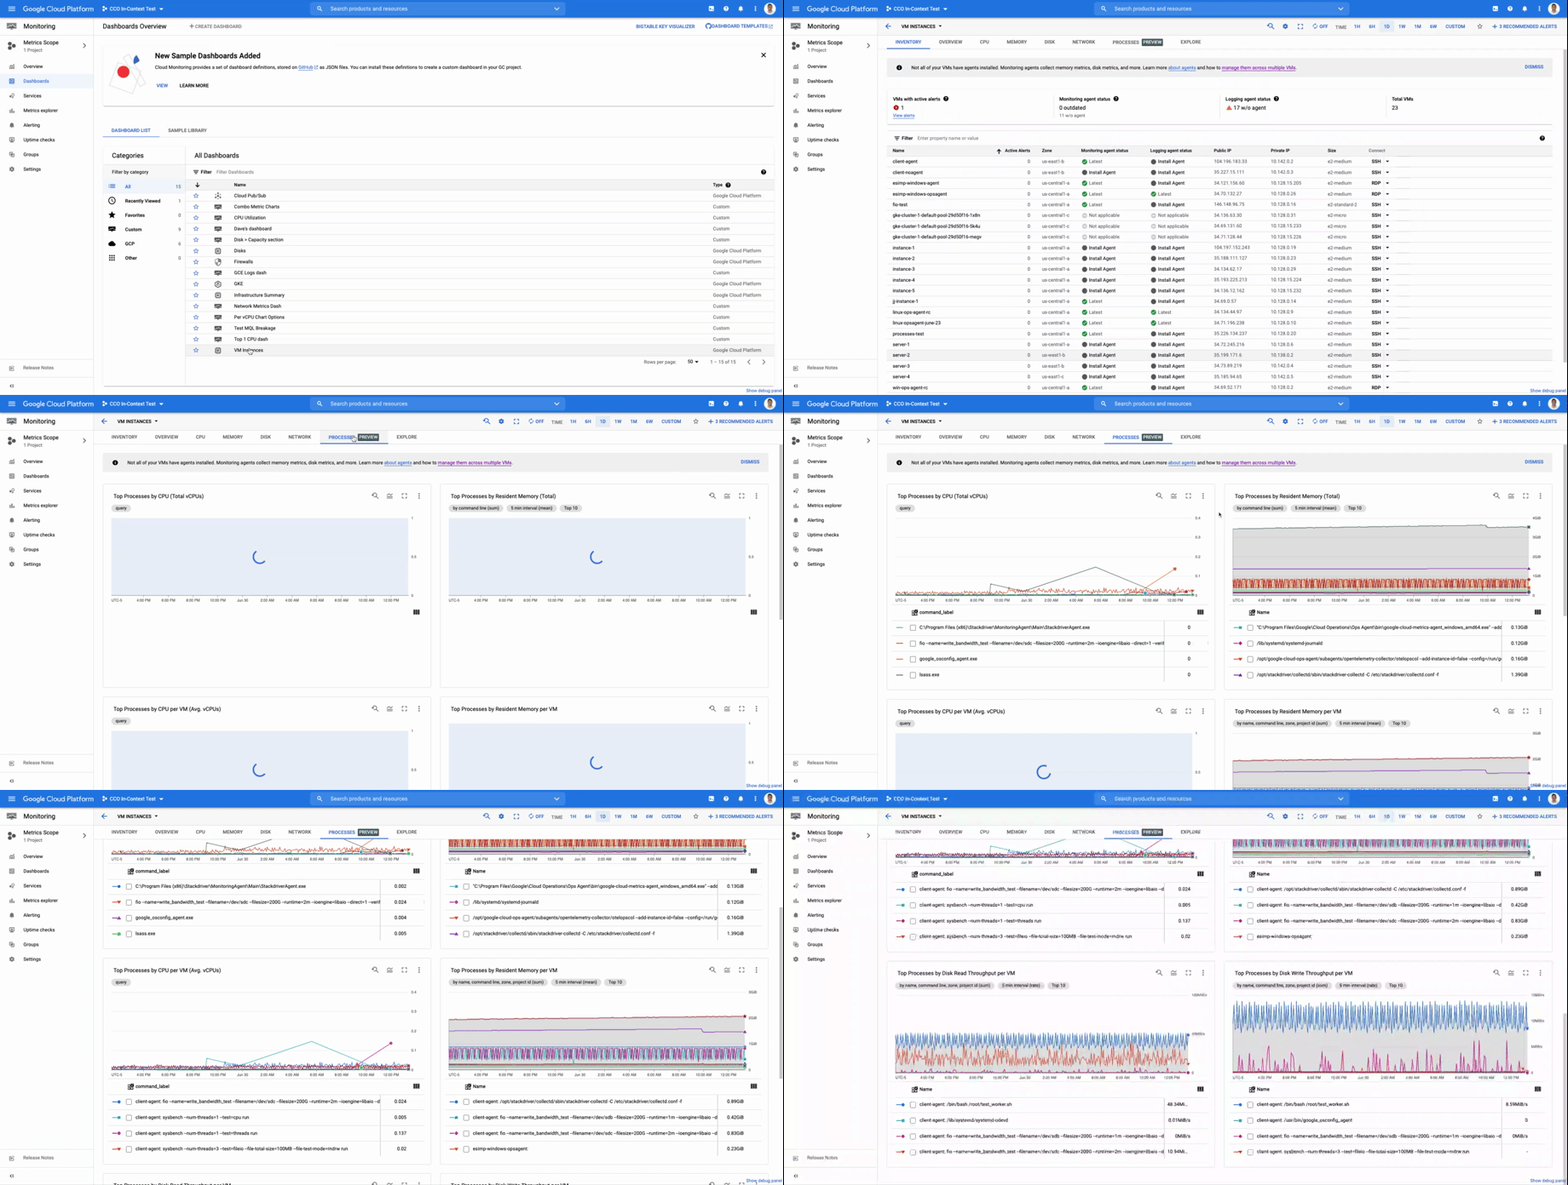
To get this fleet-wide view:
Navigate to Cloud Monitoring
Click Dashboards in the left menu
In the All Dashboards list, click on VM Instances
Towards the top of the window, click on Processes
This provides many charts detailing the processes running across your fleet of VMs.

Get started today
To start identifying and monitoring your process metrics, you must first install the Ops Agent, or have installed the legacy Cloud Monitoring agent. Once that is complete, the process metrics data will automatically be ingested into Cloud Monitoring and the VM admin console.
If you have any questions, or to join the conversation with other developers, operators, DevOps, and SREs, visit the Cloud Operations page in the Google Cloud Community.
