Monitor and troubleshoot your VMs in context for faster resolution
Haskell Garon
Sr. Product Manager
Dave Raffensperger
Staff Software Engineer
Try Google Cloud
Start building on Google Cloud with $300 in free credits and 20+ always free products.
Free trialTroubleshooting production issues with virtual machines (VMs) can be complex and often requires correlating multiple data points and signals across infrastructure and application metrics, as well as raw logs. When your end users are experiencing latency, downtime, or errors, switching between different tools and UIs to perform a root cause analysis can slow your developers down. Saving time when accessing the necessary data, deploying fixes, and verifying those fixes can save your organization money and keep the confidence of your users.
We are happy to announce the general availability of an enhanced “in-context” set of UI-based tools for Compute Engine users to help make the troubleshooting journey easier and more intuitive. From the Google Console, developers can click into any VM and access a rich set of pre-built visualizations designed to give insights into common scenarios and issues associated with CPU, Disk, Memory, Networking, and live processes. With access to all of this data in one location, you can easily correlate between signals over a given timeframe.
Bringing more operations data to your VMs
A collection of high-level metrics has always been available in the Compute Engine console page. However, your feedback let us know that you still had to navigate between different tools to perform a proper root cause analysis. For example, seeing that CPU utilization peaked during a certain time frame might be a helpful starting point, but resolving the issue will require a deeper understanding of what is driving the utilization. Furthermore, you will want to correlate this data with processes, and other signals such as I/O wait time versus user space versus kernel space.
With this in mind, we added metrics, charts, and a variety of new visualizations to the Compute Engine page, many requiring zero setup time. Some of these new additions are populated with in-depth metrics provided by the Google Cloud Ops Agent (or legacy agents if you’re currently using them), which can easily be installed via Terraform, Puppet, Ansible or an install script.
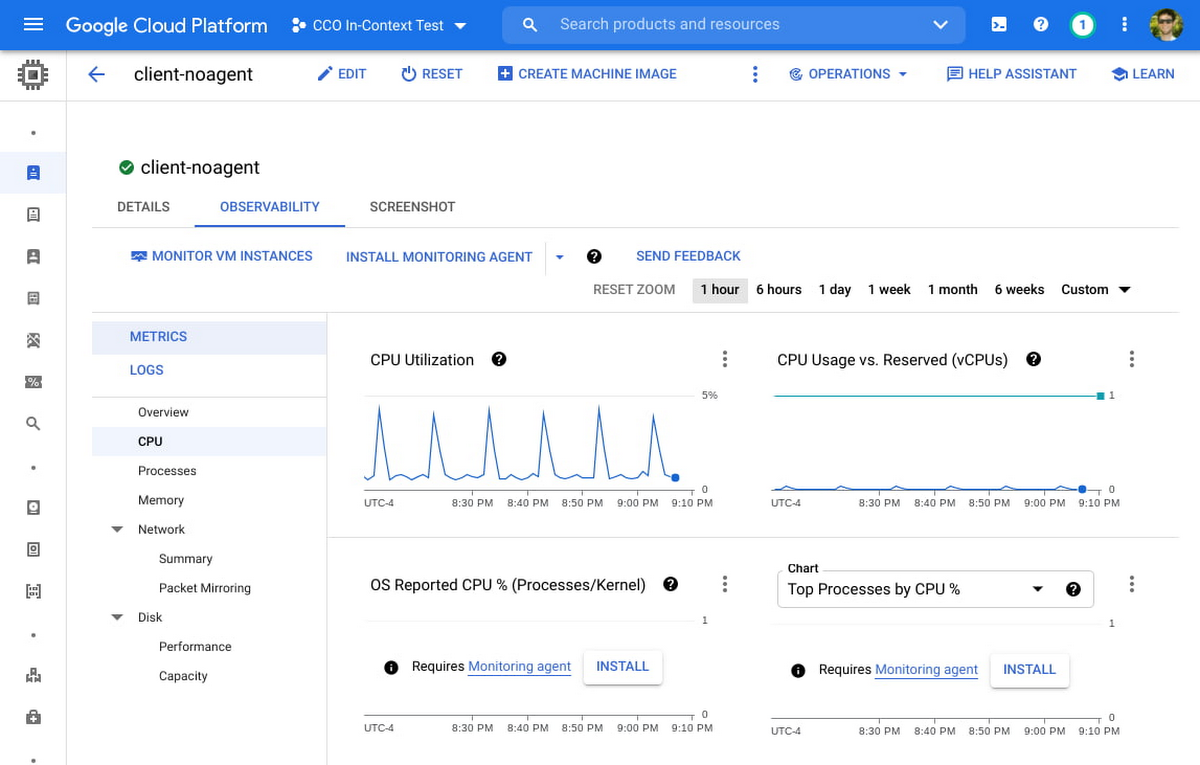

New charts that leverage the metrics from the Ops Agent include: CPU utilization as reported by the OS, Memory Utilization, Memory breakdown by User, Kernel, and Disk Cache, I/O Latency, Disk Utilization and Queue Length, Process Metrics, and many more.
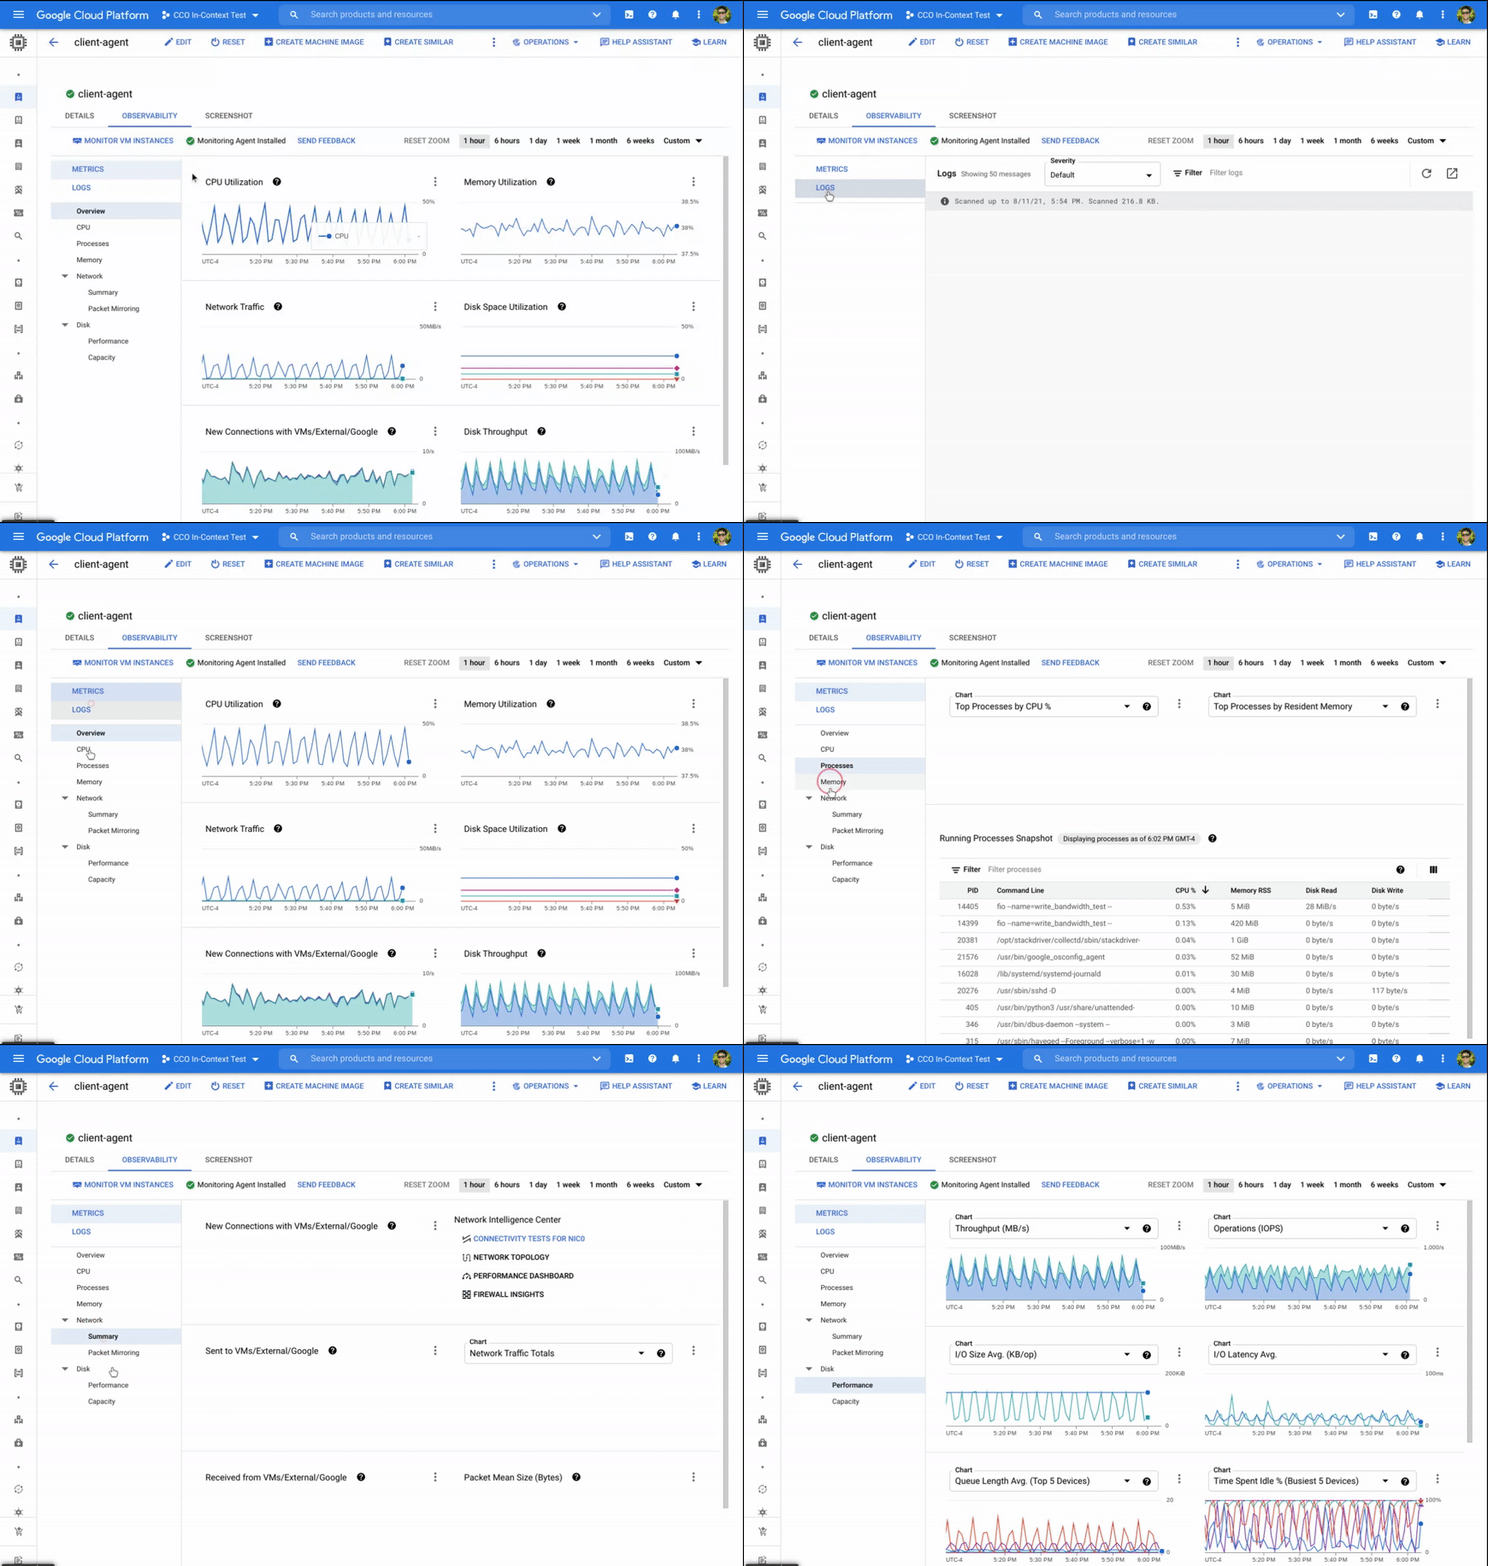

While no single troubleshooting journey fits all needs, this enhanced set of observability tools should make the following scenarios faster and more intuitive:
Identifying networking changes via metrics and logs. By comparing unexpected increases in network traffic, network packet size, or spikes in new network connections against logs by severity, developers might identify a correlation between this traffic increase and critical logs errors. By further navigating to the Logs section of the tools, one can quickly filter to critical logs only and expand sample log messages to discover detailed logs around timeout messages or errors caused by the increased load. Deep links to the Logs Explorer filtered to the VM of interest allows for fast and seamless navigation between Compute Engine and Cloud Logging.
Determining the impact of specific processes on utilization. By comparing times of high CPU or memory utilization against top processes, operators can determine whether a specific process (as denoted by command line or PID) is over-consuming. They can then refactor or terminate a process altogether, or choose to run a process on a machine better suited for its compute and memory requirements. Alternatively, there may be many short-lived processes that do not show up in the processes snapshot, but are visible as a spike in the Process Creation Rate chart. This can lead to a decision to refactor so that process duration is distributed more efficiently.
Choosing appropriate disk size for workloads. A developer may notice that the "Peak 1-second IOPS" have begun to hit a flat line, indicating the disk is hitting a performance limit. If the "I/O Latency Avg" also shows a corresponding increase, this could indicate that I/O throttling is occurring. Finally, breaking this down the Peak IOPS by Storage Type, one might see that Persistent Disk SSD is responsible for the majority of the peak IOPS, which could lead to a decision to increase the size of the disk to get a higher block storage performance limit.
Security Operations and Data Sovereignty. Operators may be in charge of enforcing security protocols around external data access, or creating technical architecture for keeping data within specific regions for privacy and regulatory compliance. Using the Network Summary, operators can determine at a glance whether a VM is establishing connections and sending traffic primarily to VMs and Google services within the same project, or whether connections and traffic ingress / egress may be occurring externally. Likewise, operators can determine whether new connections are being established or traffic is being sent to different regions or zones, which may lead to new protocols to block inter-region data transfer.
Cost optimization via networking changes. A developer may notice that the majority of VM to VM traffic is being sent inter-region, as opposed to traffic remaining in the same region. Because this inter-region traffic is slower and is charged at an inter-region rate, the developer can choose to reconfigure the VM to communicate instead with local replicas of the data it needs in its same region, thus reducing both latency and cost.
Measuring and tuning memory performance. The Ops Agent is required for most VM families to collect memory utilization. By examining the memory usage by top processes, a developer may detect a memory leak, and reconfigure or terminate the offending process. Additionally, an operator may examine the breakdown of memory usage by type and notice that disk cache usage has hit the limit of using all memory not in use by applications, correlating with an increase in disk latency. They may choose to upsize to a memory-optimized VM to allow enough memory for both applications and disk caching.
These are just a few of the use cases where your team may leverage these new capabilities to spend less time troubleshooting, optimize for costs, and improve your overall experience with Compute Engine.
Get Started Today
To get started, navigate to Compute Engine > VM Instances, click into a specific VM of interest, and navigate to the Observability tab. You can also check out our developer docs for additional guidance on how to use these tools to troubleshoot VM performance, and we recommend installing the Ops Agent on your Compute Engine VMs to get the most out of these new tools. If you have specific questions or feedback, please join the discussion on our Google Cloud Community, Cloud Operations page.
