Creating Spring-based gRPC microservices managed by Prometheus and Grafana
Feng Li
Software Engineer, Google
Vindhya Ningegowda
Software Engineer, Google
gRPC is a modern open-source, high-performance Remote Procedure Call (RPC) framework that plays a critical role in efficiently connecting microservices. Spring, meanwhile, is a popular framework that provides a flexible, modular programming model, comprehensive infrastructure integrations with a rich ecosystem and community support. Imagine if you could use these two popular technologies together? In this blog, we explore integrating gRPC with Spring-based microservices. Then, we also show you how to leverage Google Cloud Managed Service for Prometheus and Grafana for effective monitoring and observability, enabled by new gRFC A66 metrics.
Integrate gRPC with Spring Boot
There are a few open source efforts that provide the integration between gRPC and Spring; one of them is grpc-ecosystem/grpc-spring. Essentially, it’s a Spring Boot module to help set up the generated gRPC client/server by providing Spring style, declarative annotations and configurations.
Briefly, to create gRPC/Spring microservices, the author needs to:
-
Create a Spring Boot application
-
Add the grpc-spring-boot-starter (provided by grpc-ecosystem/grpc-spring) as a dependency
-
Follow the gRPC development guide to
-
-
Define the service proto
-
Generate the gRPC(Java) artifacts and add them as dependencies
-
Implement the gRPC(Java) service by implementing the generated interface
-
-
-
Annotate the service implementation with @GrpcService
-
Inject the client with @GrpcClient
For detailed documentation, please refer to: https://grpc-ecosystem.github.io/grpc-spring
How the observability data is produced and collected
With the Spring integration, the gRPC library collects the metrics defined in the gRFC A66 specification. And later on, it can be configured to be exposed and scraped by a monitoring backend, such as Prometheus.
Managed Service for Prometheus is Google Cloud's fully managed, multi-cloud, cross-project solution for Prometheus metrics. We can easily configure it to scrape the Prometheus metrics from the URL we set on the gRPC/Spring microservices (/actuator/prometheus demonstrated in the above configuration).
How the observability data is consumed
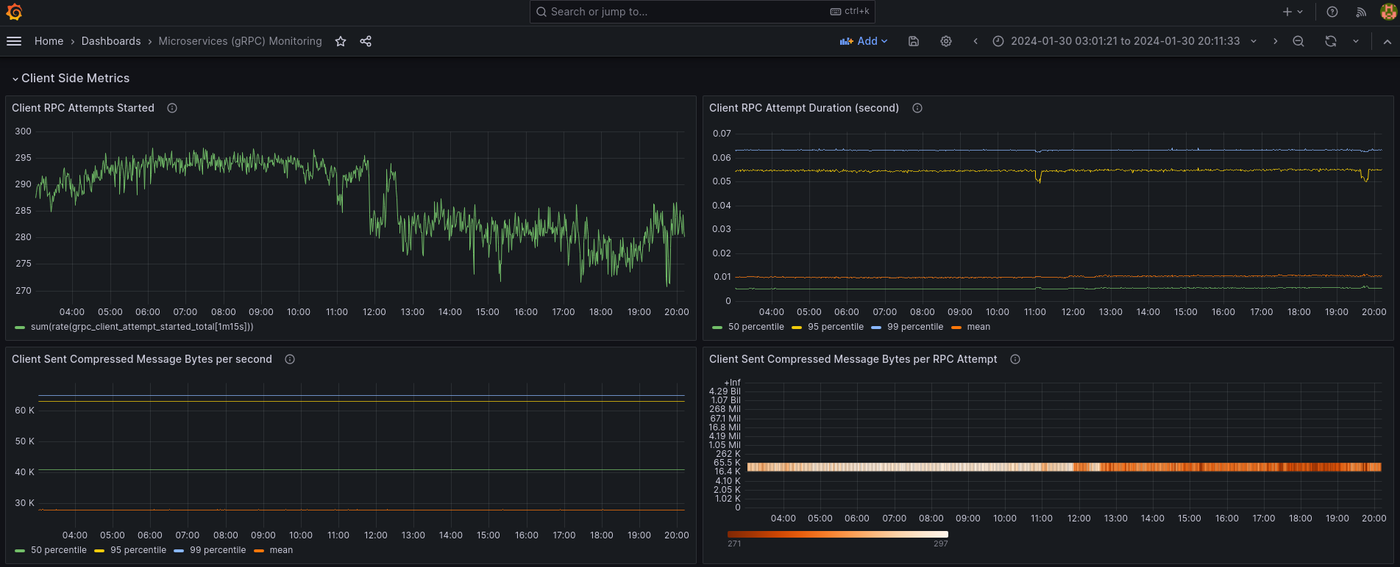
Once the gRPC metrics are collected by Managed Service for Prometheus, they can be queried not only via Cloud Monitoring Metrics Explorer, but also by third-party visualization tools such as Grafana using PromQL. We provide a predefined Grafana dashboard for gRFC A66 metrics under grpc-ecosystem/grpc-spring github repo, which you can easily import to Grafana and customize.
Connecting everything together
The grpc-ecosystem/grpc-spring repo provides a concrete example to demonstrate the end-to-end user experience, including following components:
-
A gRPC/Spring microservice as the client
-
A gRPC/Spring microservice as the server
The overall architecture looks like this:
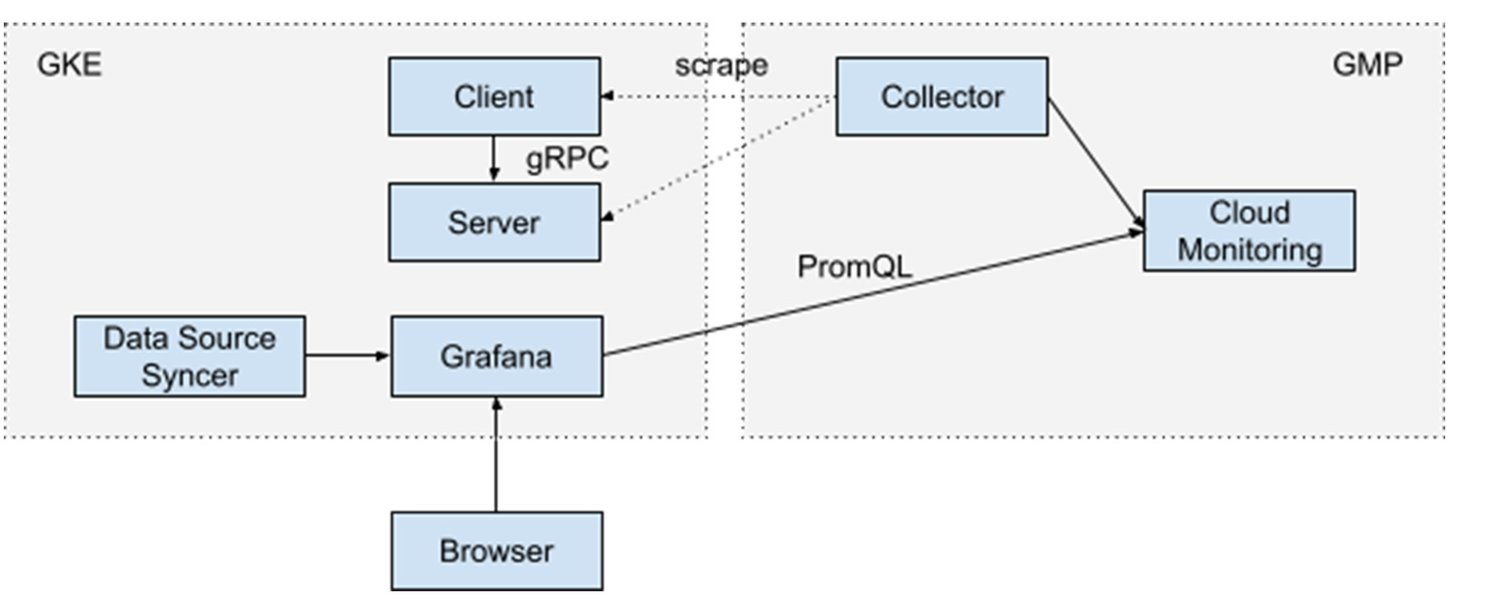
The workflow proceeds as follows:
1. The client makes gRPC calls to the server, with APIs supporting the following semantics:
-
-
Unary RPC
-
Client Streaming RPC
-
Server Streaming RPC
-
Bidirectional Streaming RPC
-
2. The client keeps making RPC calls until it reaches a satisfactory number of queries per second (QPS).
3. The server randomly injects a small percentage of errors, for demonstration purposes.
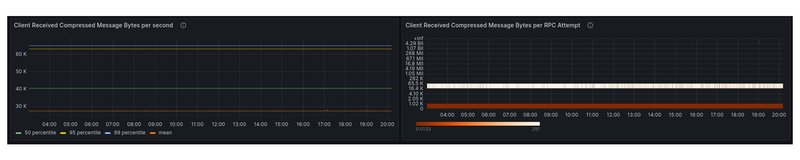
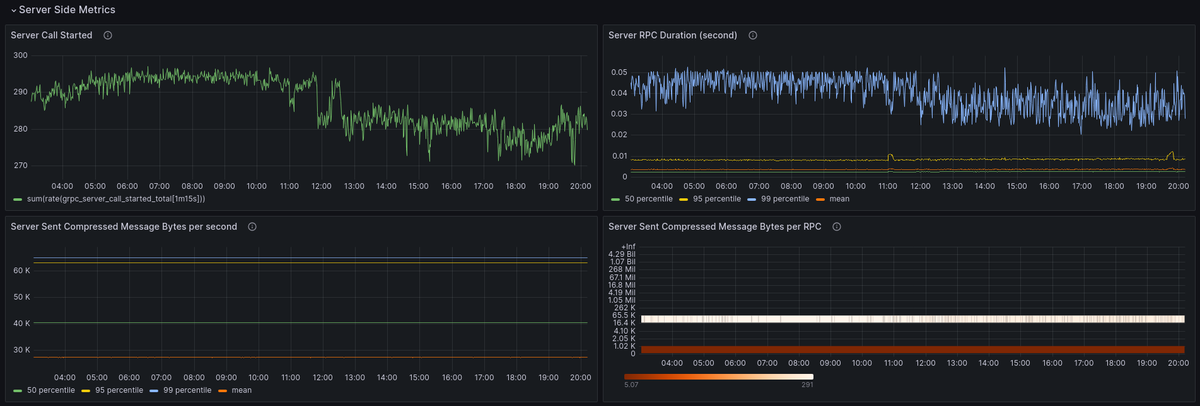
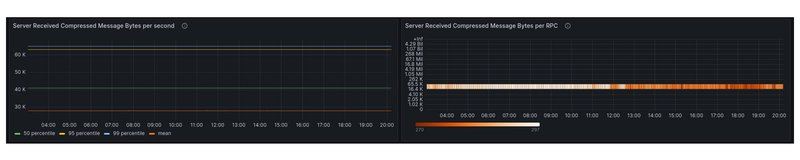
4. Finally, both the client and server enable gRPC A66 metrics generation and expose them with Prometheus.
Then, to create a Prometheus data source in Grafana, follow the Grafana / Managed Prometheus user guide.
The example also provides a gRPC A66 metrics dashboard that can be imported to Grafana.
Getting started
To learn more about gRPC/Spring integration, please check out github.com/grpc-ecosystem/grpc-spring.
To learn more about gRPC/Spring integration with Managed Service for Prometheus example, please see github.com/grpc-ecosystem/grpc-spring/examples/grpc-observability.