Track your Cloud Monitoring uptime checks in the Google Cloud mobile app
Kamil Brzezinski
Product Manager, Google Cloud mobile experience
Try Google Cloud
Start building on Google Cloud with $300 in free credits and 20+ always free products.
Free trialWe are pleased to announce the availability of Google Cloud Monitoring uptime checks in the Google Cloud mobile app.
The uptime check capability offered by Cloud Monitoring is a simple yet powerful observability tool to monitor an application's availability and performance on URLs provided by customers. The primary purpose of an uptime check is to track resource availability on an on-going basis. It’s essentially a pulse check for a system and is often the first to detect impending issues. Using uptime checks can proactively detect availability and latency issues with an application and reduce the time and severity your users are impacted by an outage. Uptime check can validate if the response code from your application is as expected, and also the latency of your service from different regions. Uptime checks can further inform your SLAs and SLOs, and track your service’s health over time. SREs at Google use uptime checks as an important part of their daily routine.
Given the critical role served by uptime checks, we heard your feedback on having the ability to track these checks in the Google Cloud mobile app. With this launch SRE’s, operators or administrators can do exactly that, in addition to easily accessing their cloud resources (App Engine, Compute, Databases, Storage), managing permissions using IAM, viewing logs, incidents, errors, and billing.
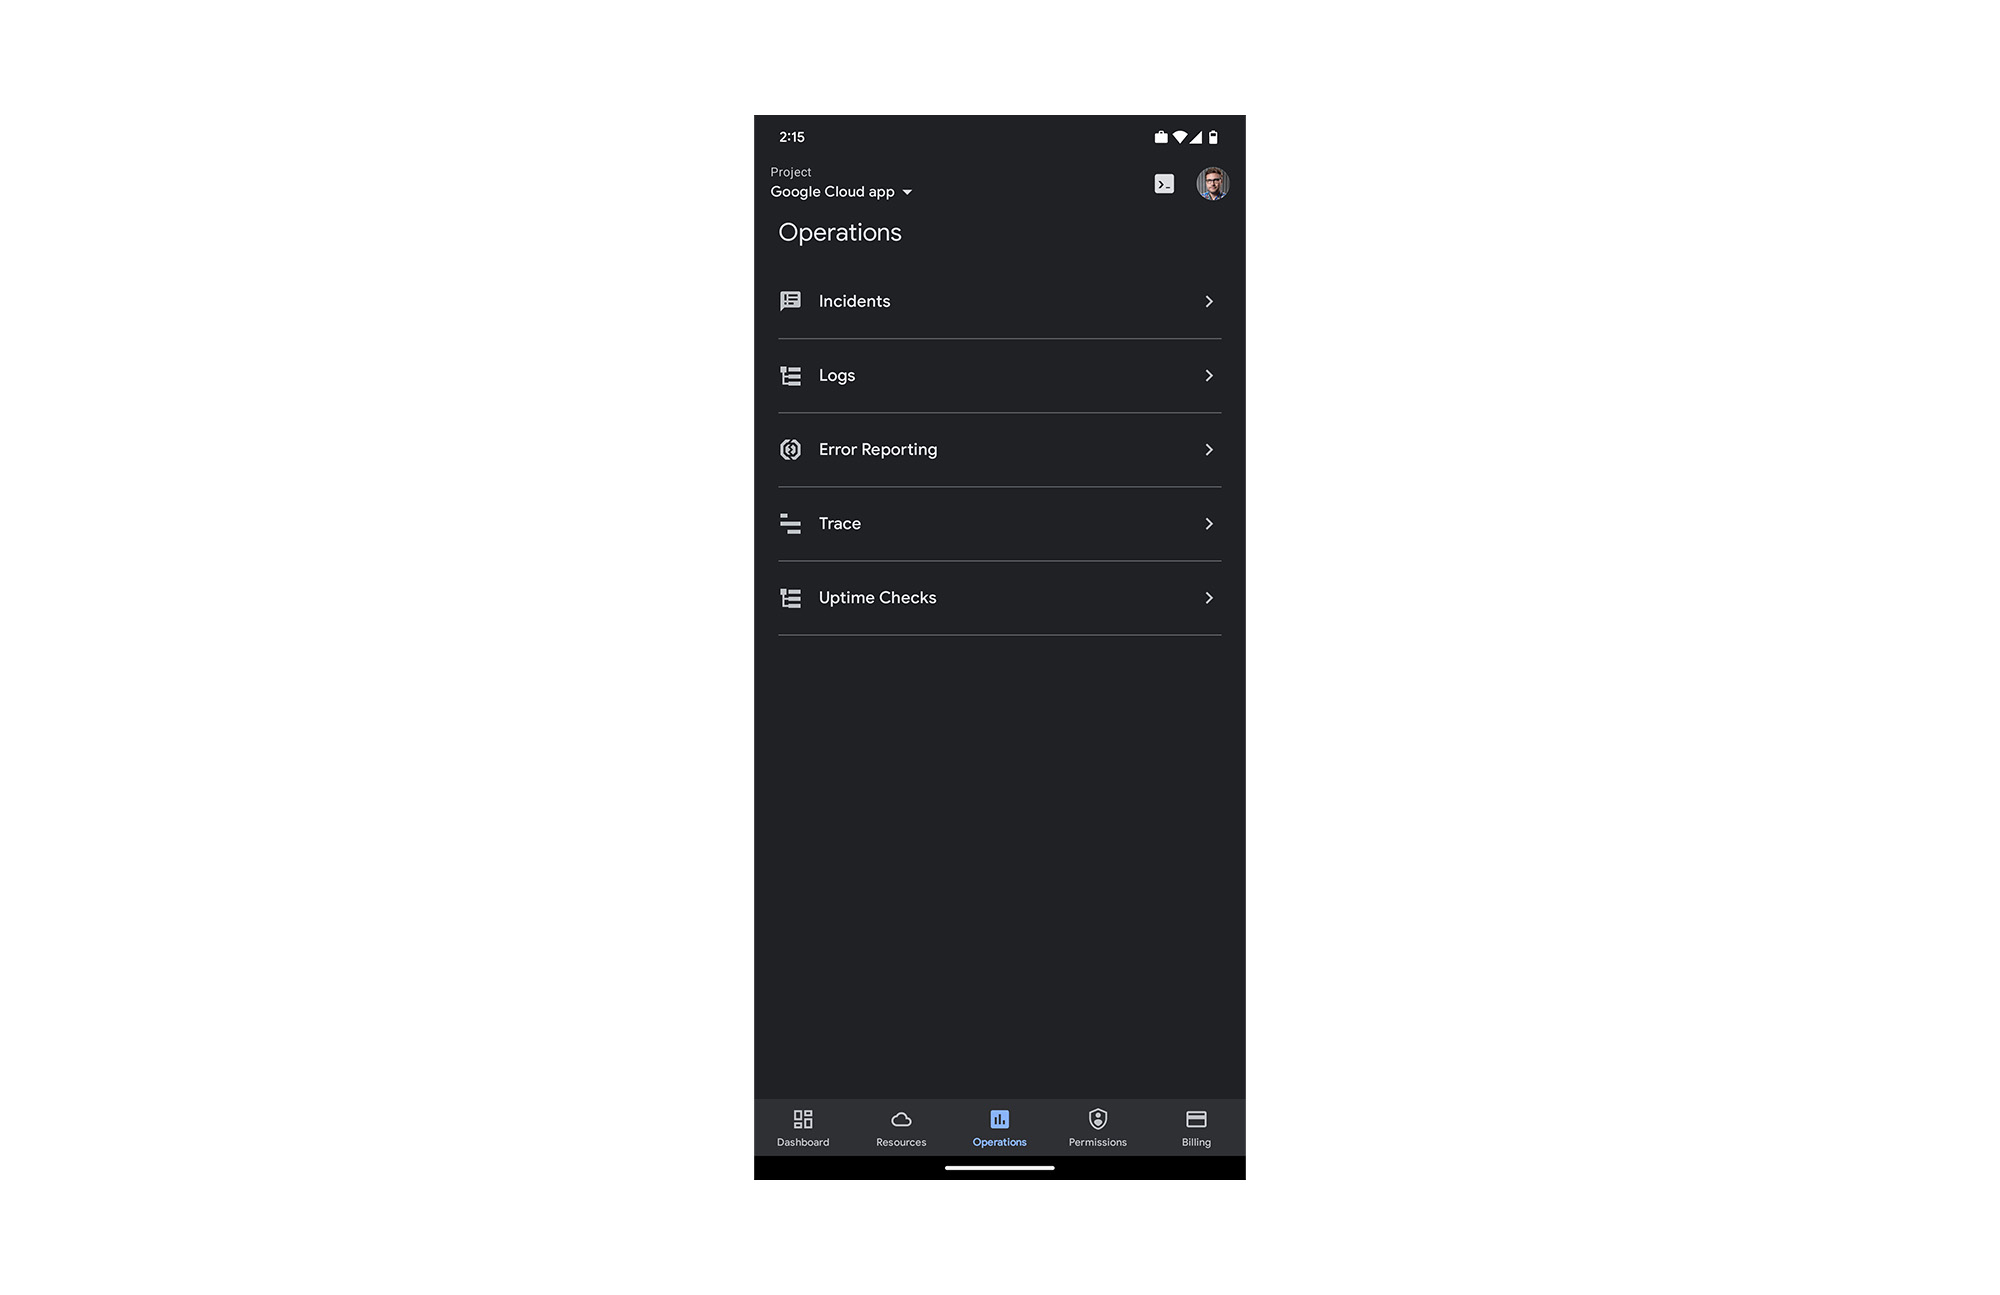
To access uptime checks, simply tap the “Operations” tab in the Google Cloud mobile app on your iOS or Android device.
After navigating to “Uptime Checks”, you will see a list of all the services you have previously added using the Create public uptime check documentation.
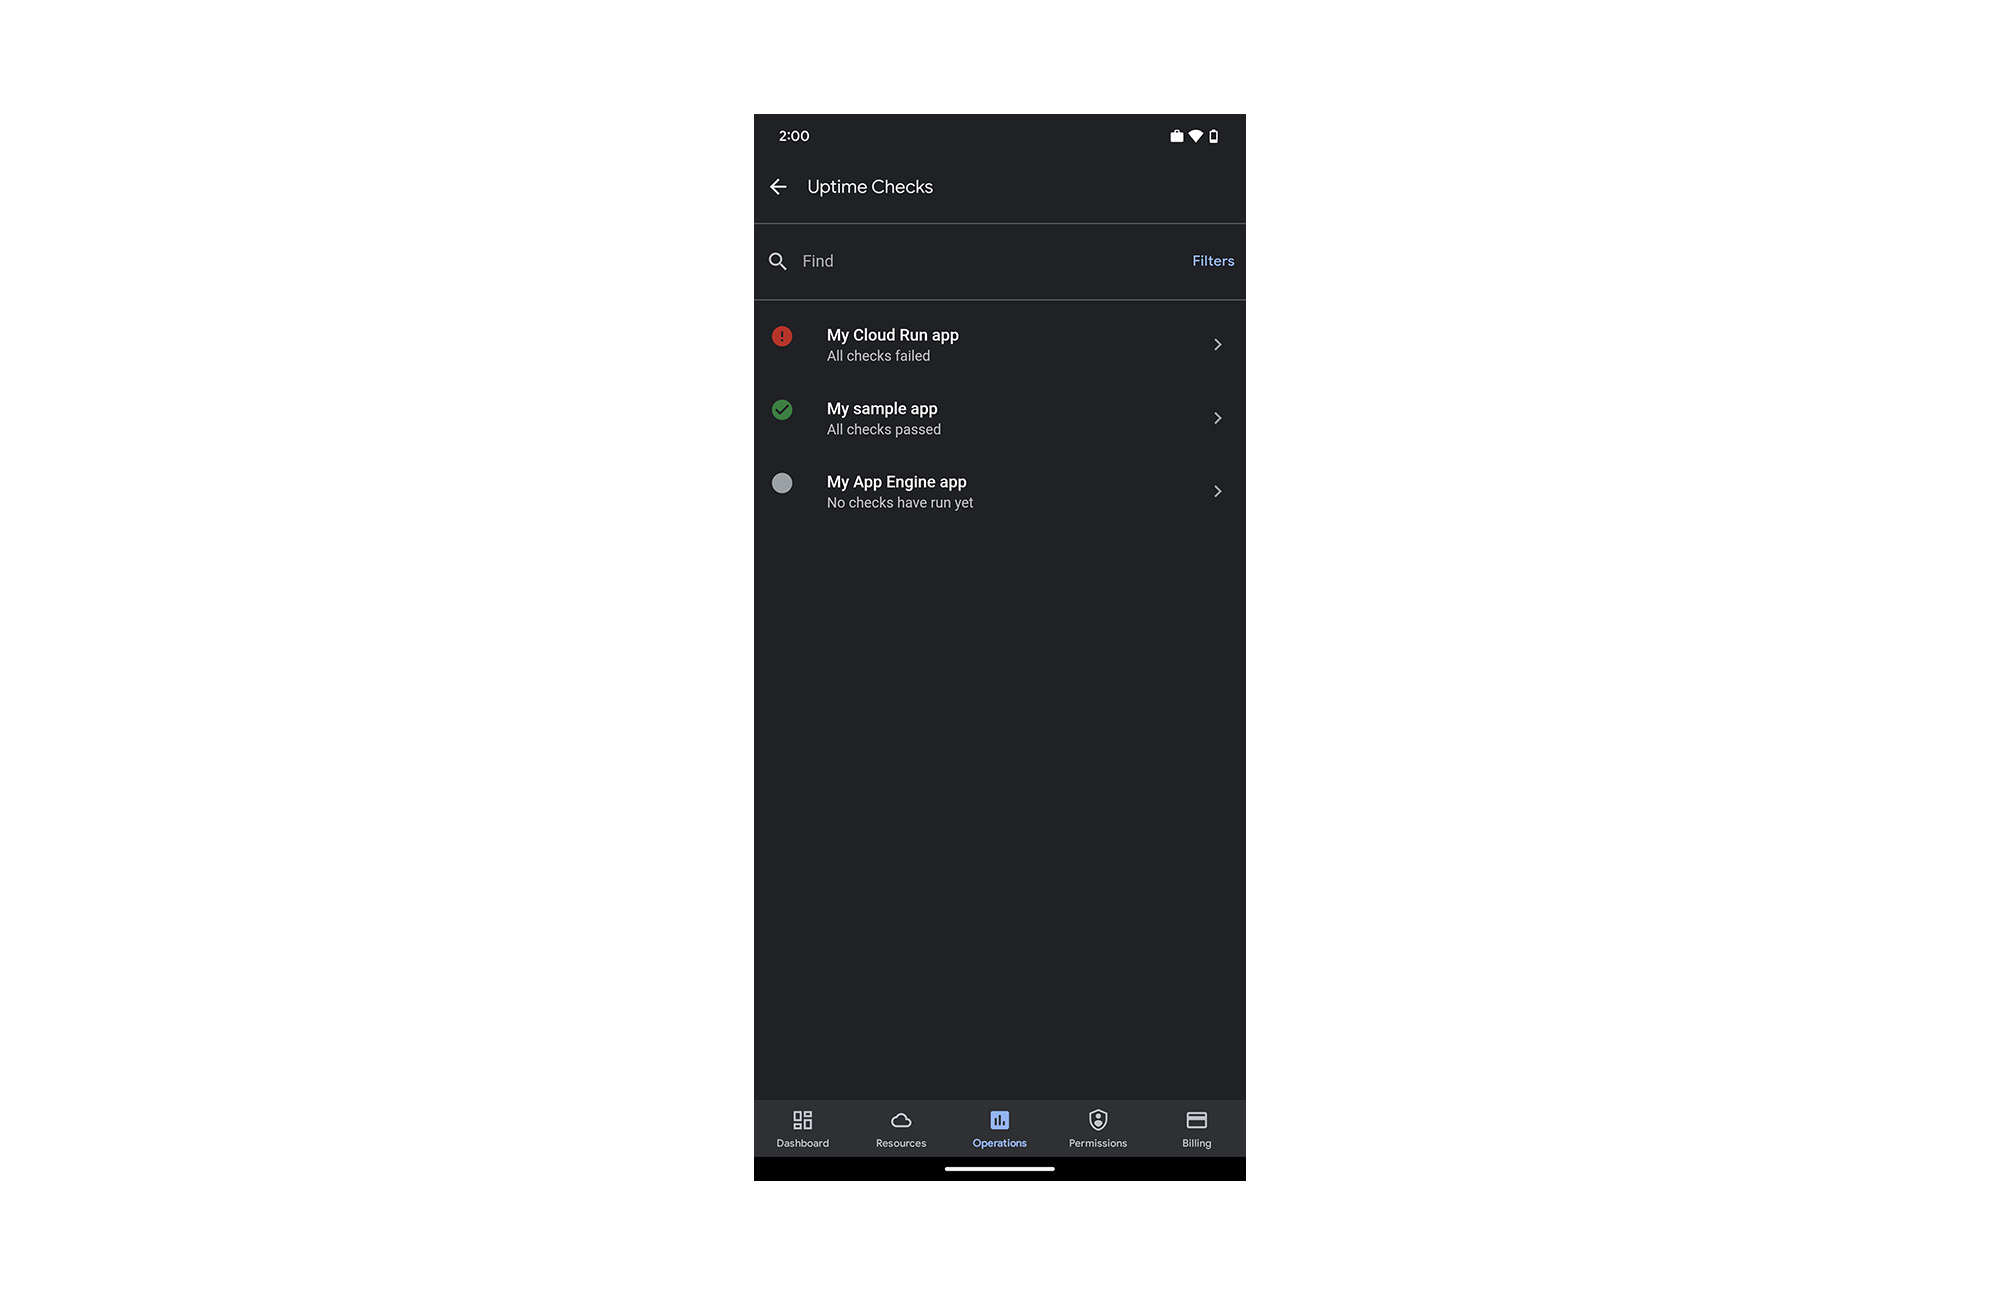
The list is sorted by status, so all failing checks are at the top. You can easily filter by status using the “Filters” option in the top-right corner of the screen.
Tapping any of the uptime checks will take you to the “details”-screen.
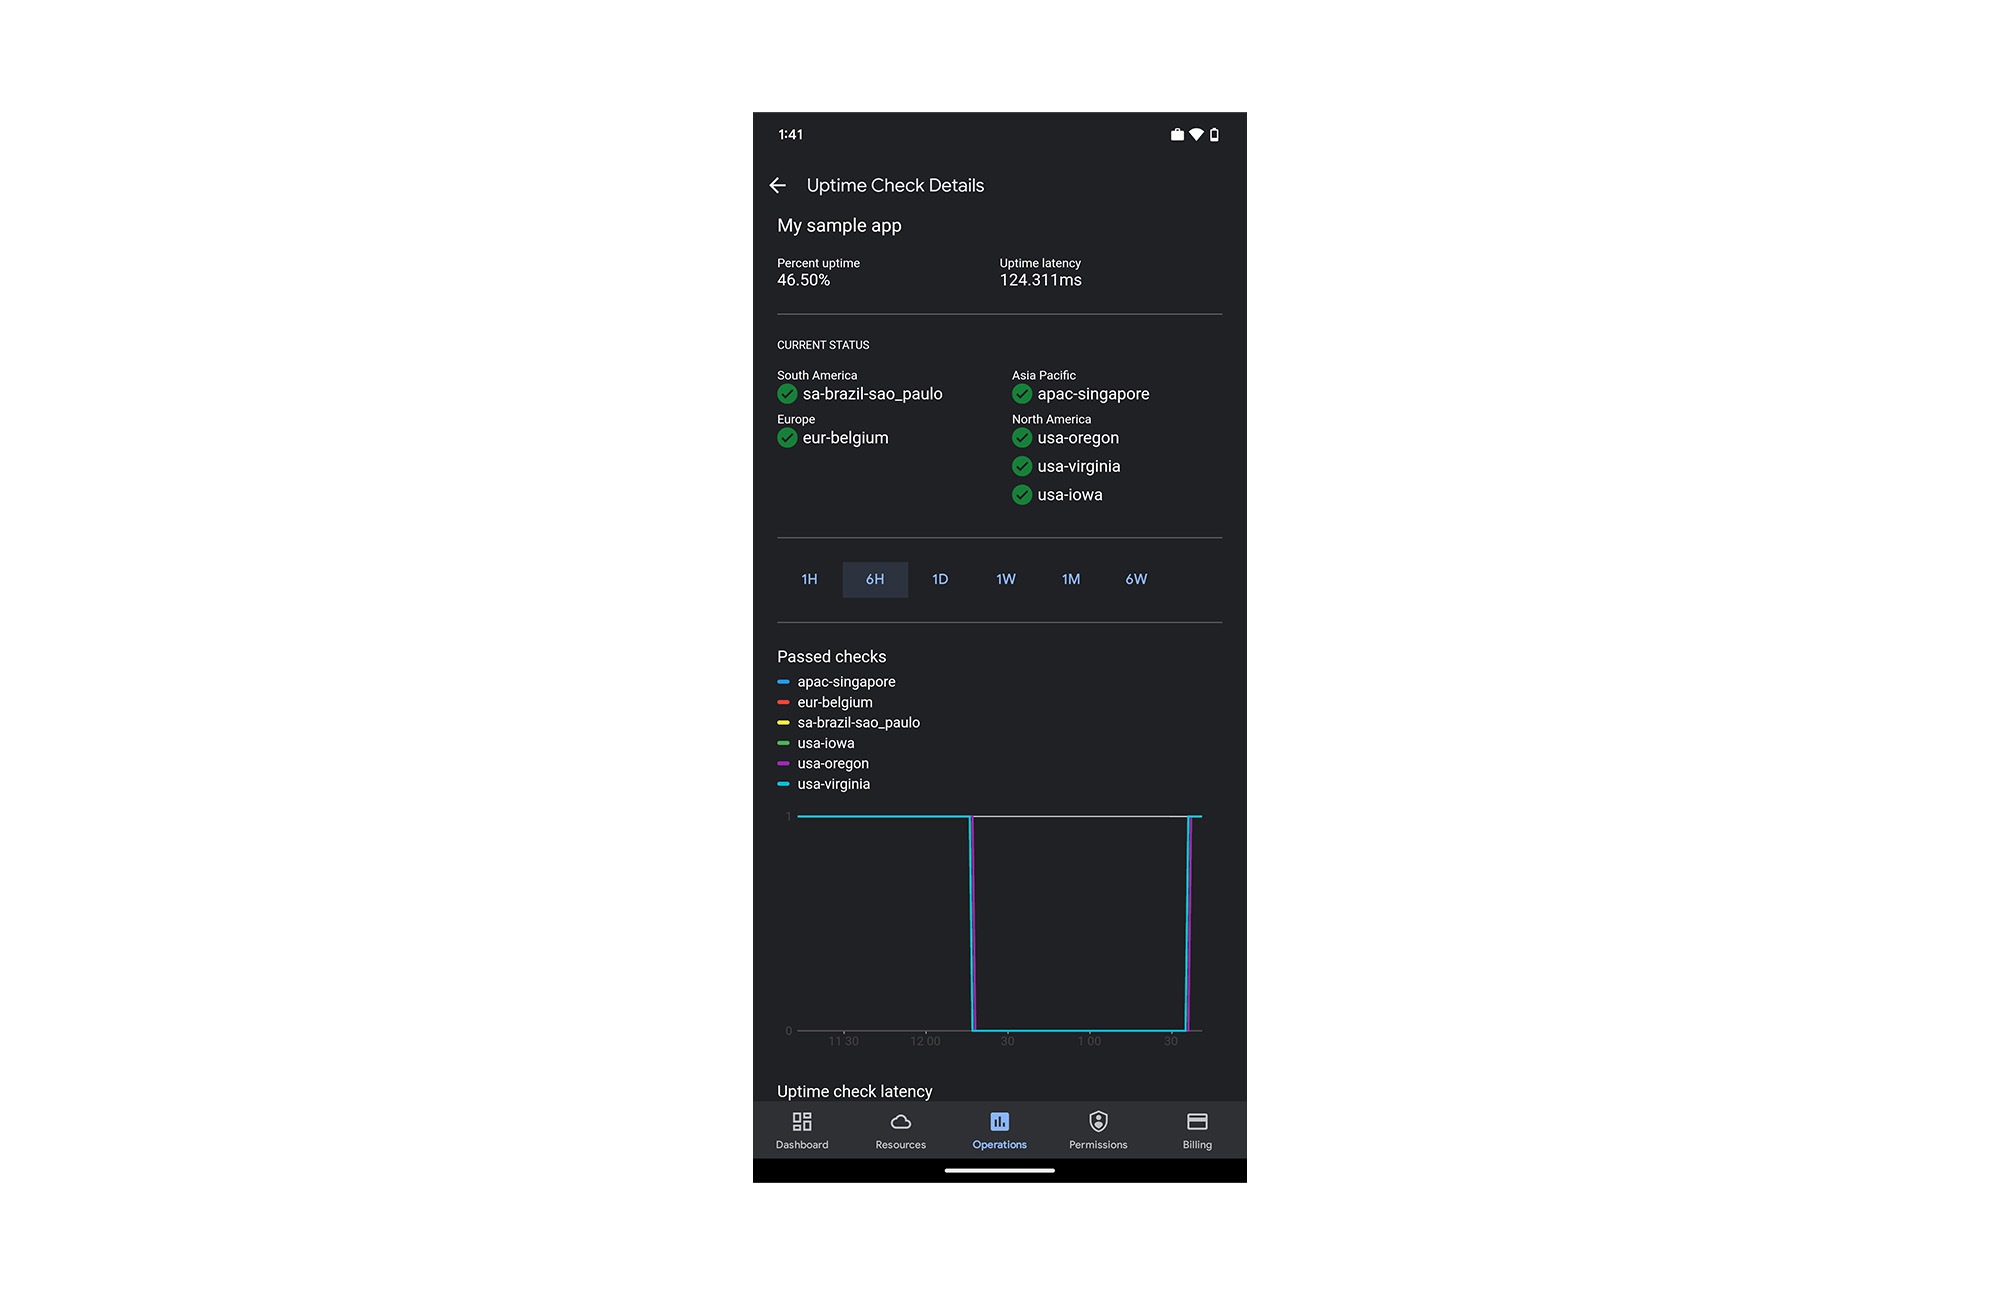
Here you’ll see your application’s uptime, latency, status per region (if you’re monitoring your application from more than one cloud region) and graphs to give you a sneak preview. The “passed check”-graph is showing how many checks passed in the last hour up to 6 weeks. You can easily change the interval using the scale above the graphs.
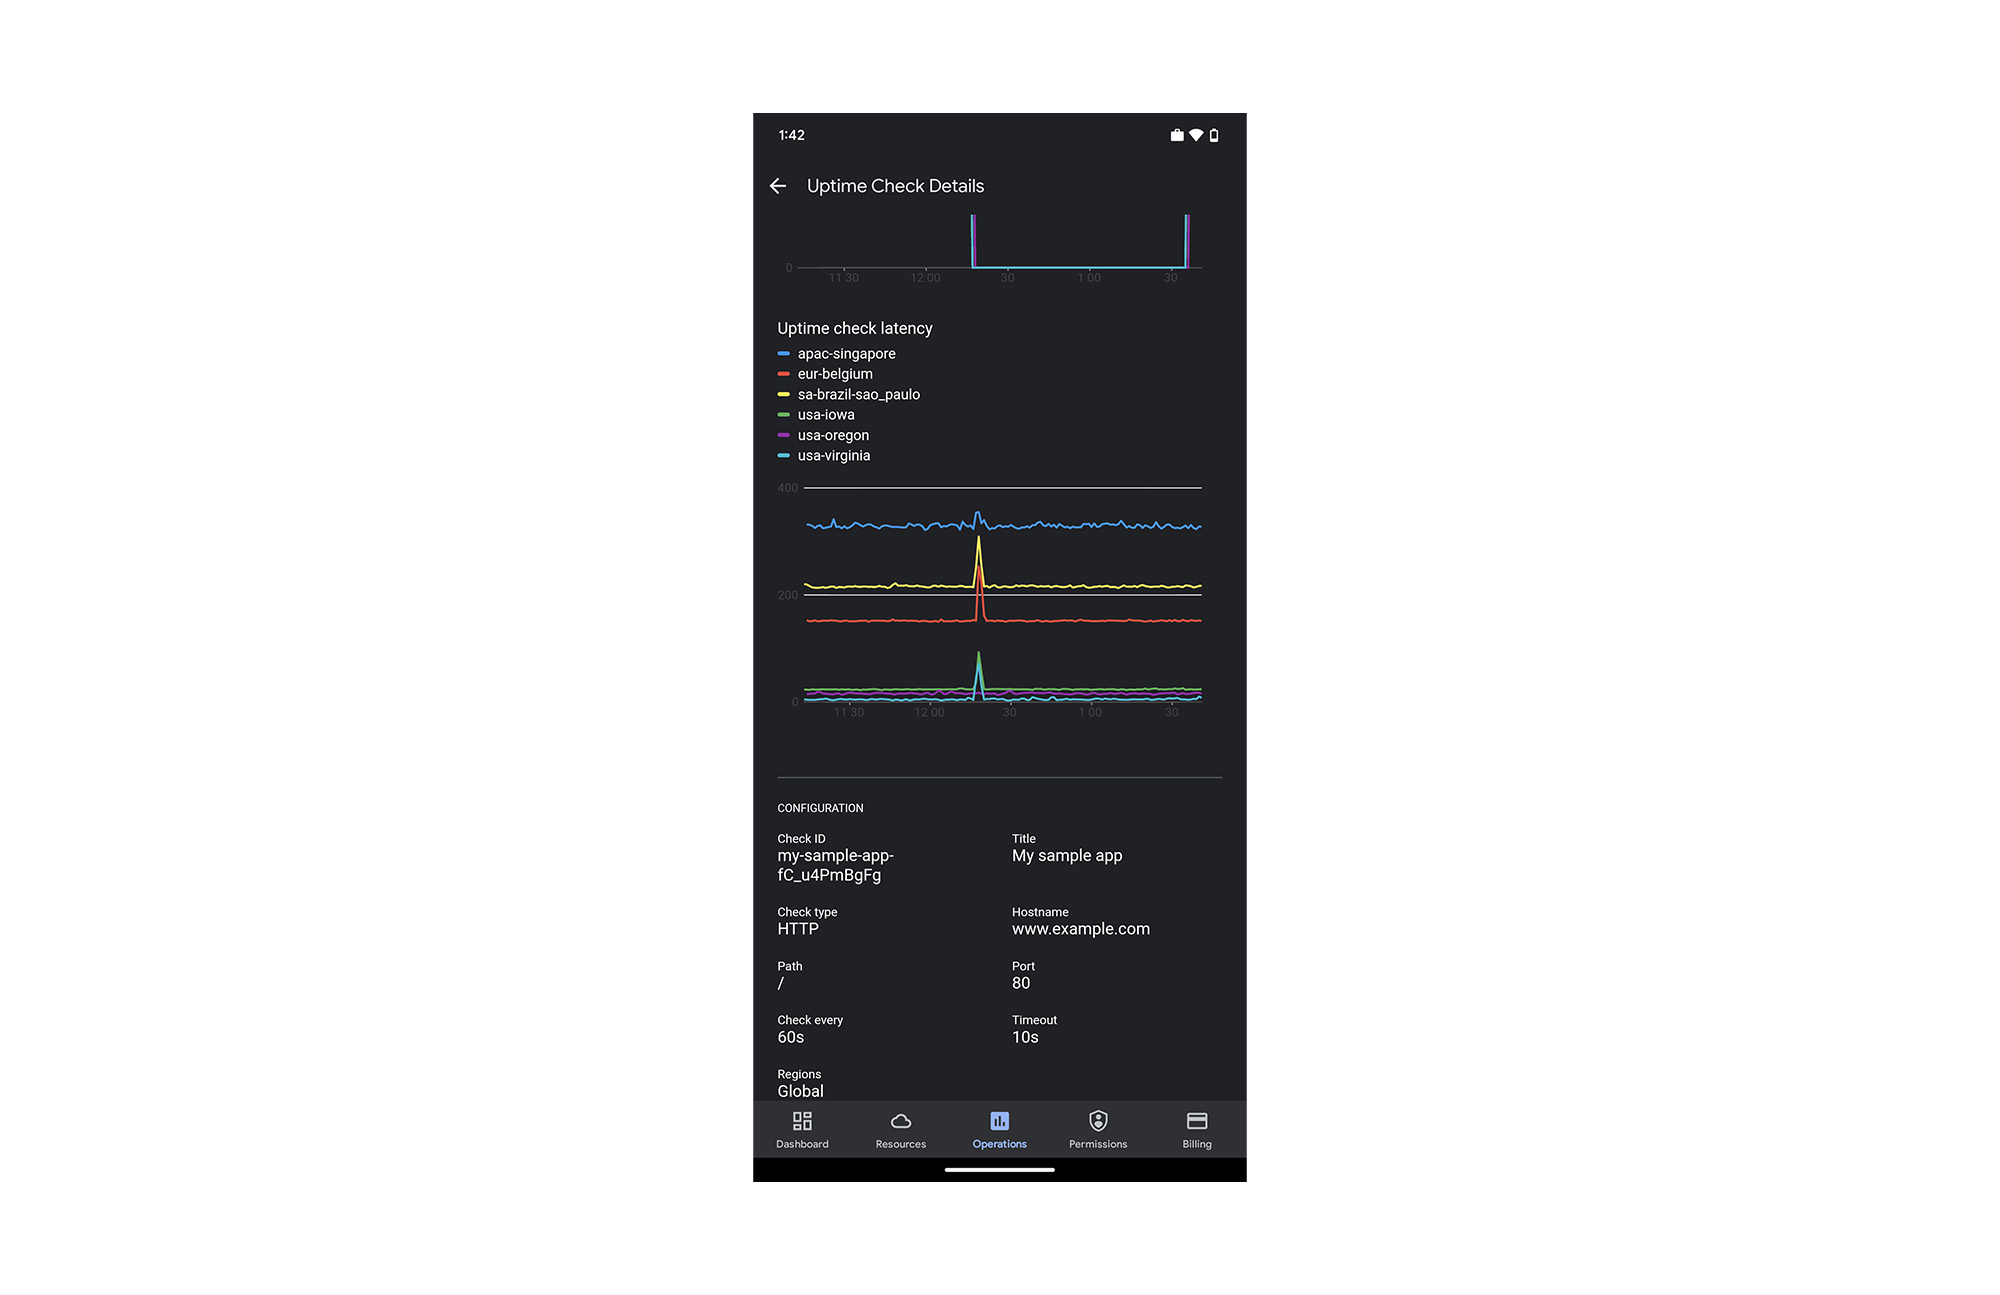
Scroll down the page to see more data. At the bottom of the screen, we’ve included some configuration details for this uptime check, so you can check the above data against this specific setting.
We hope you find this new uptime check feature useful in your daily work. To create new uptime checks, start here: Create public uptime check.
We’re working hard to make the Google Cloud app your companion for monitoring and managing your Google Cloud resources on the go.
For pricing information on uptime checks, please see the Cloud Monitoring pricing summary.
This new feature is available for you to use today. If you have any feedback, we would love to hear from you — just click the “Send feedback” button in the app. And if you don’t have the app – go ahead and download the app today from Google Play or the Apple App Store.