Building a more reliable infrastructure with new Stackdriver tools and partners

Melody Meckfessel
VP of Engineering
Every software organization faces challenges in keeping applications available and running reliably. At Google, we’ve developed and practiced a discipline known as Site Reliability Engineering (SRE). Following SRE practices lets us build and operate services reliably for our billions of users.
Google has about 2,500 Site Reliability Engineers who support both internal and external services. SRE principles lay out a way to establish the right service-level metrics for your organization’s users, and set out prescriptive ways to find and fix issues as they happen. SRE principles also enable a culture of continuous improvement through practices such as blameless postmortems. We’ve heard from many organizations that they want to know how they can hire SREs, use tools to put SRE principles into practice, and achieve better outcomes.
With Google Stackdriver—our monitoring, APM, and logging product—we aim to bring users a complete management toolset based on years of building best practices around systems reliability at Google. These tools are inspired by SRE principles and the goals of reliability and availability.
Today, we’re pleased to introduce a major step in this journey toward observability with the alpha availability of Stackdriver Incident Response and Management (IRM) on Google Cloud Platform (GCP). Stackdriver IRM provides the tools you need to investigate, understand, mitigate, and recover from incidents more quickly and efficiently. You can sign up for the Stackdriver IRM alpha here.
In addition, we’re partnering with Blue Medora and Grafana Labs to deliver new integrations for Stackdriver to help you build your monitoring and reliability toolset.
Stackdriver IRM brings reliability into focus
As we continue to evolve our monitoring tools, we want to make it as easy as possible for you to start or evolve your SRE journey. While implementing SRE into an organization is an in-depth process, tools like Stackdriver IRM are inspired by SRE and the ways it can improve user experience with IT services.
Stackdriver IRM surfaces the violating metric and status of an alert. It incorporates alerting policy documentation and a playbook that shows you how to handle typical cases. And, based on the context of the incident and your environment, it provides insights to highlight key information to accelerate the investigation process.
With Stackdriver IRM, you’ll get:
End-to-end incident lifecycle management for holistic data gathering and analytics.
Codified, SRE-inspired processes for efficient multi-responder incident management, based on emergency response protocols.
Auto-correlation of up-to-date Stackdriver data to extract insights, highlight key information, and speed up your investigation process and reduce mitigation time.
Structure for frequent informal practices (such as tracking theories of what went wrong) to improve contextual awareness and improve the post-mortem generation process.
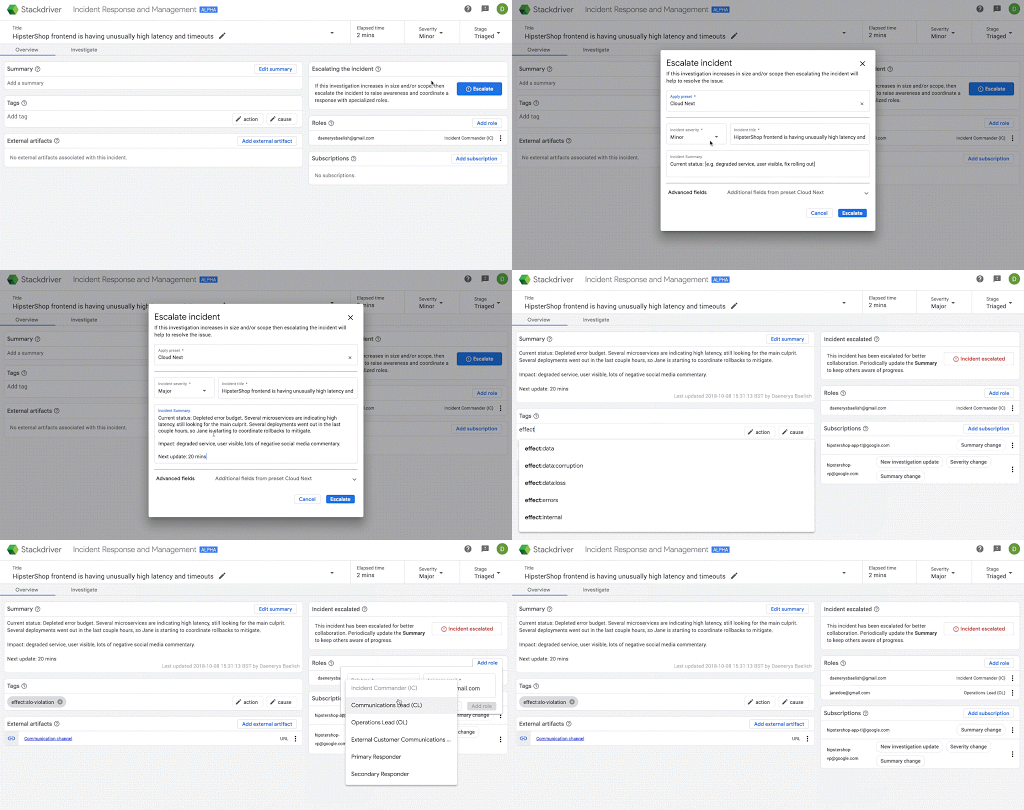
Here’s an example of escalating an incident for more awareness in Stackdriver IRM:

Joining with partners for better visibility, flexibility
Part of being an open cloud is being vendor-agnostic. Stackdriver is a flexible, extensible platform, and we work with partners to bring you integrations that help you view your monitoring data.
With today’s distributed infrastructures, IT teams tasked with site reliability and availability need to rely on a wide array of signals to conduct deep analysis when detecting and triaging an issue. The source of an infrastructure performance problem isn’t always obvious, and signals of a problem may come from many places, including the infrastructure layer, operating systems, networking, services and the application layers.
To tackle this challenge, we’re collaborating with Blue Medora, which offers comprehensive observability for a wide range of resources, including various cloud environments, infrastructure, networking appliances, databases, storage environments, line-of-business applications and more. This means you can extend Stackdriver’s monitoring capability to even more resources and workloads to get comprehensive observability. Blue Medora’s platform offers both extensive and deep observability into the stack underneath your running workloads. This is also an alpha release; please complete this form to express an interest in learning more about these integrations.
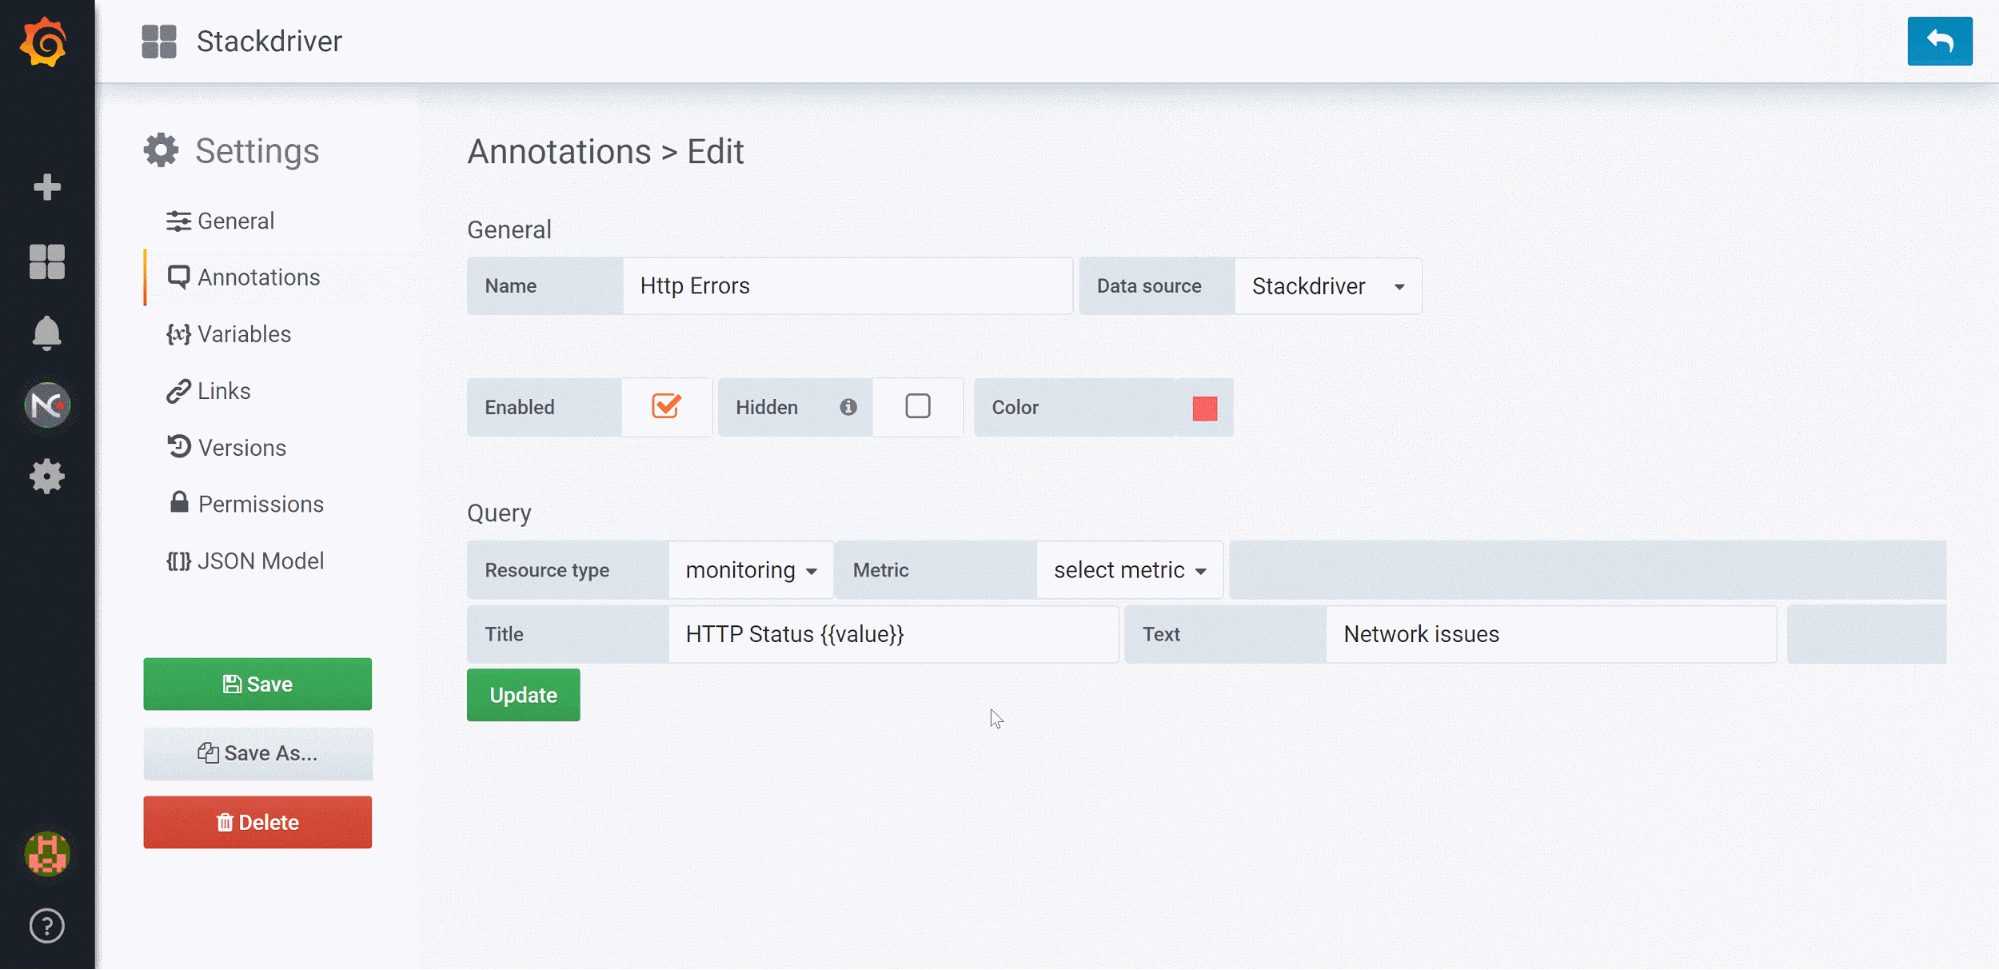
To give Stackdriver users more powerful visualization options, we’ve also partnered with Grafana Labs. Grafana offers one of the most popular time-series visualization solutions in the market today. Their solution is built on an open framework for observability dashboards and monitoring data analytics that lets you visualize, analyze and pinpoint potential issues, root causes and outstanding trends. This integration lets you use Grafana as a visualization tool for Stackdriver monitoring, so you now have more options to visualize the monitoring data about your services that’s collected and hosted by the Stackdriver platform. You can download Grafana here, and you can see the interface here:

Paving the road ahead
Every developer and operator deserves this level of automation for speed, security, and safety. We plan to expand our ecosystem to enable SREs and Ops teams to become ever more effective in operating their applications reliably. If you’d like to automate away some of the toil, you can sign up for the Stackdriver IRM alpha today, and learn more about Stackdriver here. Stay tuned for more ahead!
