Introducing Google Stackdriver: unified monitoring and logging for GCP and AWS
Dan Belcher
Product Manager
GCP NEXT 2016 — SAN FRANCISCO — We’re excited to introduce Google Stackdriver, a unified monitoring, logging and diagnostics service that makes ops easier, whether you’re running applications on Google Cloud Platform (GCP), Amazon Web Services (AWS)1, or a combination of the two.
Stackdriver is the first service to include rich dashboards, uptime monitoring, alerting, log analysis, tracing, error reporting and production debugging, across GCP and AWS, in a single, unified offering. This combination significantly reduces the time that teams spend finding and fixing issues in production.

A unified view across cloud platforms
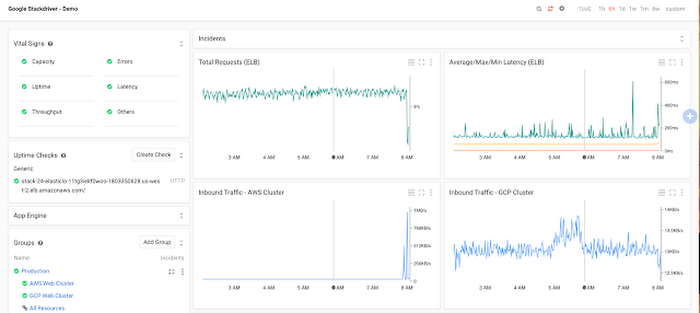
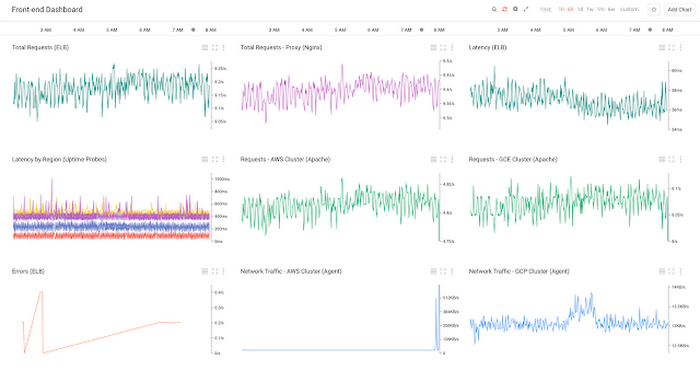
If you're running an application that spans two or more infrastructure platforms, you’re not alone. We’ve found teams using hybrid infrastructure for a variety of reasons, whether you’re replicating across cloud providers for higher availability, migrating from one cloud to another, or simply choosing the services that best meet the need of each application or component.To support teams who choose to use GCP and AWS, Stackdriver offers native monitoring, logging and error reporting for both. With Stackdriver, you could start with a single dashboard to monitor the health of an application that's split across clusters on GCP and AWS.

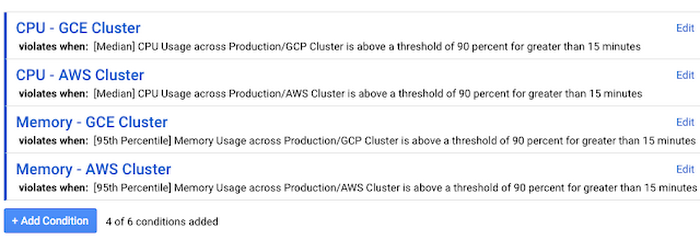
Likewise, you can define an alerting policy to notify you if either cluster reaches capacity.

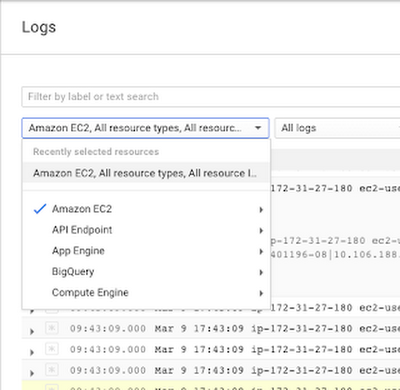
You can search for errors in your AWS and EC2 logs in a single interface.

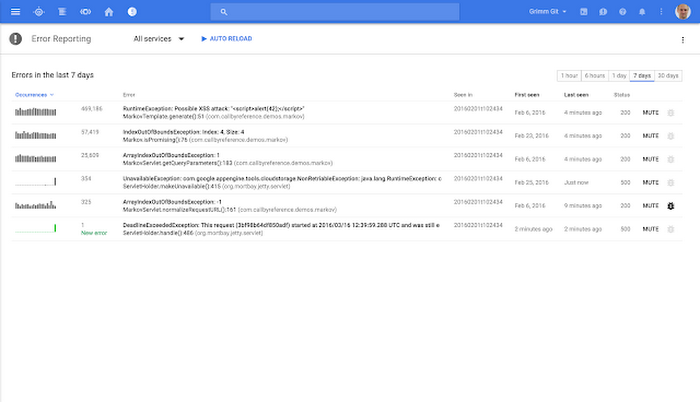
Finally, Stackdriver will send you error reports when new errors are detected within applications running on either platform:

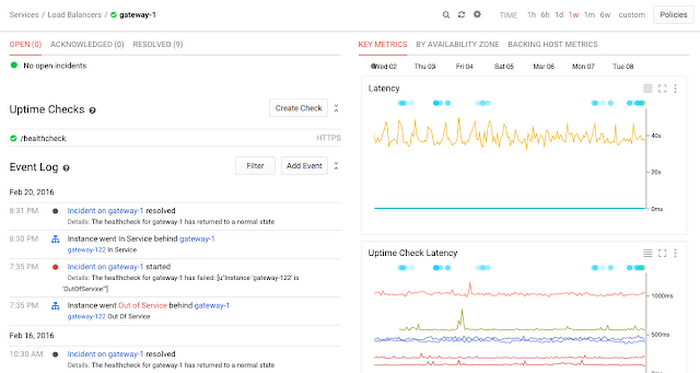
Strong support for AWS is an essential part of Stackdriver. If you’re running a web application behind an Elastic Load Balancer, for example, Stackdriver provides you with a comprehensive view of the health of that cluster with no setup, including configuration information, uptime, recent events and summary metrics as well as per-availability zone and per-host breakdowns.

The same support for AWS is maintained throughout Stackdriver, from IAM-based setup and API integration to preconfigured dashboards for widely used AWS services to support for SNS Topics as an alerting mechanism and more.
Eliminate data silos, fix problems faster
Stackdriver drastically reduces the number of disparate tools necessary to identify and troubleshoot issues. Within Stackdriver, you can configure uptime checks that monitor the availability of your application endpoints. You can incorporate logs and metrics from your cloud platforms, systems, databases, messaging queues, web servers and application tier into the same monitoring system. You can maintain critical context, such as the timeframe of an issue, as you follow an issue across the monitoring, logging and diagnostics components. For many customers, this will eliminate the need to manually correlate this information across five or more disconnected tools, saving valuable time during incidents and outages.
Your team’s primary starting point might be a summary dashboard that provides an at-a-glance view into the health of your application. That view can include metrics from your cloud platform, system agents, uptime checks, logs and more.

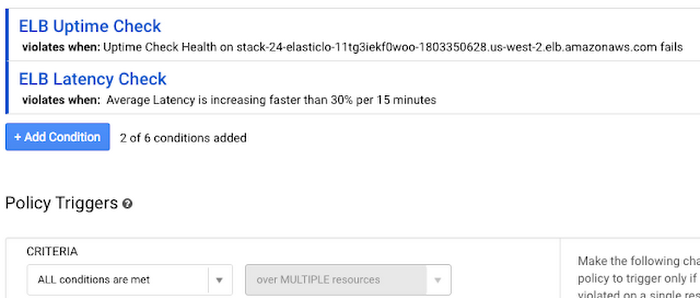
Stackdriver can alert your team when issues occur. To avoid dealing with alerts from many different systems when a single issue occurs, you can define alerting policies in Stackdriver that trigger when multiple conditions are true, such as a URL failing an uptime check and latency increases by over 30 percent over a 15-minute period.

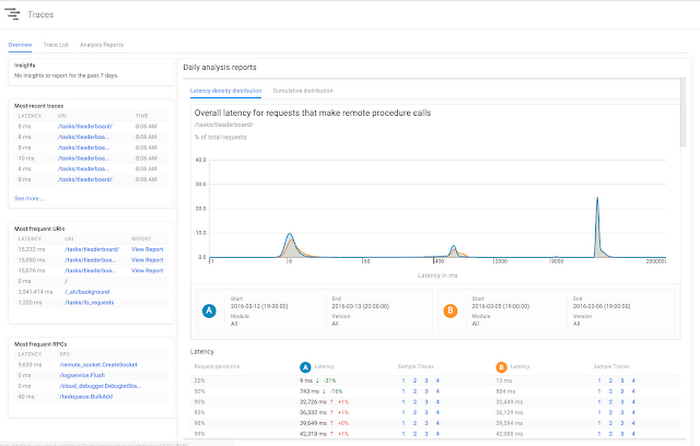
When you discover an issue, Stackdriver helps you follow the trail to the root cause. For example, upon receiving an error report for your Google App Engine application, you may choose to view a summary dashboard, drill down to traces of the latency per URL that your application is serving, and ultimately view logs of specific requests.

You can also take advantage of integrations with an ecosystem of services to extend the value of Stackdriver. For example, you can stream Stackdriver logs to BigQuery to perform ad-hoc analysis. Likewise, you can use Google Cloud Datalab to perform ad-hoc visualization of time series data. Finally, you can choose among a variety of alerting integrations to ensure that your team receives alert notifications in the appropriate format, including Slack, HipChat, Campfire, and PagerDuty.
Get started in 2 minutes, nothing to maintain or scale
Getting started with Stackdriver is easy. Once you create your account and configure integration with AWS (if applicable), Stackdriver will automatically discover your cloud resources and provide an initial set of metrics and dashboards. From there, you can create uptime checks and deploy our open source agents (packages of Collectd for metrics, Fluentd for logs) to get deeper visibility into your virtual machines, databases, web servers and other components in just a couple of commands.
Stackdriver is built on top of the same powerful technologies that provide monitoring, logging and diagnostics for Google, so you can rest assured that Stackdriver will scale with you as your environment grows. And since Stackdriver is a hosted service, Google takes care of the operational overhead associated with monitoring and maintaining the service for you.
Try Google Stackdriver free during Beta
We're excited to introduce Google Stackdriver and hope you find it valuable in making ops easier — whether you're running on AWS, GCP or both. The service is currently in Beta. Learn more and try it for free at http://cloud.google.com/stackdriver.
Please note that we’ll continue to support existing Stackdriver customers and work closely with them to migrate to Google Stackdriver once it’s generally available.
