Introducing Quota Monitoring Solution: Single Dashboard with Alerting capabilities
Anuradha Bajpai
Solutions Architect
Adrian Beheschti
Technical Account Manager
Try Google Cloud
Start building on Google Cloud with $300 in free credits and 20+ always free products.
Free trialIf you are looking for an automated way to manage quotas over a large number of projects, we are excited to introduce a Quota Monitoring Solution from Google Cloud Solutions Engineering.
By default, Google Cloud employs resource quotas to restrict how much of a particular shared Google Cloud resource you can use. Each quota represents a specific countable resource, such as API calls to a particular service or the number of compute cores used concurrently by your project.
Quotas are enforced for a variety of reasons, including:
- To protect the community of Google Cloud users by preventing unforeseen spikes in usage and overloaded services.
- To help you manage resources. For example, you can set your own limits on service usage while developing and testing your applications to avoid unexpected bills from using expensive resources.
Quota Monitoring Solution solution benefits anyone who manages quotas across projects, folders, or organizations. It offers an easy and centralized way to view and monitor the quota usage in a central dashboard and to use default alerting capabilities across all quotas.
Specifically, the solution provides:
- Automated aggregation of quotas across all projects in given organizations or folders and a recurring scan at a defined frequency (e.g. hourly, daily) for new projects to automatically capture their quotas.
- A dashboard that provides visibility into recent resource usage against the individual quotas across all projects.
- Preconfigured alerting through email or other communication channels (e.g., email, SMS, Pub/Sub, etc.) when a resource reaches a certain threshold of its quota.
The solution is easily deployable through Terraform so that you can adopt it into your project with minimal time investment.
Outside of the Quota Monitoring Solution, there are additional ways of viewing your quota information, such as using the Google Cloud Console or using the gcloud command-line tool. You can also manually define Alerting Policies in Cloud Monitoring to send out notifications when a resource reaches a certain threshold of its quota. For example, you can define an alerting policy that triggers when the CPU usage of Compute Engine VM instances goes above 75% of the quota in any region.
In case your project needs more of a particular resource than your quota allows, you can request a quota limit increase for the majority of quotas directly in the Google Cloud Console. In the vast majority of cases, quota increase requests are evaluated and processed automatically. However, depending on the nature of your request, a small number of quota increase requests needs to be handled by human reviewers. They typically process your request within 2-3 business days, so it is important to plan ahead.
Ineffective quota management can lead to many different problems. For example, the lack of sufficient quota can prevent consuming additional resources, which could be needed for auto-scaling events, or for performing a GKE cluster upgrade. This can cause outages or service degradation, which could impact your customers’ experience and potentially impact your business revenues.
Please note: Many services also have limits that are unrelated to the quota system. These are fixed constraints, such as maximum file sizes or database schema limitations, which cannot be increased or decreased. You can find out about these on the relevant service's Quotas and limits page (for example, Cloud Storage quotas and limits).1. Technical Architecture
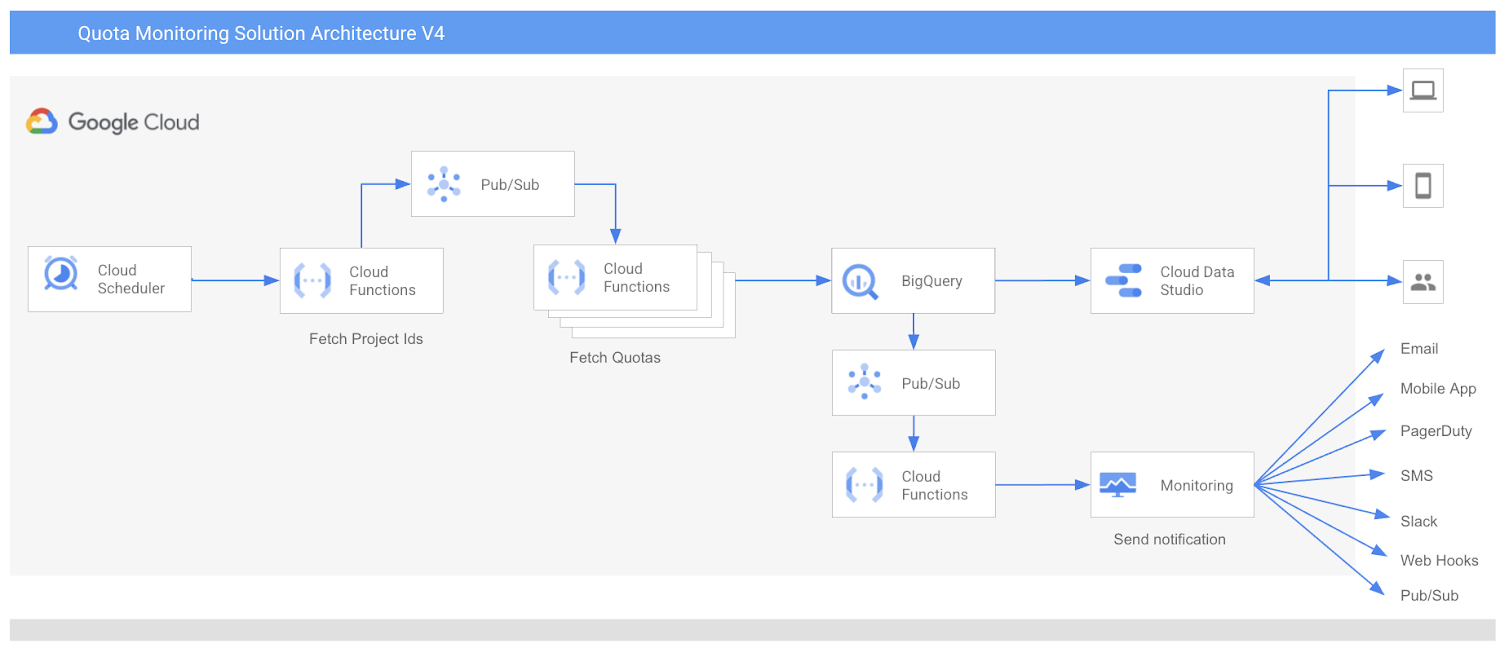
The diagram below shows the Quota Monitoring Solution architecture flow you can deploy in minutes using the deployment guide and accompanying terraform scripts.


The solution includes a terraform script that you can deploy in a GCP project. This templates provisions the following resources in a GCP project:
Cloud Scheduler - Cloud Scheduler is a fully managed, enterprise-grade cron-job scheduler. It is used to trigger Cloud Functions at scheduled intervals.
Cloud Functions - Cloud Functions is an event-driven serverless compute platform. It contains the code logic to scan project quotas.
Pub/Sub - Pub/Sub allows services to communicate asynchronously, with very low latency. It is used to support event-driven application design and high scalability.
BigQuery - BigQuery is a serverless, highly scalable data warehouse. It is used to store data for project quotas.
Data Studio - Data Studio is a Dashboard and reporting tool. It is used to display quotas across multiple projects in a single view. You can configure other visualization tools of your choice, like Looker. In the future, we will also provide a Looker-based Dashboard.
Cloud Monitoring Custom Log Metric and Alert - Google Cloud Monitoring offers logging and alerting capabilities. This is used to enable alerting that gives timely awareness to quota issues in your cloud applications so you can request a quota increase quickly.
In this solution, Cloud Scheduler also works as an interface for you to provide configurations:
You can provide folder IDs, organization IDs as parent nodes for which you want to monitor quotas. Parent nodes can be a single folder ID or organization ID or list of folder IDs or Organization IDs.
You can also configure metric threshold and email addresses for Alerting.
Currently, you can receive alerts via Email, Mobile App, PagerDuty, SMS, Slack, Web Hooks and Pub/Sub.
Metric threshold is used to generate alerts. For example you can choose 70% or 80% as a threshold to generate alerts.
The alerts will be sent to the configure alerting channel.
Please note:
Any changes in the projects like addition of new projects or deletion of existing projects will be reflected automatically in the subsequent scheduled scanning.
Any changes in the GCP Cloud Monitoring APIs will be reflected. For example, the introduction of new quota metrics will be reflected automatically in the solution without making any code changes.
Any changes in the Cloud Monitoring alert notification channels will also be available automatically without the need to make any code changes.
1.1 Workflow
If we put all these components together, the workflow starts at Cloud Scheduler. You can provide your preferences of folders and organization IDs, metric threshold, email addresses and configure to run the job at scheduled intervals.
Create a service account and grant access to view quota usage in the target organization/s or folder/s.
Cloud scheduler automatically runs at configured frequency, for example daily, and passes user configurations to Cloud Functions.
Based on the service account access, the first Cloud Functions instance lists projects of the parent node, generates the list of project IDs, and publishes them to the Pub/Sub topic.
The second Cloud Function instance is triggered from the message generated in the previous step and receives the project IDs as a separate message from the topic.
Upon receiving the project IDs, the second Cloud Function instance fetches the quotas for each project using publicly available GCP cloud monitoring APIs.
Cloud Function loads the project’s quota data in the BigQuery table.
Alerting
A scheduled query on the BigQuery table filters all quotas with usage greater than the configured threshold.
The third Cloud Function’s instance logs the data for metrics in Cloud Logging.
Preconfigured custom log metrics in Google Cloud Monitoring create alerts, which are sent to the configured notification channel.
Reporting
Once the data is loaded into BigQuery, Data Studio fetches the data from BigQuery and displays it in the Dashboard in a single view across all projects and metrics.
Data Studio Dashboard is easy to use, customize, and share.
You can also configure scheduled reporting from this Dashboard to receive Quota monitoring reports in email as PDF.
2. Deployment Process
The Google Cloud custom quota monitoring solution can be deployed in a few minutes using the deployment guide and accompanying terraform scripts. Following are three simple steps:
Create a service account and grant access
Run terraform script to provision all resources in a Google Cloud project
Configure the Data Studio Dashboard
For step-by-step details, please see the Readme section of the deployment guide on Github.
3. How to Customize?
This is an open source code available on Google Github repository. You can fork the repository and customize as per your requirements. During the deployment, Terraform downloads the code. The code and the data stays in the customer's environment.
4. Summary
Quota Monitoring solution lets you to view and monitor quotas for Google Cloud services from one central location for an organization or folder. Service Quotas enables you to easily and consistently track quota usage and receive alerts to save time and effort in setting up quota monitoring for new projects.
If you have questions or suggestions for this solution, please fill out this form or reach out to us at quota-monitoring-solution@google.com.
We would like to thank Darpan Shah, Raghavendra Kyatham, Ravinder Lota, Marlon Pimentel and Ben Good for their contribution in building the solution as well as Rahul Khandkar, Karina Rivera, Rohan Karne, James Brookbank and Thorgane Marques for sponsoring this project. We would also like to extend our gratitude to all Technical Account Managers who helped prototype and roll out the solution globally, especially Naveen Nelapudi, Vijay Narayanan, Rohit Iyer, Emily Wong, and Isha Rana.


