Diagnose problems in your production apps faster with Google Cloud Debugger
Sharat Shroff
Product Manager
Google Cloud Debugger, which lets you inspect the state of an application at any code location without stopping or slowing it down, now has an enhanced UI, expanded language support and debugging from more places.
You can view the application state without adding logging statements and we’ve made several important improvements to Cloud Debugger that’ll make production debugging more accessible, more intuitive, and more fun.
1. Language and runtimes and platforms
Cloud Debugger can help you quickly find and fix bugs in production applications. We started with support for Java 1 applications running in App Engine Managed VMs and have rapidly expanded support for more languages across Google Cloud Platform. With this release, Cloud Debugger is now available for the following languages and platforms:- Java applications running on App Engine, App Engine Managed VMs and Compute Engine
- Python applications running on App Engine, App Engine Managed VMs and Compute Engine
- Go applications running on Compute Engine
- Node.js applications running on App Engine Managed VMs and Compute Engine (Alpha)
2. UI enhanced for debugging
Cloud Debugger can be turned on without getting in your way. For example, debugger agents capture runtime information in a few milliseconds without user-perceptible delay to incoming requests. In production, when time is of the essence, Cloud Debugger is there when you need it and invisible when you don’t.Additionally, Cloud Debugger is intuitive and easy to use. If you're familiar with setting breakpoints and inspecting applications when using local debuggers you'll be able to quickly transition to debugging in the cloud using a familiar UI for taking snapshots, setting conditions and specifying watch expressions.
With this release, we've completely overhauled the Cloud Debugger section of the Cloud Console to make it easier to get started and simpler to navigate. For example, now you can quickly complete each of the following actions using the new debugger web UI:
- Take snapshots. Cloud Debugger is integrated into common workflows such as deployment.
- Setup and select the source code that matches the deployed application by choosing among a variety of source code repositories. Both local and cloud repositories are now supported. You can use it without source code as well.
- Traverse a complex source hierarchy using the familiar treeview layout.
- Share snapshots and collaborate with other project members, as easily as sharing a URL.
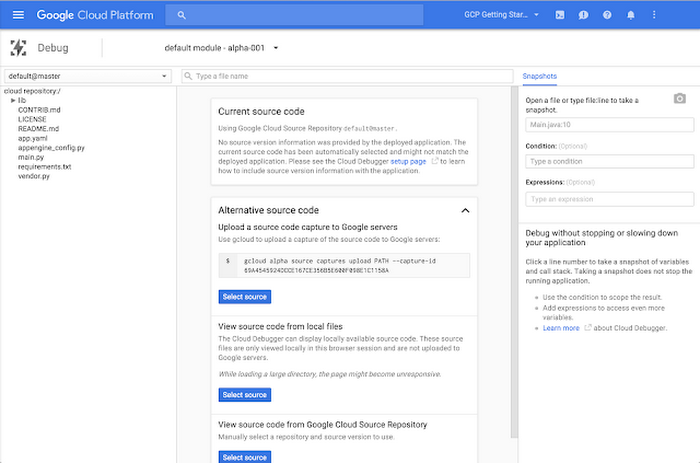

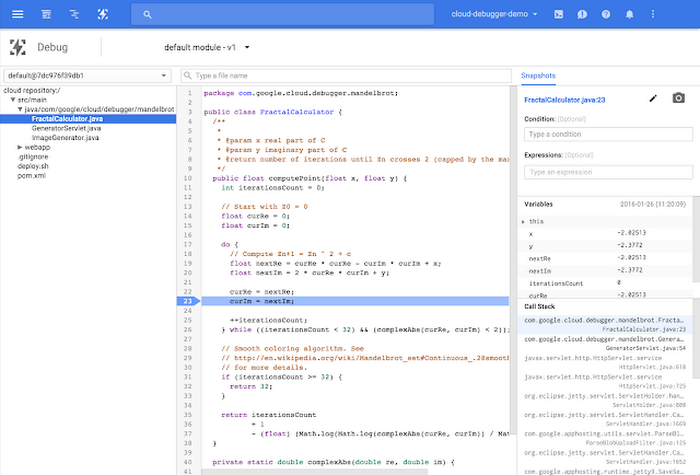

This is just the beginning of the UI enhancements to make Cloud Debugger easier to use and to make diagnosing production errors more productive.
3. Debug using your source code, or none at all
You can inspect your application state and link it back to source code regardless of where your source code is stored or how you access it.- Debug with no access to source at all
We recognize that in many cases, developers may not be able to provide access to their source code. Cloud Debugger now lets you enter just the filename and line number to take a snapshot at that location.
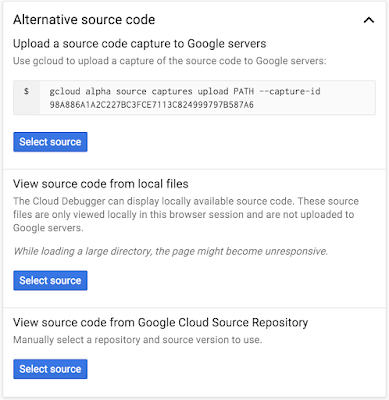
- Debug with a source capture
Upload a capture of your source code to help debug your application over multiple sessions without having to connect to a source repository.
- Debug with a local source
You can simply point Cloud Debugger to any local source file to take a snapshot. When debugging with local files, the source code is used for that debug session only. No source code is uploaded to Google servers.
- Debug with a cloud source repository
Like before, developers can use Cloud Debugger by providing access to the source code for their application using the source code storage and management features provided by Cloud Source Repositories. A source repository provides version control via git and can be managed using the Cloud Console and the new gcloud command-line tool. When a source control system is available, displaying accurate source information is simply a matter of pointing to the correct version of the source code in the source control repository using the developer console.

4. Debug on your terms in your tools
Developers working with IntelliJ IDEA can debug live production applications without leaving the IDE using the familiar IDEA debugger interface.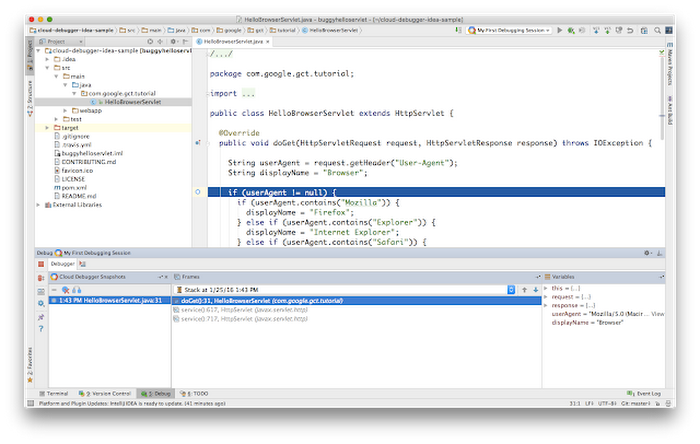

In case you’re unable to share your Java source code with us, that’s no problem, as the Cloud Tools for IntelliJ plugin uses the code from your local machine during your Cloud Debugging sessions.
Stay tuned for more Cloud Debugger improvements over the coming weeks. As always, we love direct feedback and will be monitoring Stack Overflow for issues and suggestions. If you haven’t tried Cloud Debugger to diagnose problems in your production applications, now is a perfect time to start!
1 Java is the registered trademark of Oracle and/or its affiliates.
