Creating custom interactive dashboards with Bokeh and BigQuery
Julien Phalip
Solutions Architect, Google Cloud
Powerful software-as-a-service (SaaS) solutions like DataStudio are extremely useful when building interactive data visualization dashboards. However, these types of solutions might not provide sufficient customization options. For those scenarios, you can use open source libraries like D3.js, Chart.js, or Bokeh to create custom dashboards. While these libraries offer a lot of flexibility for building dashboards with tailored features and visualizations, a major challenge remains: deploying these dashboards to the Internet to enable easy stakeholder access.
We recently published a tutorial to show you how to build a demo dashboard application on Google Cloud Platform by using the Bokeh library to visualize data from publicly available Google BigQuery datasets. The tutorial also shows how to deploy this application with both security and scalability in mind.
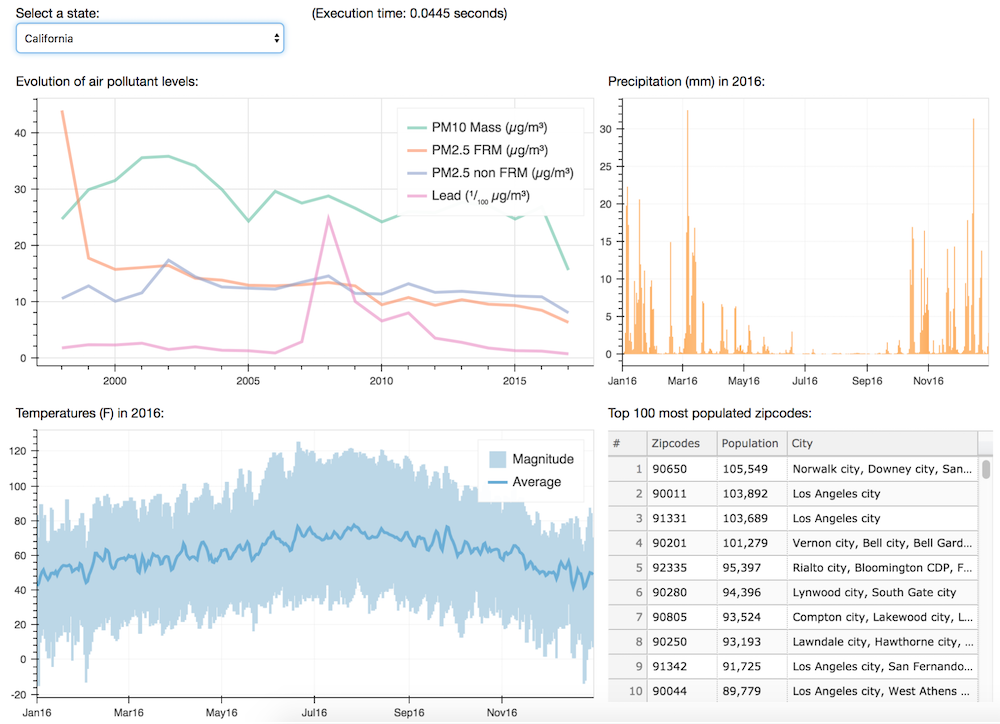
The demo application displays a dashboard that processes and visualizes publicly available data for all fifty U.S. states. The dashboard provides a simple level of interaction: the user can select any of the fifty states from a dropdown widget to drill down and display information about that state. The dashboard contains four different modules, and each module displays different types of information:
- A line plot shows the evolution of various air pollutant levels over the past several decades. Data comes from the EPA Historical Air Quality Dataset.
- A bar plot displays precipitation levels for the year 2016. Data comes from the NOAA Global Historical Climatology Network Weather Dataset.
- A line plot indicates the magnitude and average temperature levels for the year 2016. Data from the NOAA Global Surface Summary of the Day Weather Dataset.
- A table lists the top 100 most populated zip codes. Data from the United States Census Bureau Dataset.
At a high-level, the demo’s architecture consists of six main elements. The following diagram shows how these components communicate and interact:

Reference architecture for the demo application.
These elements include:
- Client web browsers on the desktop machines and mobile devices of the dashboard users.
- An authentication proxy managed by Cloud Identity-Aware Proxy, responsible for controlling access to the application.
- An HTTPS Load Balancer responsible both for effectively distributing incoming web traffic to the appropriate backends and handling SSL decryption/encryption of data coming in and out of the system.
- The application backend responsible for serving the dashboard’s dynamic content (HTML and plot data).
- The static assets backend serving the static JavaScript and CSS files needed for client web browser rendering.
Check out the step-by-step tutorial for all the details on this solution. We hope this will inspire you to create your own custom dashboards!