Application observability made easier for Compute Engine
Haskell Garon
Sr. Product Manager
JJ Roepke
Software Engineer
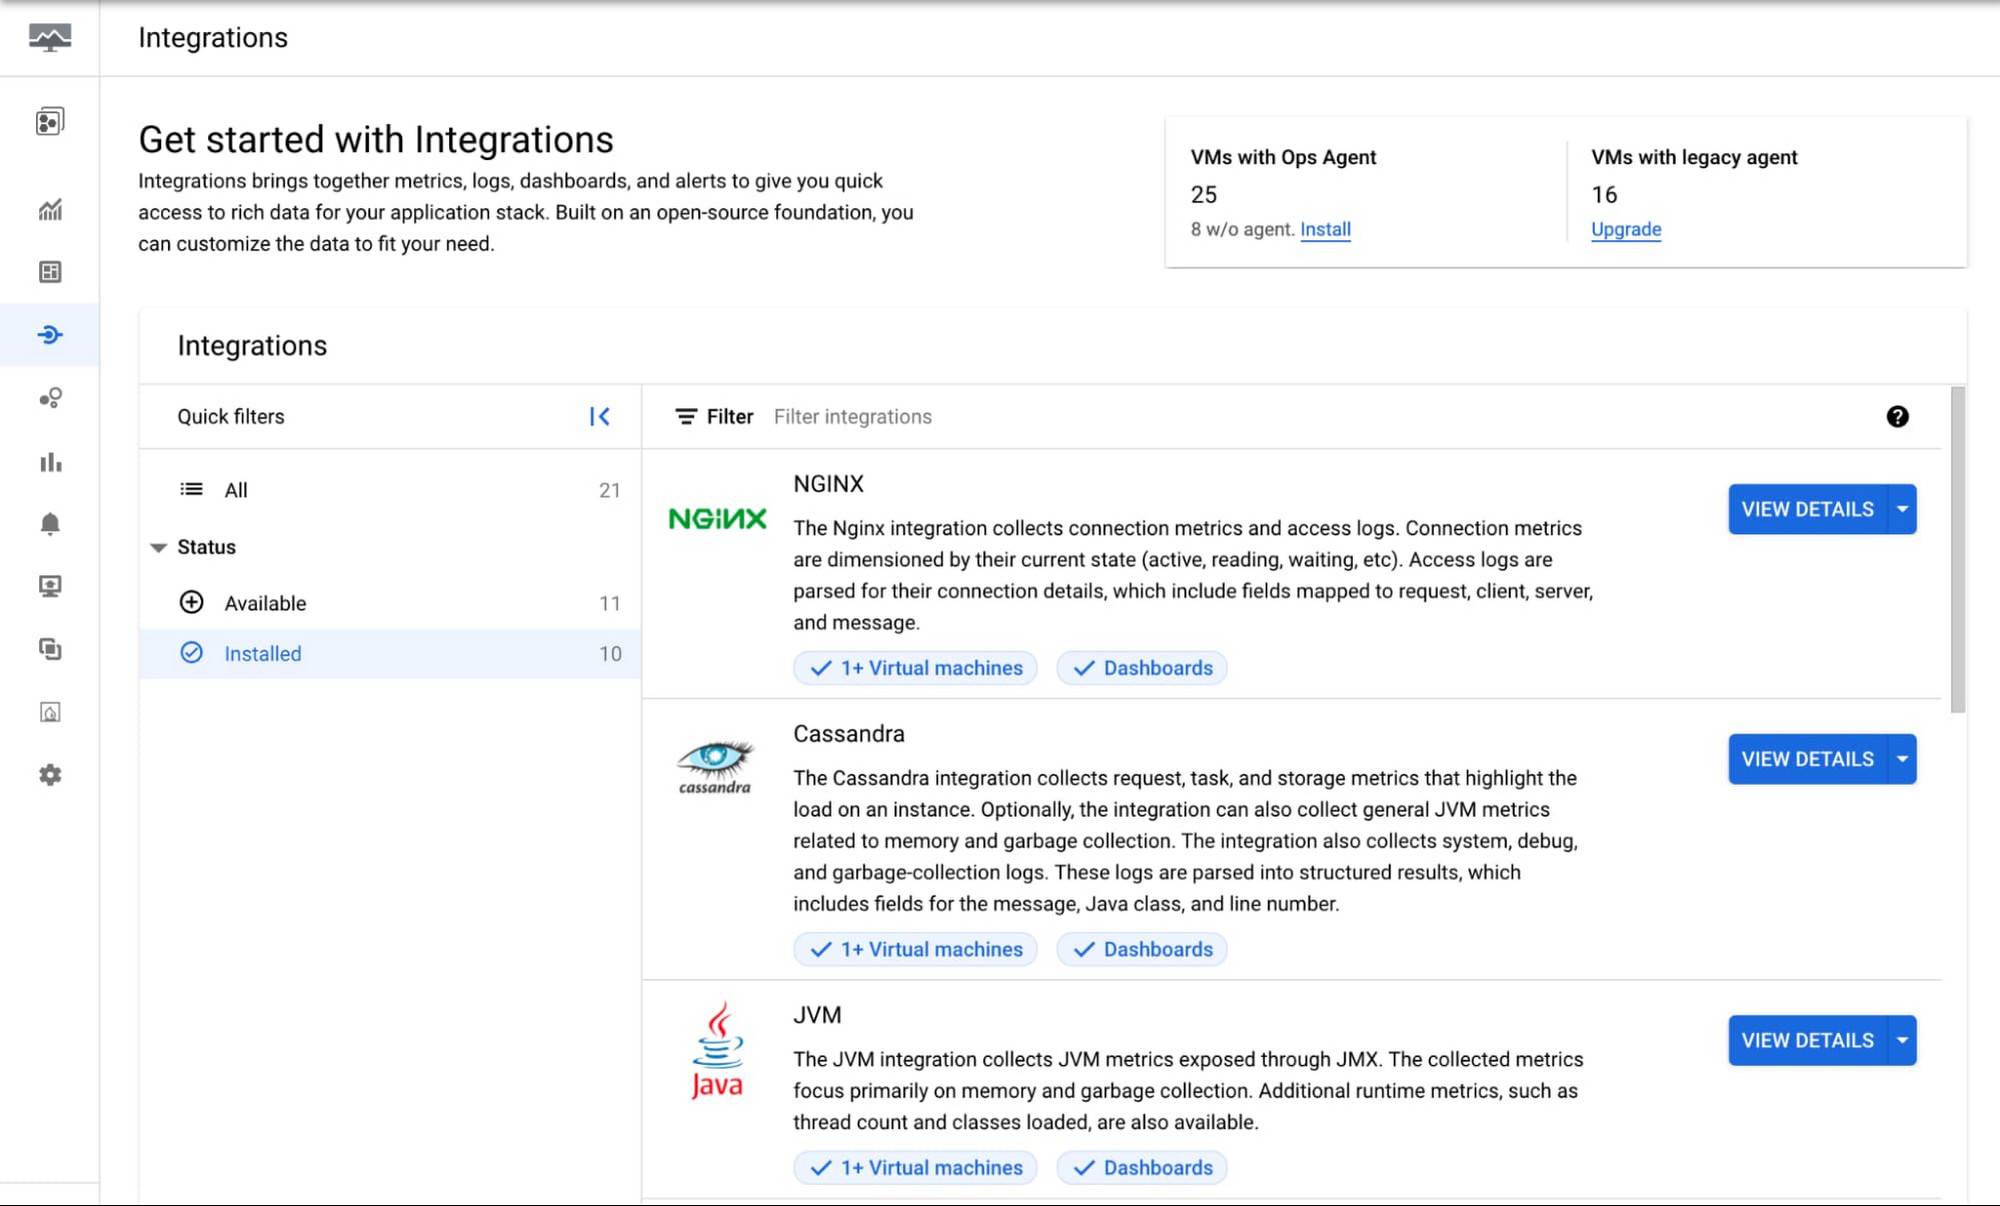
When IT operators and architects begin their journey with Google Cloud, Day 0 observability needs tend to focus on infrastructure and aim to address questions about resource needs, a plan for scaling, and similar considerations. During this phase, developers and DevOps engineers also make a plan for how to get deep observability into the performance of third-party and open-source applications running on their Compute Engine VMs. That’s why we recently launched a dedicated UI under Monitoring → Integrations that guides you to the available integrations that may be a good fit for your fleet, automatically installs relevant dashboards to help you get value faster, and shows you the integrations that are live on your VMs.
Getting up and running faster with application observability
Since the Ops Agent entered General Availability, we have added out of the box integrations with dozens of popular open source and licensed applications like databases, web servers, in-memory caches, event streaming, and application runtimes.
These integrations can be easily turned on within the Ops Agent on any VM, usually with a simple YAML configuration file update. Application-specific metrics and logs are sent to cloud operations, providing deep visibility not just into infrastructure health indicators, but also into the application-specific telemetry that drives underlying infrastructure utilization. This data populates the analysis and query tools of Cloud Logging and Cloud Monitoring like dashboards, Logs Explorer, alerts, SLOs, and more.
A single location for all integrations
Even with easy configuration instructions, setting up an observability toolset with a view of dozens of third-party applications can be tricky. That’s why we created one UI that lists out all application integrations that we offer, along with instructions on how to get up and running quickly. With this UI, you can:
Filter by integrations already installed on one or more VMs in your fleet, or those that are available but not yet installed on any VMs.
Check at a glance which of your VMs have the Ops Agent installed already, and go through quick installation for VMs that will need the Ops Agent for application monitoring.
Quickly identify lists of the specific metrics and log types collected for each integration so you know the telemetry collected.
Link directly to the setup instructions for each integration to save time searching through documentation.
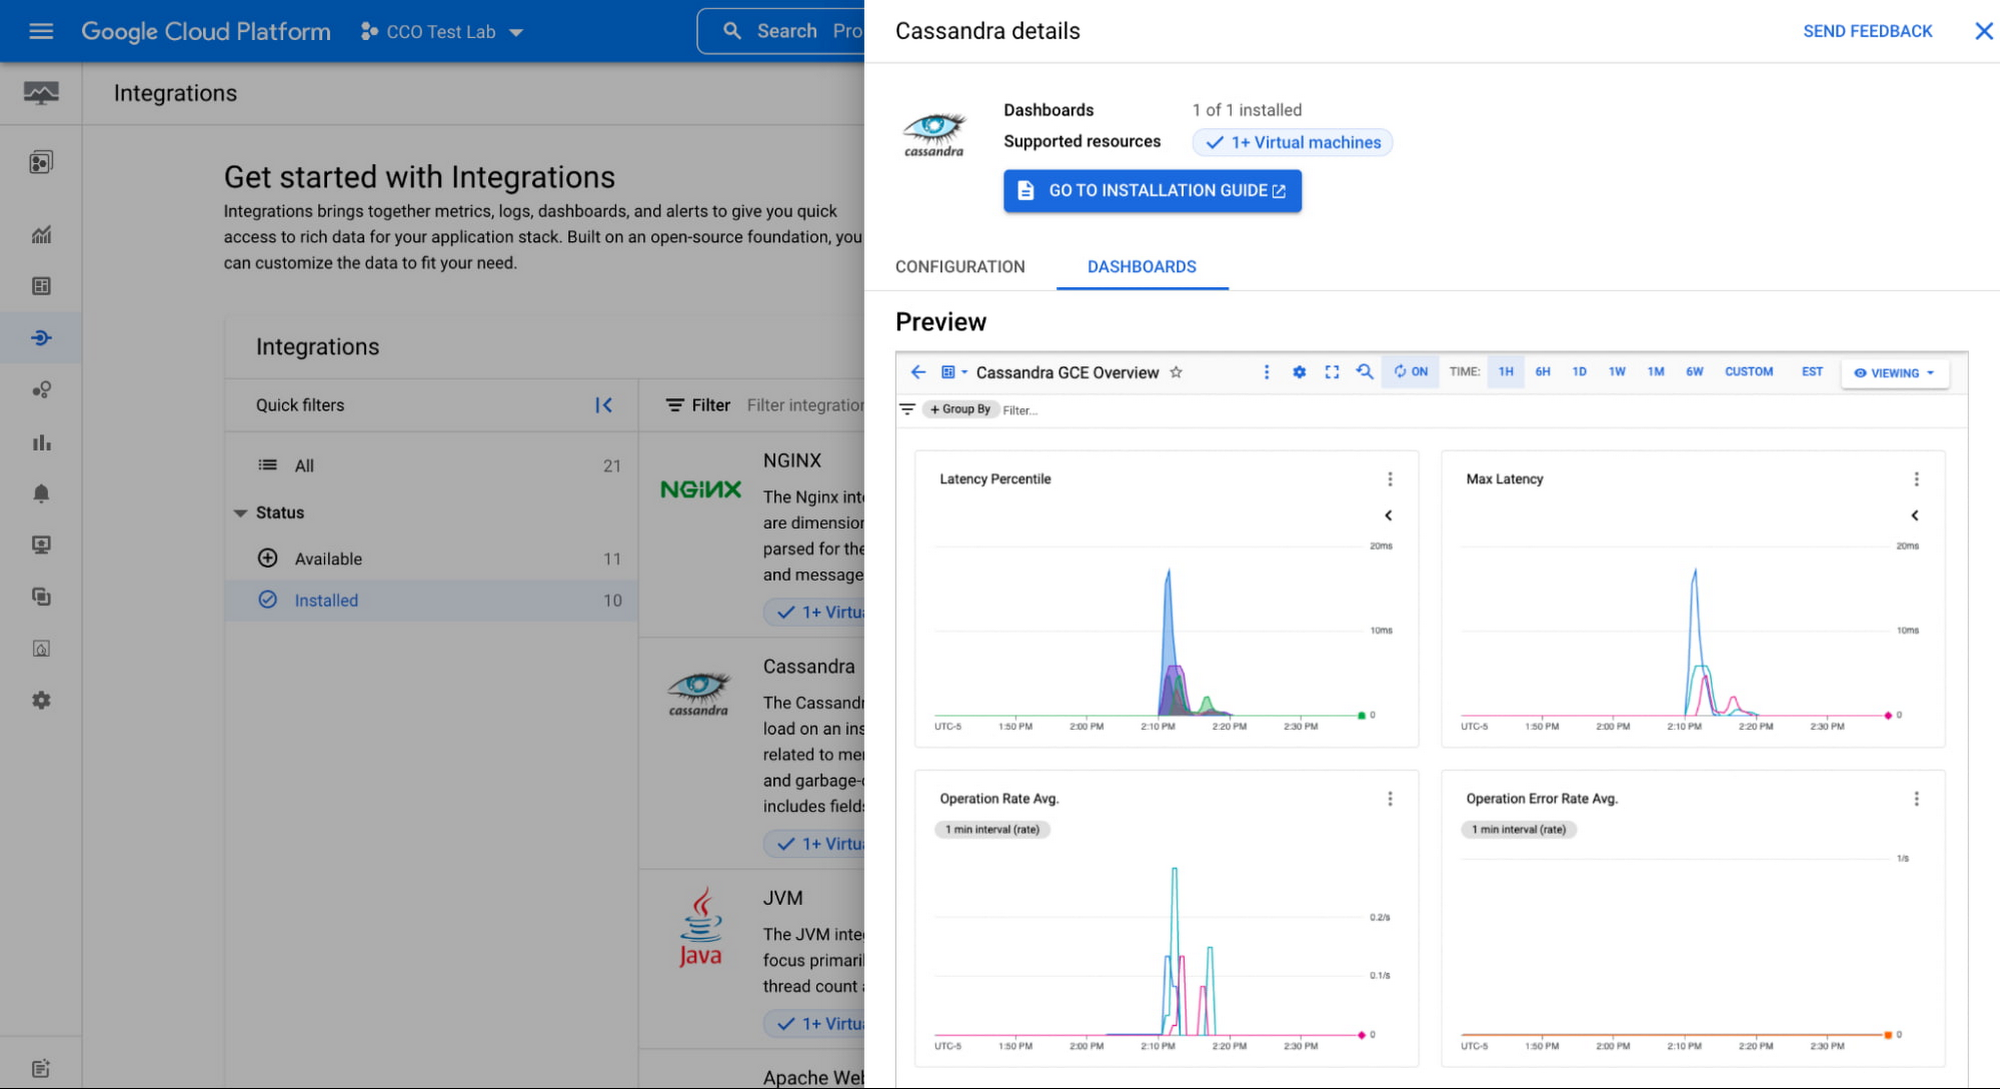
View samples and screenshots of “out of the box” dashboards and visualizations available with zero configuration, and have the dashboards automatically added to your ‘Integration Dashboards’ list based on what is live on your fleet. Links to the dashboards will be available in the Integrations UI, or by going to Monitoring → Dashboards → Integrations.
With a single click, choose “Copy Dashboard” to clone a given dashboard into your Custom list, and make modifications and edits specific to your applications and use cases.
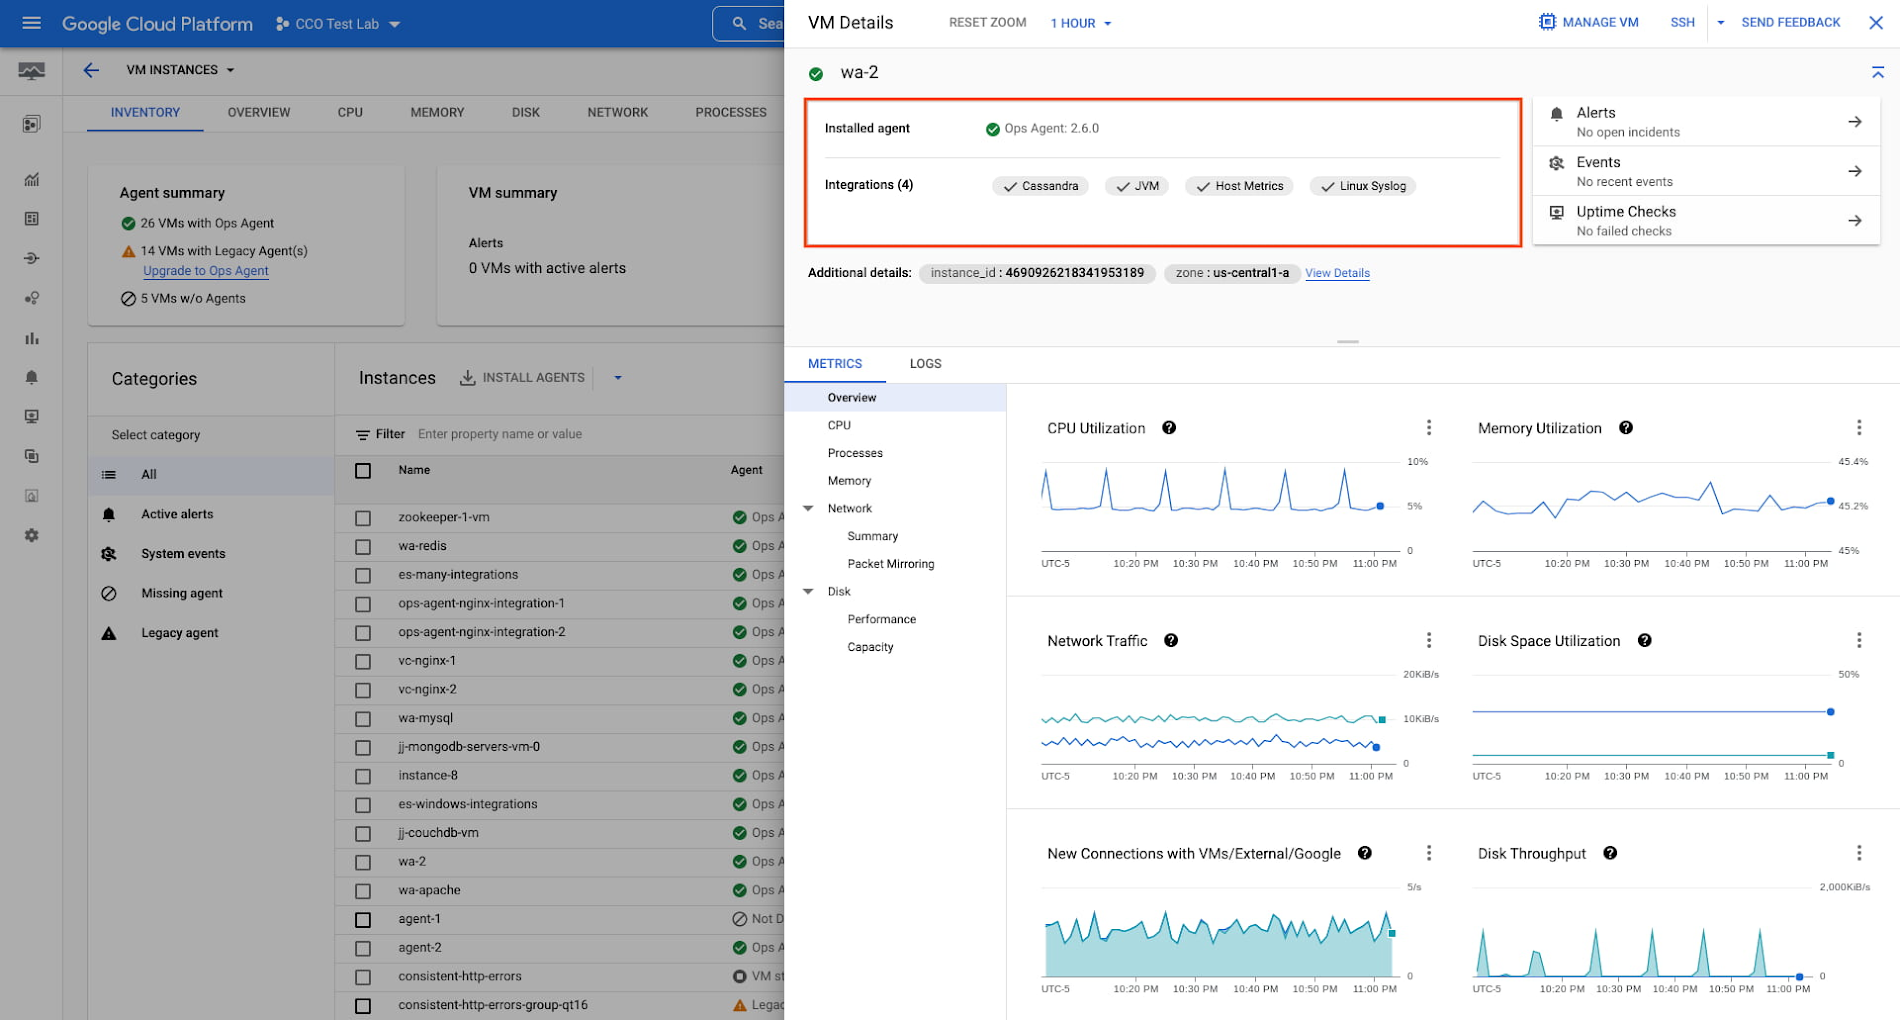
We also heard from our customers that you want a feedback loop that clearly shows which VMs have which integrations live. So, we added the following to our VM Instances Dashboard (located under Monitoring → Dashboards → GCP → VM Instances):
Click into any VM to see whether the Ops Agent is installed, and the exact version running.
View the “Integrations” chips to check which Integrations are currently collecting metrics and logs for each VM.
View other infrastructure metrics and logs per VM, and quickly spot if there are any alerts or uptime checks set up for the VM or live events and incidents that require attention.
Get started today
In the coming months, we will add more integrations to the Ops Agent for more open source and licensed applications that you have told us are priorities.
To get started with application observability today, make sure you are running the latest version of the Ops Agent on your GCE VMs, check out the instructions to add third-party application integrations, and check out the Integrations UI in the Monitoring section of the Google Cloud Console.
Lastly, if you have feedback, want to ask us questions, or request another application integration, drop us a line on the Google Cloud Community Cloud Ops area!