Troubleshoot BigQuery performance with these dashboards
Kaitlin Ardiff
Strategic Cloud Engineer
BigQuery is Google's flagship data analytics offering, enabling companies of all sizes to execute analytical workloads. To get the most out of BigQuery, it’s important to understand and monitor your workloads to keep your applications running reliably. Luckily, with Google’s INFORMATION_SCHEMA views, monitoring your organization’s use at scale has never been easier. Today, we’ll walk through how to monitor your BigQuery reservation and optimize performance.
Understanding Workloads and Reservations
Our first step is to analyze your organization-wide historical slot utilization. With reservations, you can allocate capacity, or slots, to designated groups of GCP projects in your organization. When organizing projects, consider grouping them according to workloads, teams, or departments. We encourage you to isolate these groups of projects, or specific workloads, in separate reservations. This will help with monitoring and overall resource planning to track trends in growth.
In practice, this might look like the following: break out business units, like marketing or finance, and separate known, persistent workloads like ETL pipelines from more ad-hoc workloads like dashboarding. Isolating workloads like this means that any burst in resource usage from one reservation will be unable to adversely impact another reservation; a sudden surge from a dashboarding task won’t interfere with ETL schedules. This will minimize any disruptions caused by unanticipated spikes, as well as allow reservations to meet their SLOs so that jobs can complete on time.
How Scheduling Works
To better understand why isolation matters, it’s important to understand BigQuery’s Scheduler. BigQuery uses a notion of fairness for allocating slots. First, BigQuery assigns slots at the reservation level. From within a reservation, slots are then assigned equally amongst all active projects, where active signifies a project that is currently executing a query. From within each active project, slots are then allocated to all running jobs to ensure that each job is able to make forward progress.
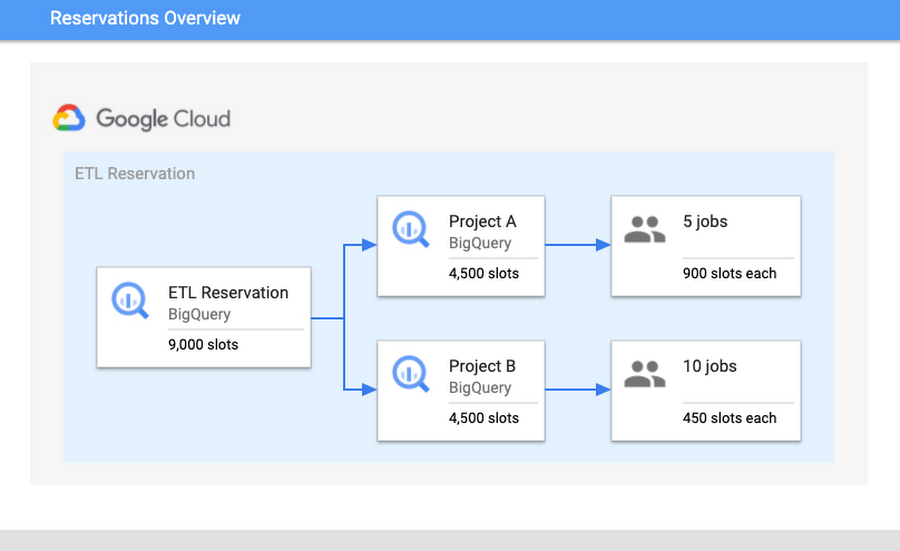

Consider the following scenario: there is a reservation “ETL” that has 9,000 slots, which contains Project A and Project B. Project A is currently running five jobs and Project B is running ten jobs. Assuming that all jobs require maximum slots to complete their jobs, then each project would get 4,500 slots each. The five jobs in Project A would receive 900 slots each and the ten jobs in Project B would receive 450 slots. These per-job slot allocations are recomputed constantly, depending on each job’s need and current state in order to make progress.
Once you have optimized your isolation configuration, the next step is to examine your usage and configure your slot allocation. A high slot utilization implies good cost-efficiency; this means that the resources that you’re paying for are not sitting idle. However, you don’t want to get too close to 100% utilization. Operating too close to 100% leaves you without a buffer for potential spikes in usage. If a spike does occur and drive you over 100%, it can cause resource competition and general slowness for your users.
Improving and monitoring query performance
To monitor performance, we’ll walk through common root causes, signals to look for, as well potential steps for mitigation. Our goal for the sake of this example will be increased performance for your queries.
We’ll start by comparing the data from the INFORMATION_SCHEMA views. Specifically, to understand differences in query performance, we will take two similar queries and compare their INFORMATION_SCHEMA job data. Note: it’s important that these jobs are similar and are expected to generate comparable output. This might mean comparing the same job executed at hour A vs. hour B or the same job that read in partitions from date A vs. date B.
The data from these views displays various job statistics that affect query performance. By understanding how the statistics from these fields varied between different runs, we can identify the potential root causes for slowness, and steps for mitigation. The table below summarizes the top key indicators and the corresponding root cause.
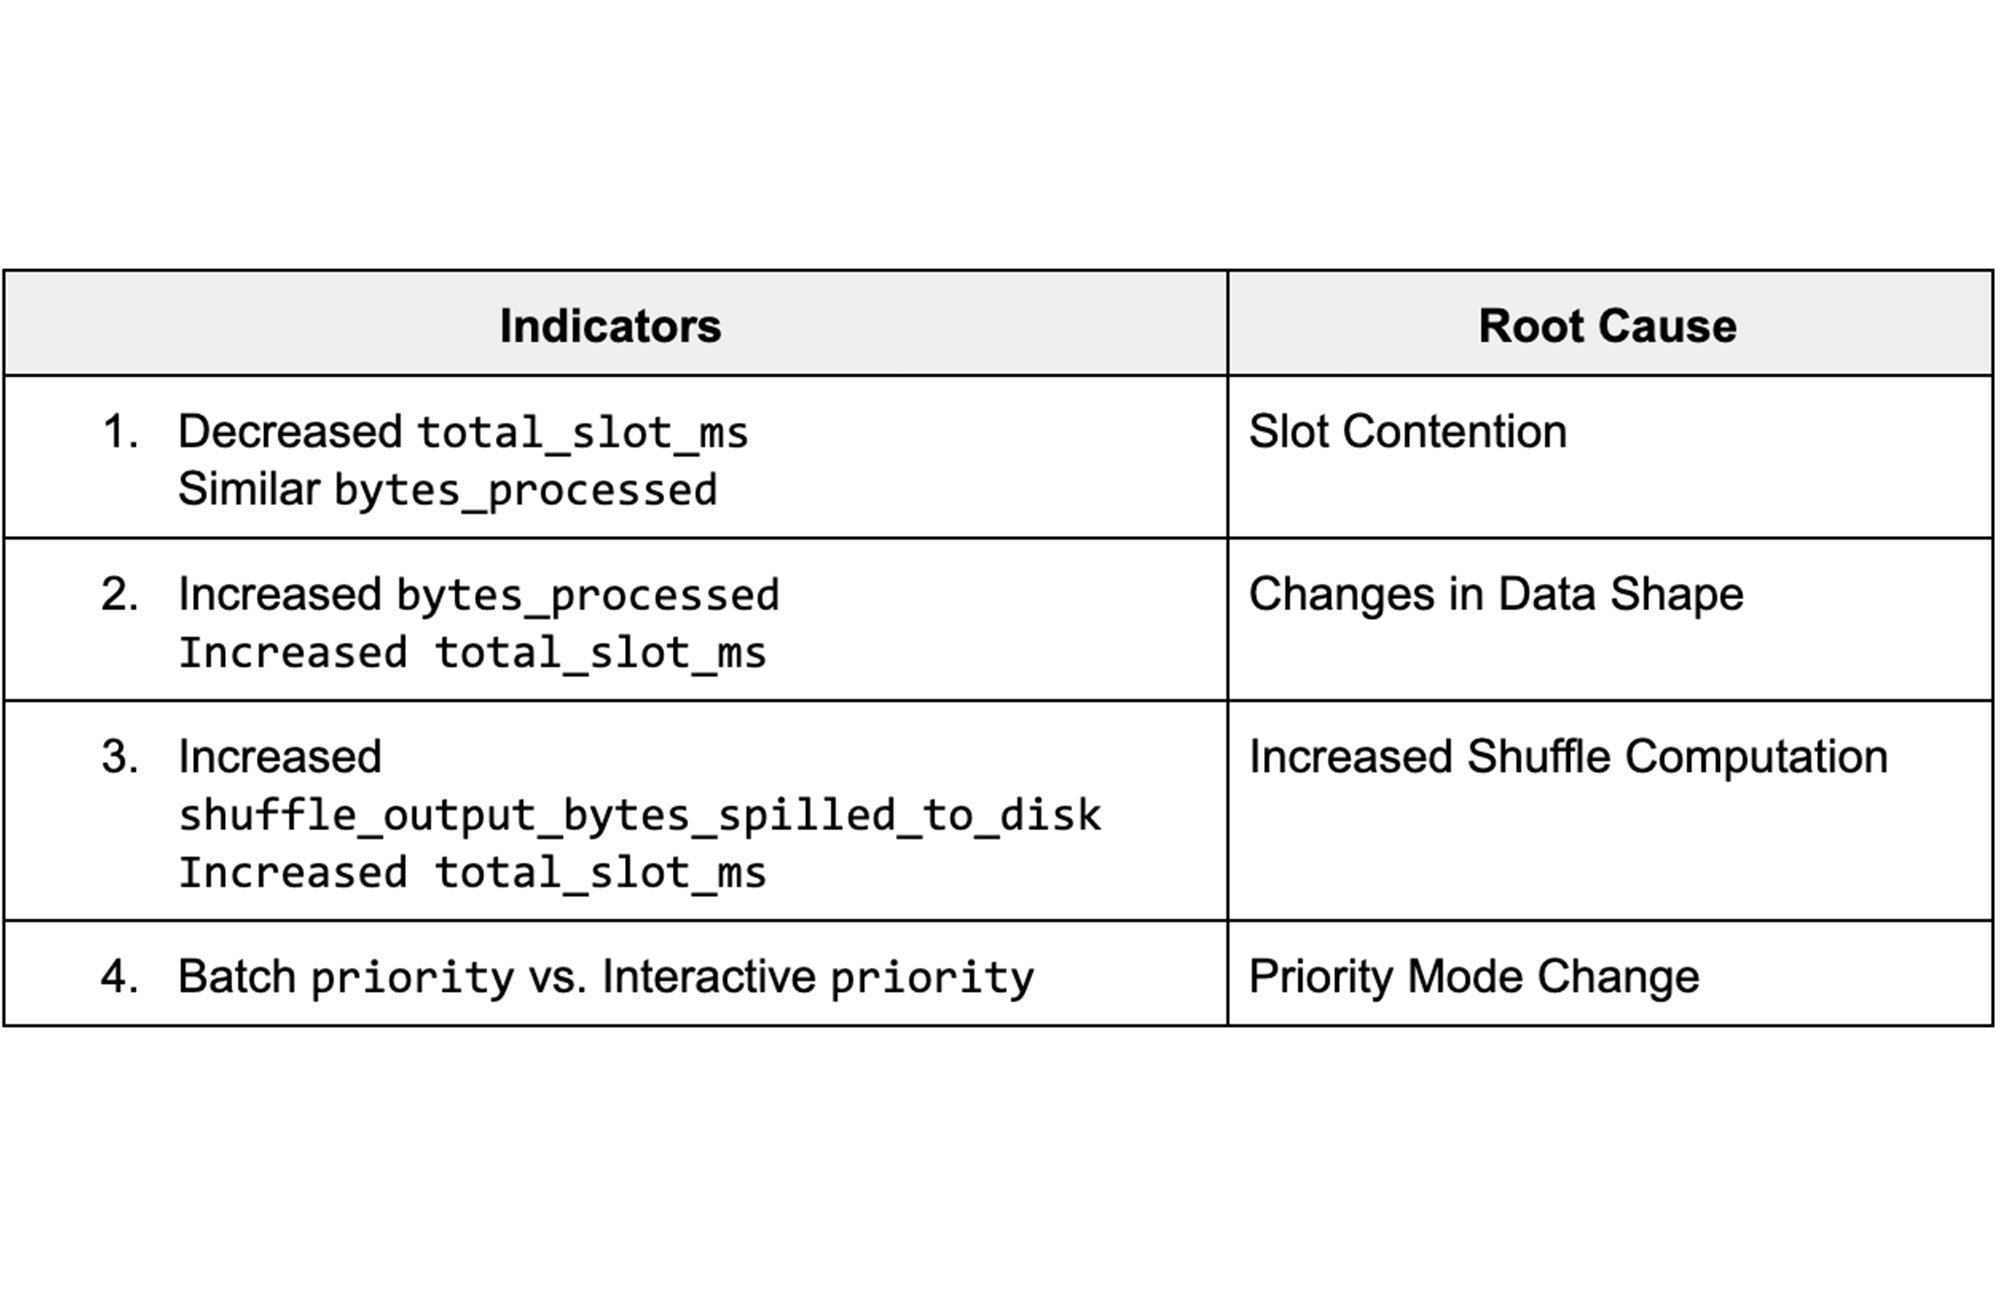

Job Comparison Dashboard
We’ll begin by navigating to our public dashboard, which shows Google’s test INFORMATION_SCHEMA data to compare the performance of jobs.
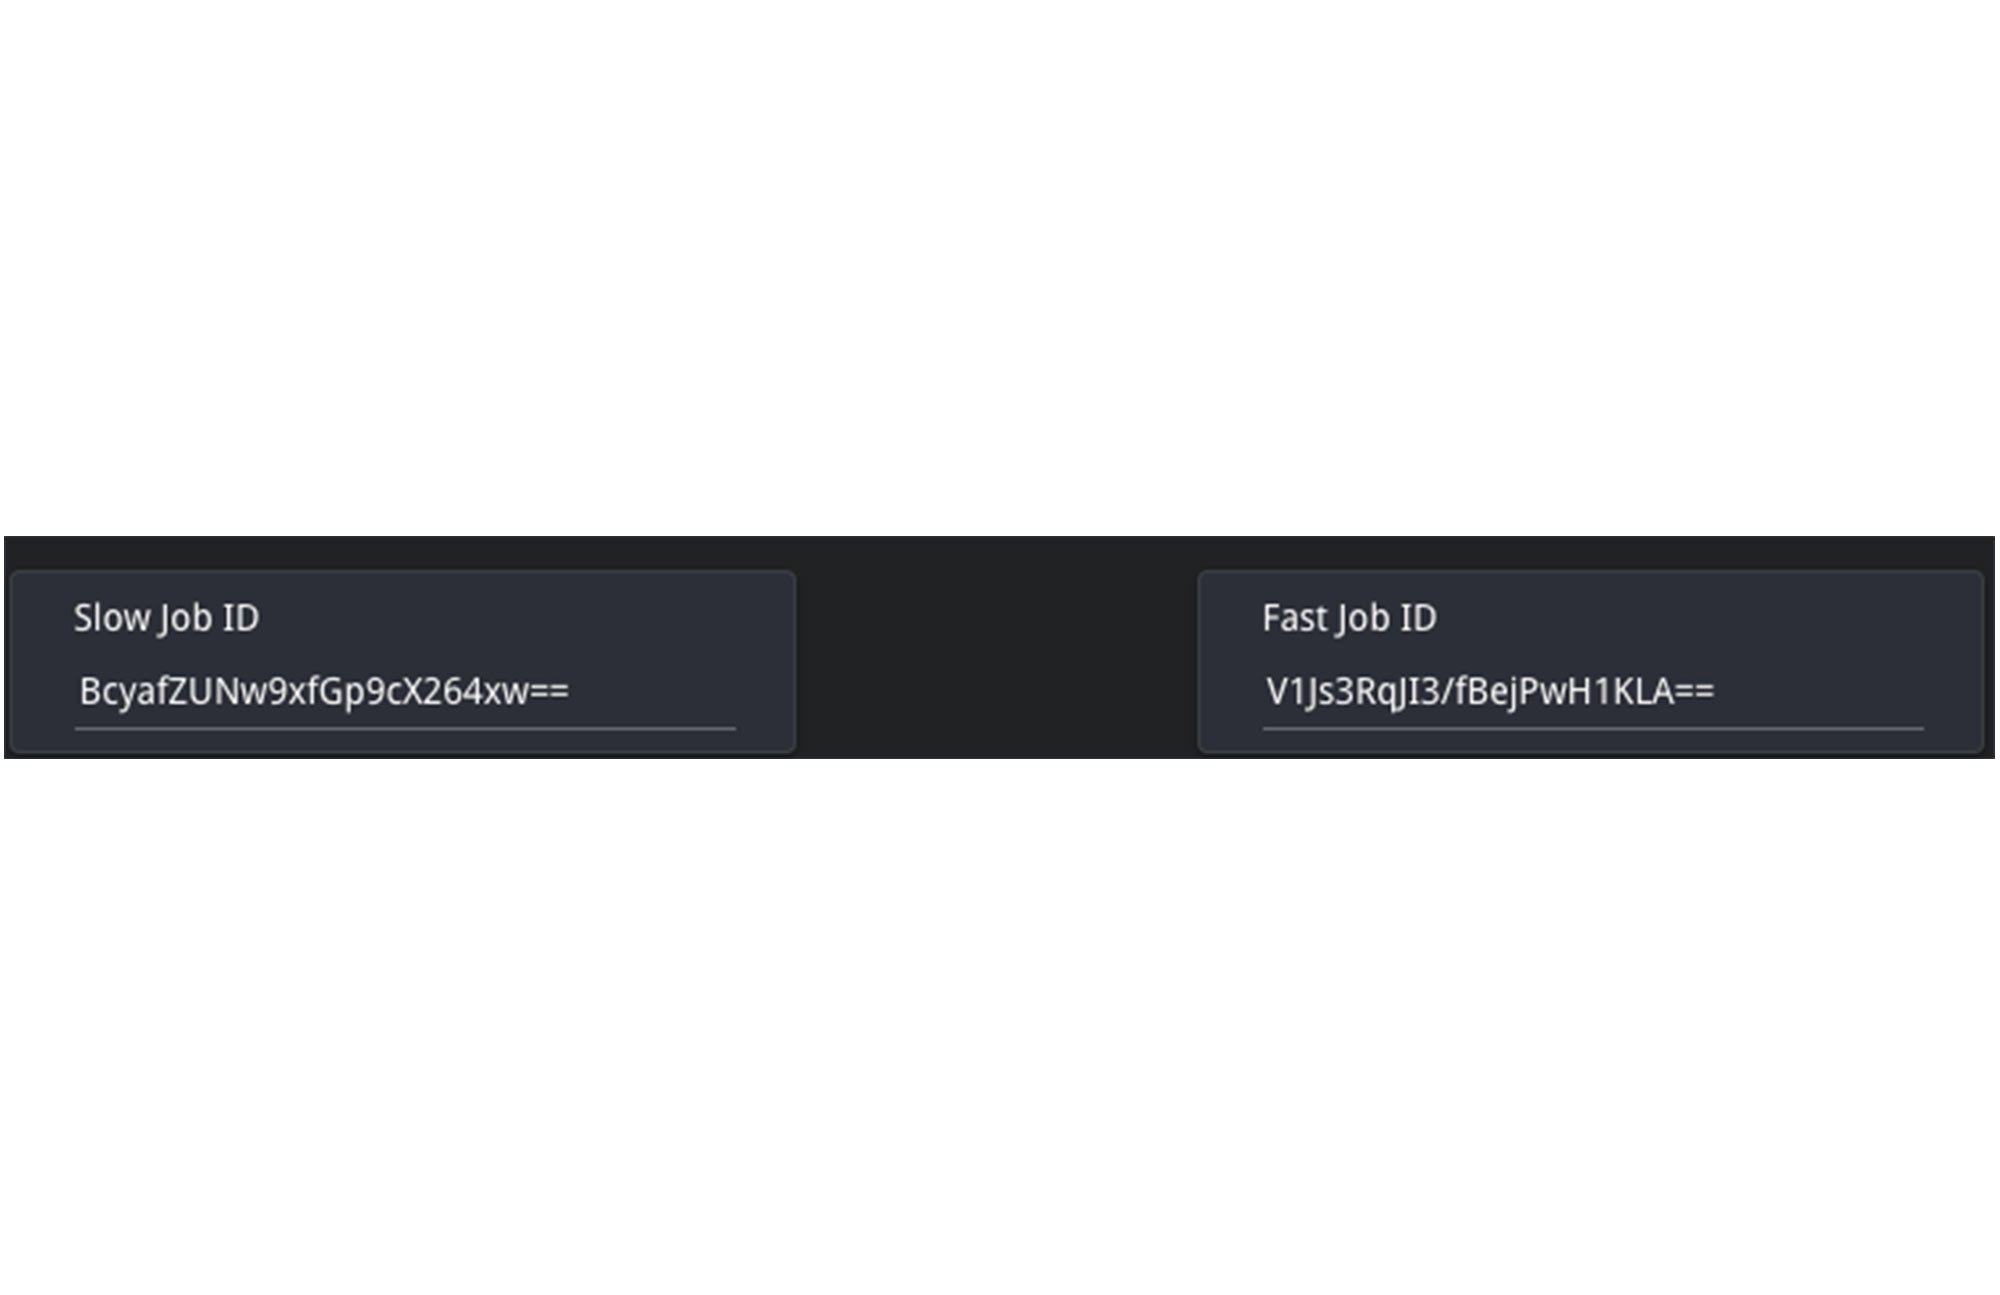
Let’s walk through each of these root causes and learn how to diagnose them by using the Systems Tables dashboard. To begin, we’ll enter both a slow and fast job ID to compare job statistics.

1. Slot Contention
Background
Slot contention can occur when the demand for slots is higher than the allocated amount for the reservation. Since projects/jobs share slots equally inside of a reservation, this means that if more projects/jobs are active, then each project/job will receive less slots. To diagnose slot contention, you can use the INFORMATION_SCHEMA timeline views to analyze concurrency at both the project-level and the job-level.
Monitoring
We’ll look at a few different scenarios for this use case: first, we’ll verify that the “total_slot_ms” varied between the queries. If one job ran slower and used significantly less slots than the other, then this usually means it had access to less resources because it was competing against other active jobs. To verify this assumption, we’ll need to dive into concurrency:
1. Concurrent Projects: If the job is inside of a reservation, we’ll use the JOBS_BY_ORGANIZATION timeline view to compute the active number of projects during both the slow and fast queries. Query jobs will slow down as the number of active projects across the reservation increases. Represented as an equation, if there are Y projects in a reservation, each project receives 1/Y of the reservation’s total slots. This is due to the BigQuery fair scheduling algorithm described above.
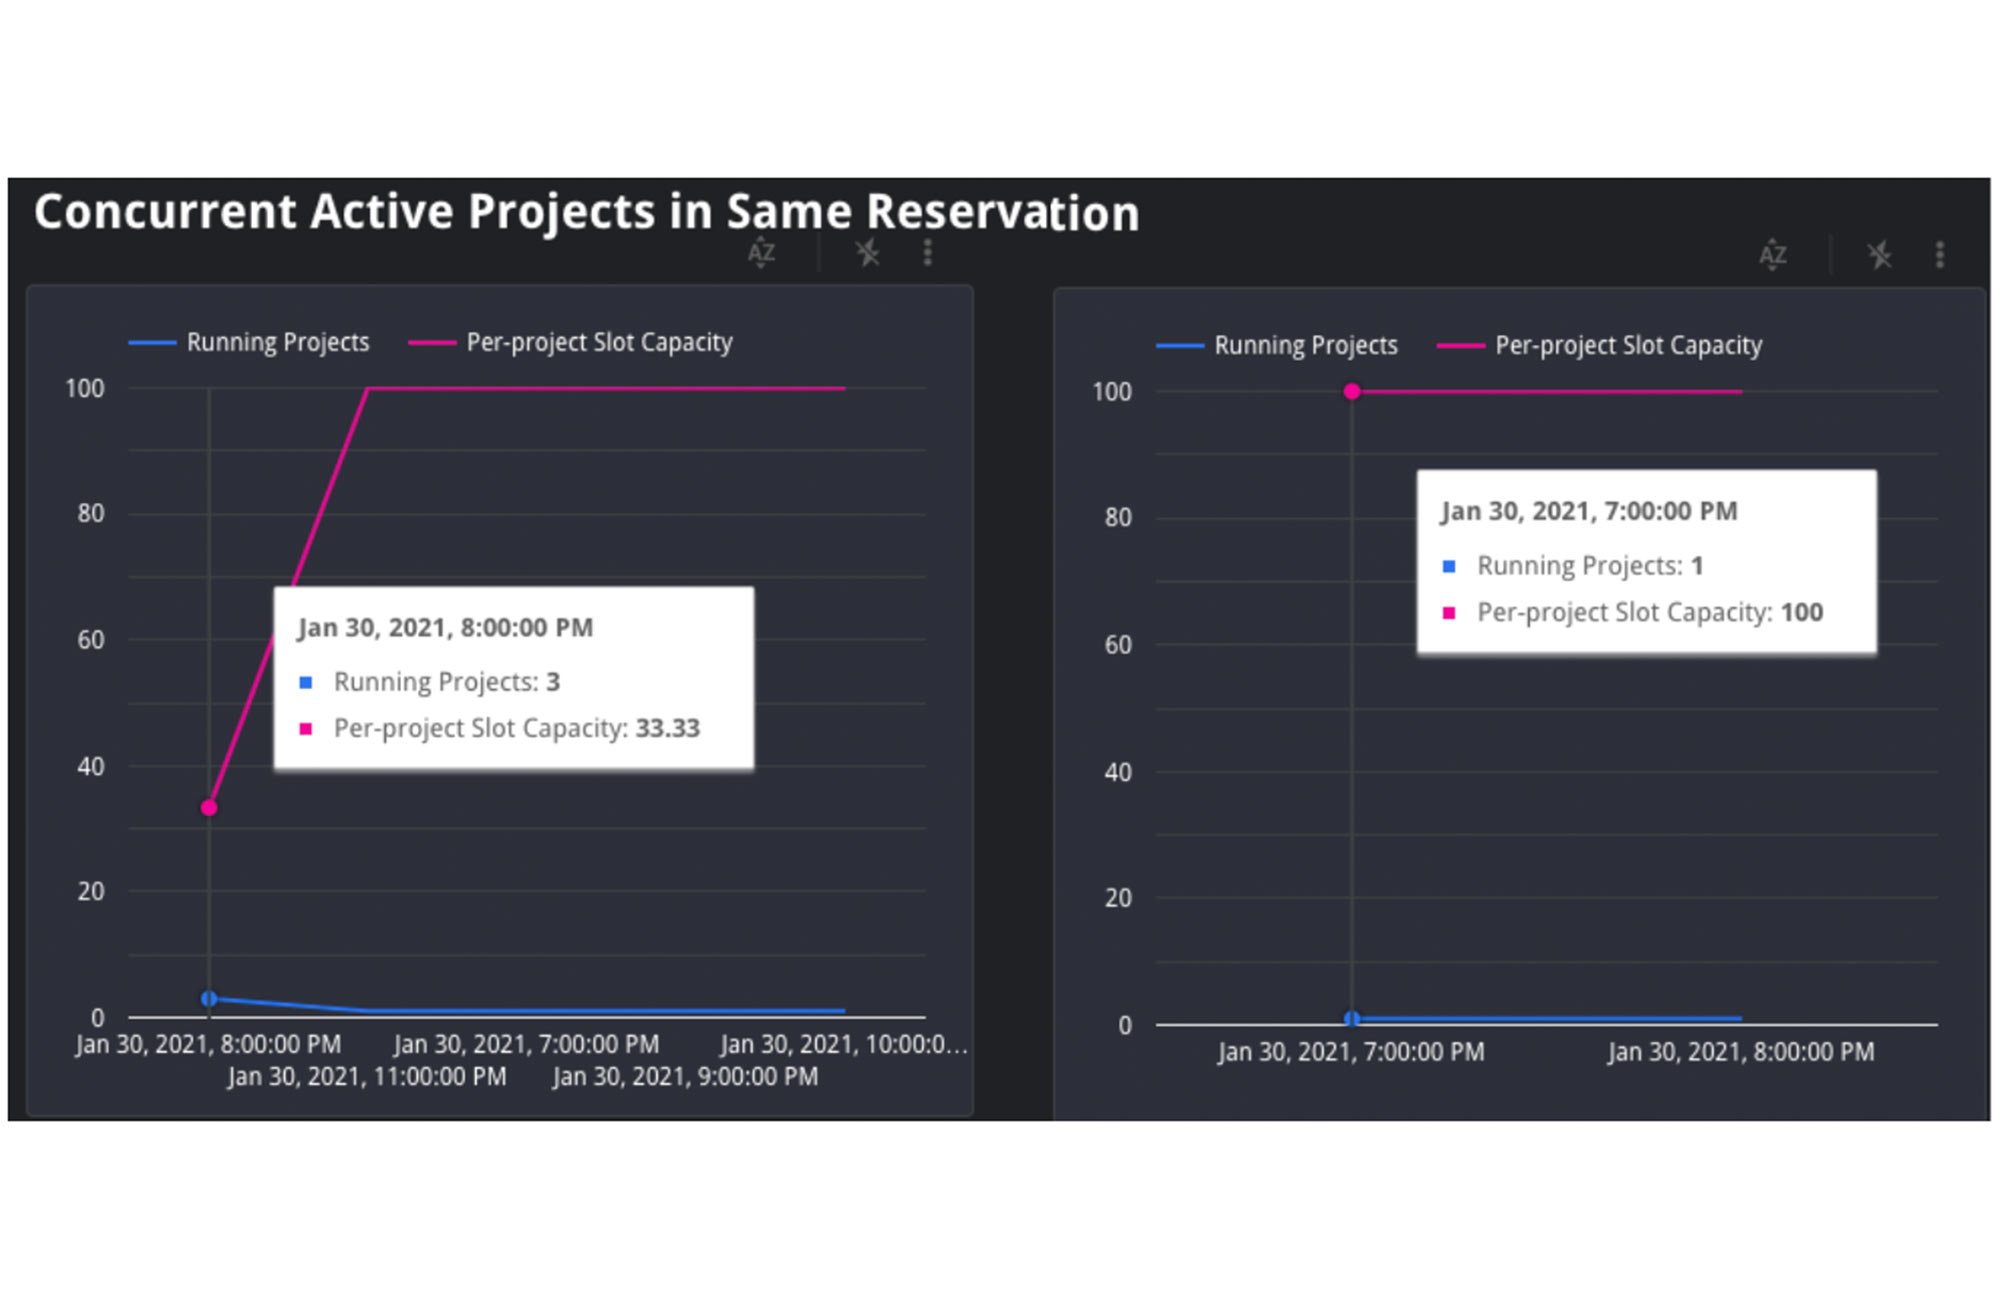

In the graph above, we can see that when the job on the left began, there were three total active projects at the same time, competing for the reservation’s 35 slots. In this scenario, each project received 1/3 of the reservation’s 35 slots, or about 12 slots. However, in the graph on the right, we can see that there was only one active project, meaning that specific job received all 35 slots.
2. Concurrent Jobs: Similarly, we can also use the JOBS_BY_PROJECT timeline view to understand the behavior inside of the project itself. If the number of concurrent jobs is high, this means all of the jobs are competing for resources at the same time. Since the demand is high, there are less available slot resources for each job, meaning that the query may take slower than usual to complete.
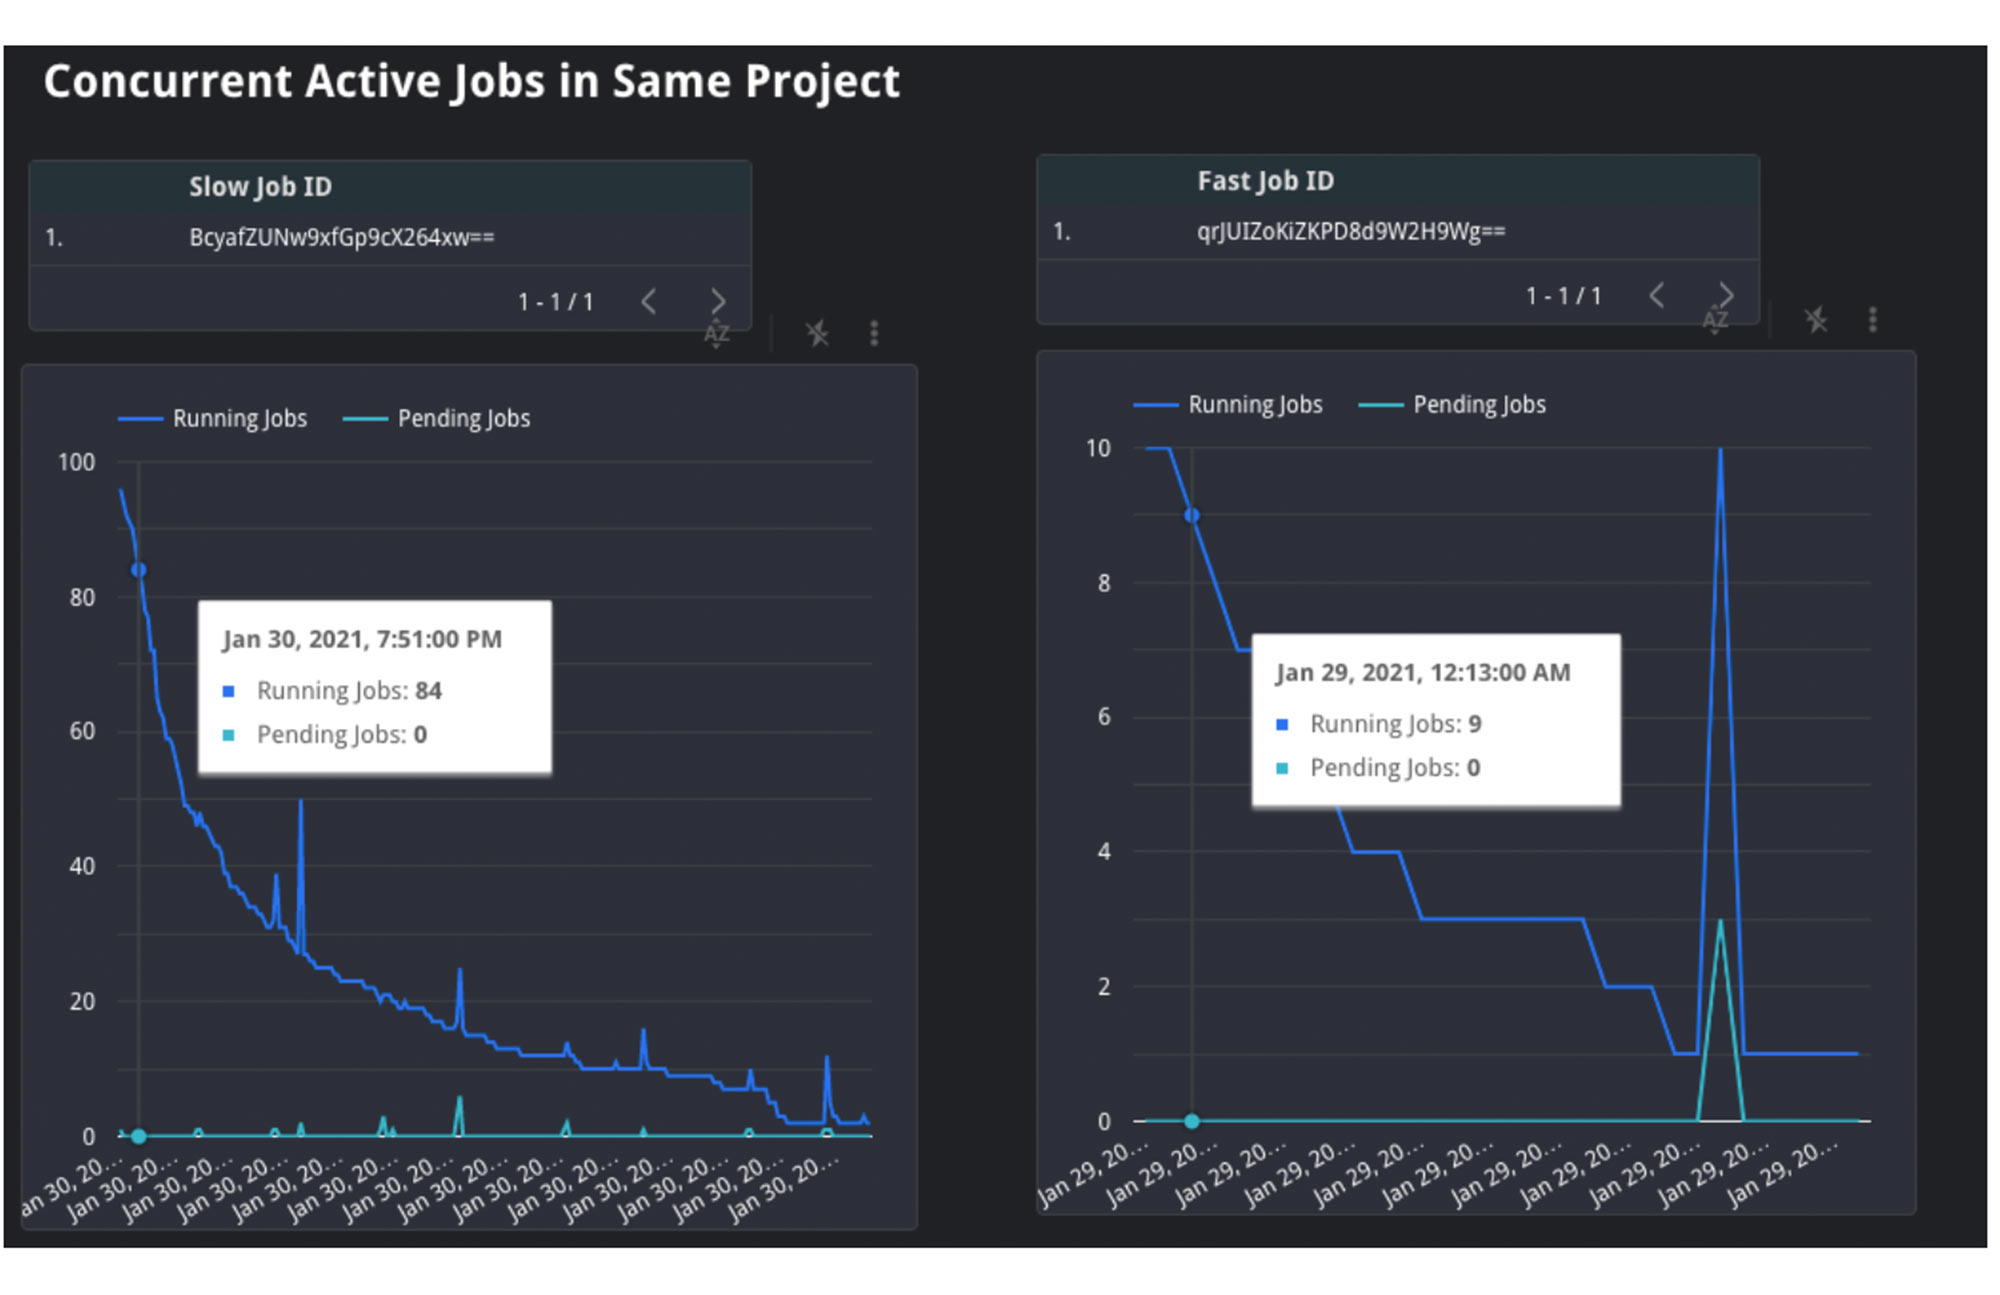

In the graph above, you can see that the slow query, on the left, was competing with between 20 and 100 other jobs over the course execution. However, the fast job, on the right, was only competing with between four and 26 other jobs over its execution. This shows that the volume of active jobs at the same time as the job on the left was likely the reason for the slow speed and long duration.
3. Lastly, we can also try to understand if idle slots were used. Idle slots are an optional configuration for reservations. If you enable them, you allow any available slots to be shared between reservations, so that unused slots are not wasted by non-active reservations. If a job had access to idle slots when it first ran, it likely would have executed faster than without them, as the extra idle slots, coupled with the reservation’s normal allocation, gave it more resources to execute. Unfortunately, we can’t view this today in INFORMATION_SCHEMA. However, we can make a best guess about if idle slots were available by look at the reservation’s utilization percentage during execution; if utilization for the reservation was greater than 100%, this means that it must have borrowed slots from another reservation.
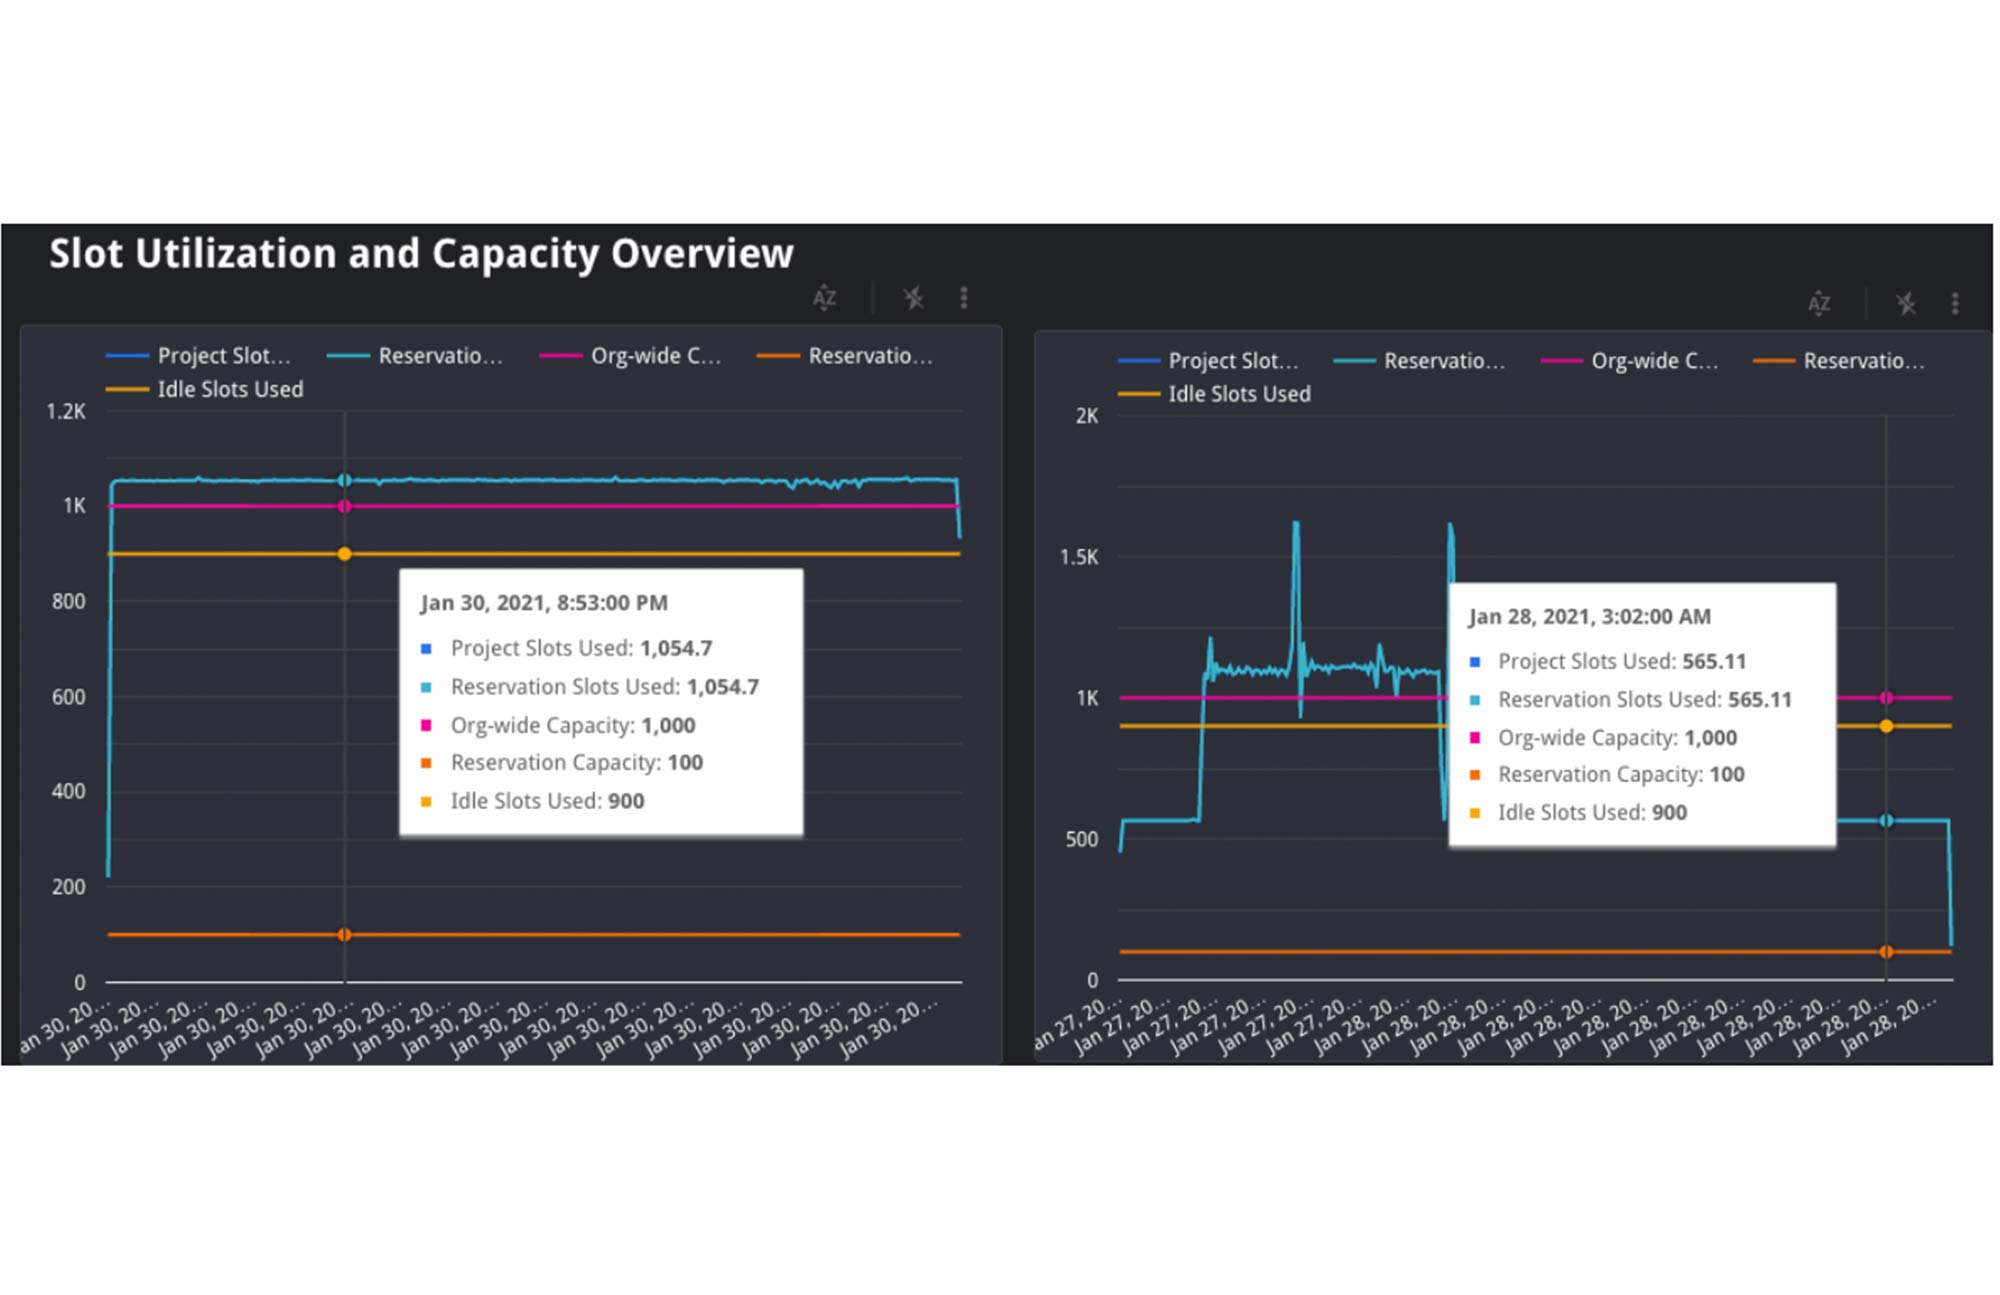

In the graph above, you can see both the organization and reservation’s capacity, as well as the amount of slots used by the reservation. In this case, the jobs in the same reservation on the left used 1,055 slots, which is more than its capacity of 100.Because the organization has a capacity of 1,000, and the reservation only has 100, it must have used 900 remaining idle slots from another reservation in the organization. Note: in rare cases, an organization may use more than its purchased capacity in the event of migrations within the data center or extra on-demand slots being used by projects within the organization.
Mitigation Options
If the root cause is slot contention, then this means you need a way to give your job access to more slots. You have a few options to do so:
1. Purchase more slots: This is the simplest option. You can purchase a new commitment for slots in the reservation, which will guarantee that there are more resources. You can purchase this in annual, monthly, or flex increments depending on your forecasting needs.
2. Reallocate slot proportions per reservation: If buying more total slots is not an option for your organization, you can reallocate your current slots between reservations based on priority. This might mean reassigning a certain amount of slots from reservation A to reservation B. Allocating these slots to reservation B’s assignment will help jobs in reservation B complete faster than before as it now has increased capacity, and reservation A’s will likely complete slower.
3. Reschedule jobs to minimize concurrent jobs: If you cannot move the resources between reservations, then you may be able to adjust the timing of jobs to maximize the utilization of your reservation over time. Move non-urgent jobs to off-peak hours, such as weekends or overnight. If you can spread the load over different times of day, this will reduce the competition for slots at peak hours. You can examine the Hourly Utilization report to better understand trends.
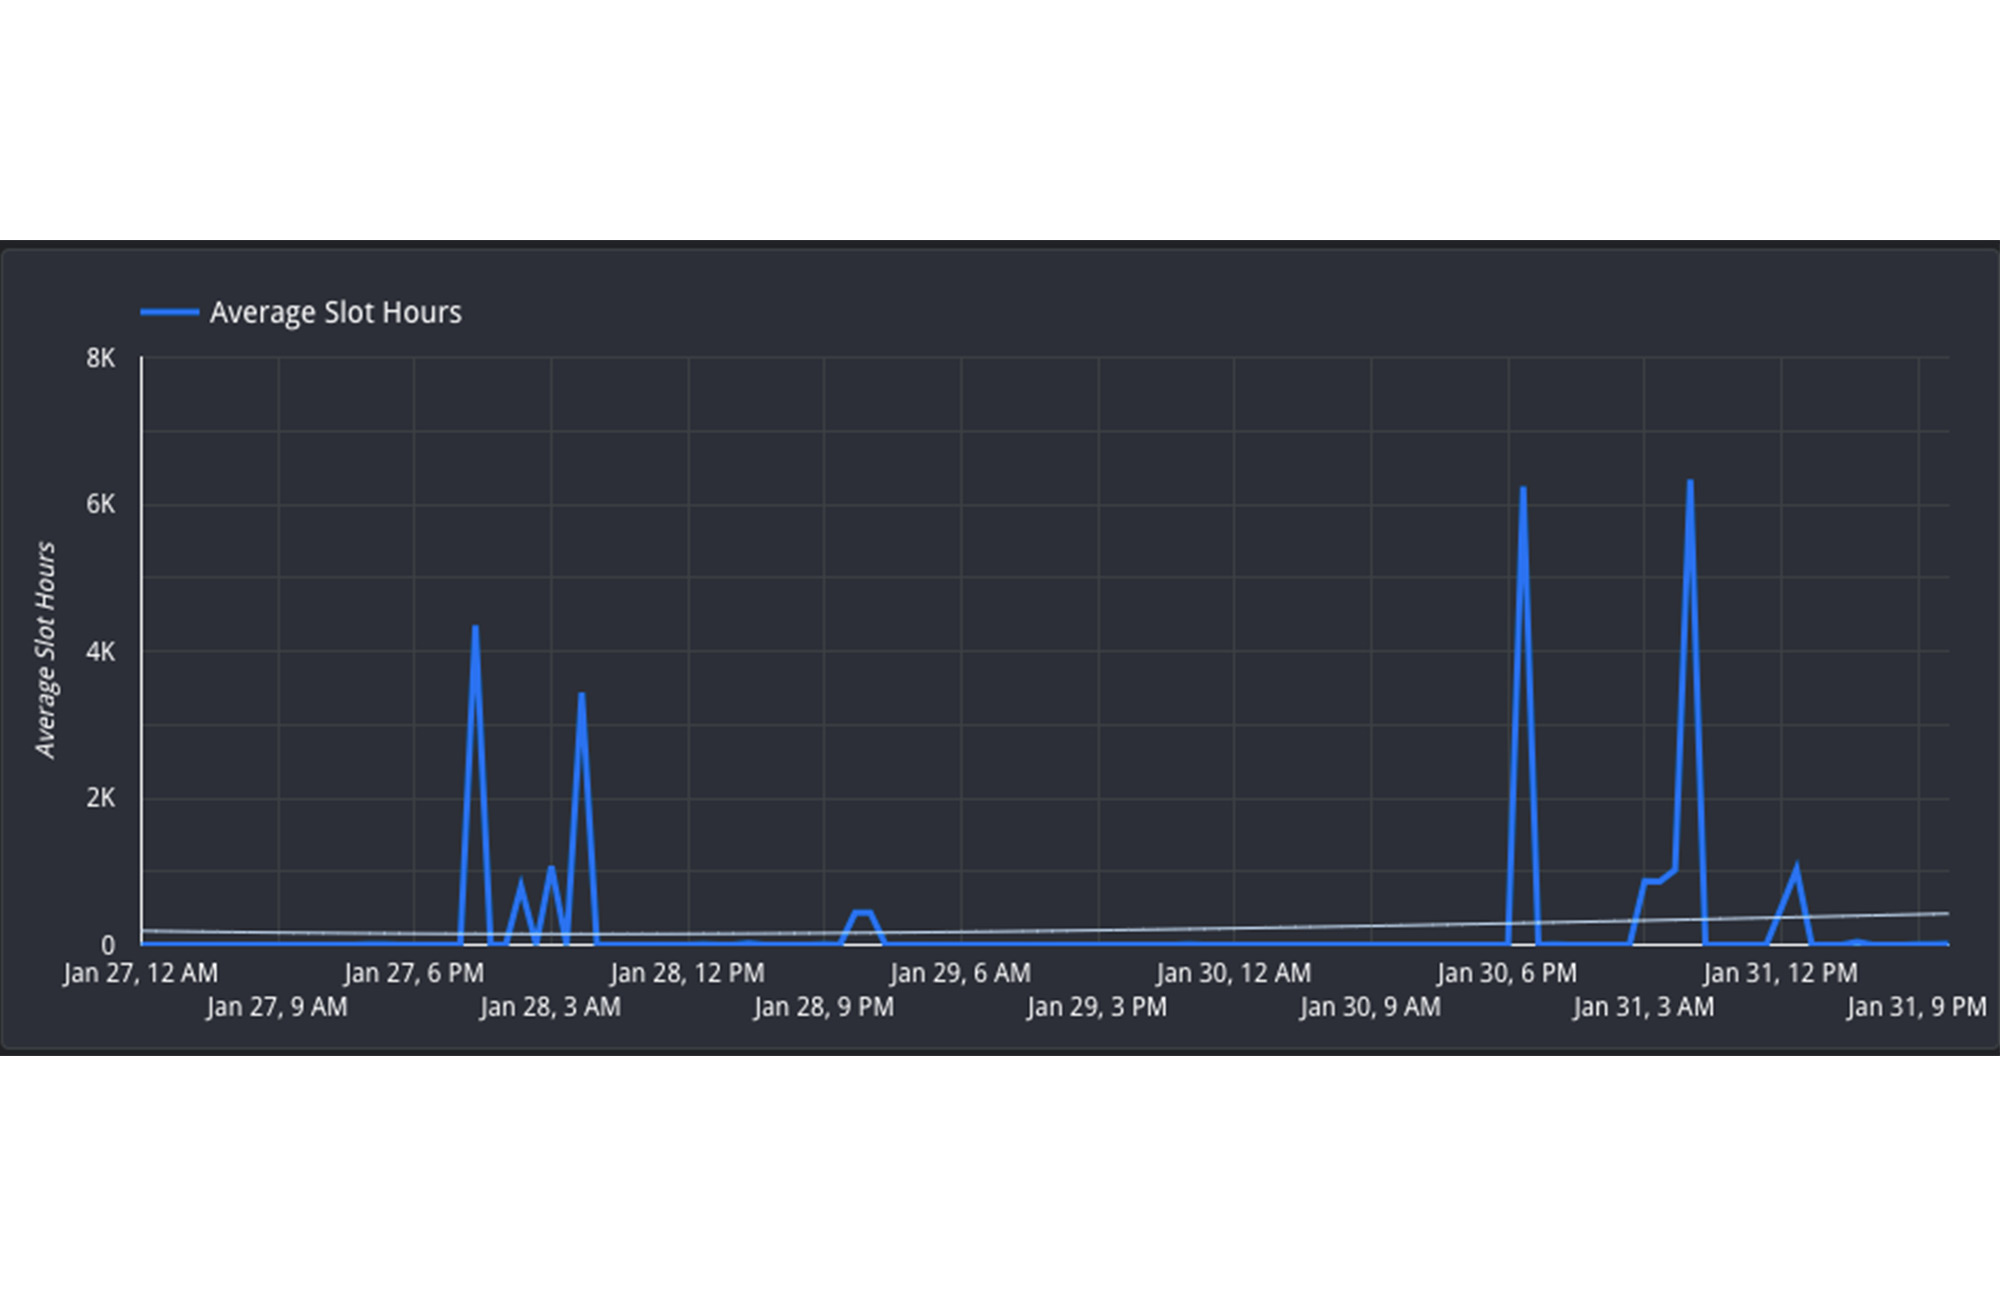

In this view, you can see that the reservation is active between 4PM-8AM UTC on both January 27 and January 30. However, the hours between 8AM-4PM UTC are less utilized and therefore can be considered “off peak”. It would be beneficial to try to reschedule the jobs to be between 8AM-4PM to allow for more distributed resource usage.
2. Changes in Data Shape
Background
Another potential reason for unexpected changes in duration could be the underlying data itself. This can happen in two ways: either the underlying source tables contain more data than prior runs, or intermediate subqueries may result in more data being processed as the query executes.
Monitoring
First, you can check if the “total bytes processed” field increased from changes in the query. If this increased from the fast job to the slow job, then this means the job had to process more than usual. We can confirm the root cause in two ways:
1. If it increased, then this means overall the query had more data to analyze. Verify that the query text itself did not change; if a JOIN moved, or if a WHERE clause updated its filtering, this can mean more data to read.
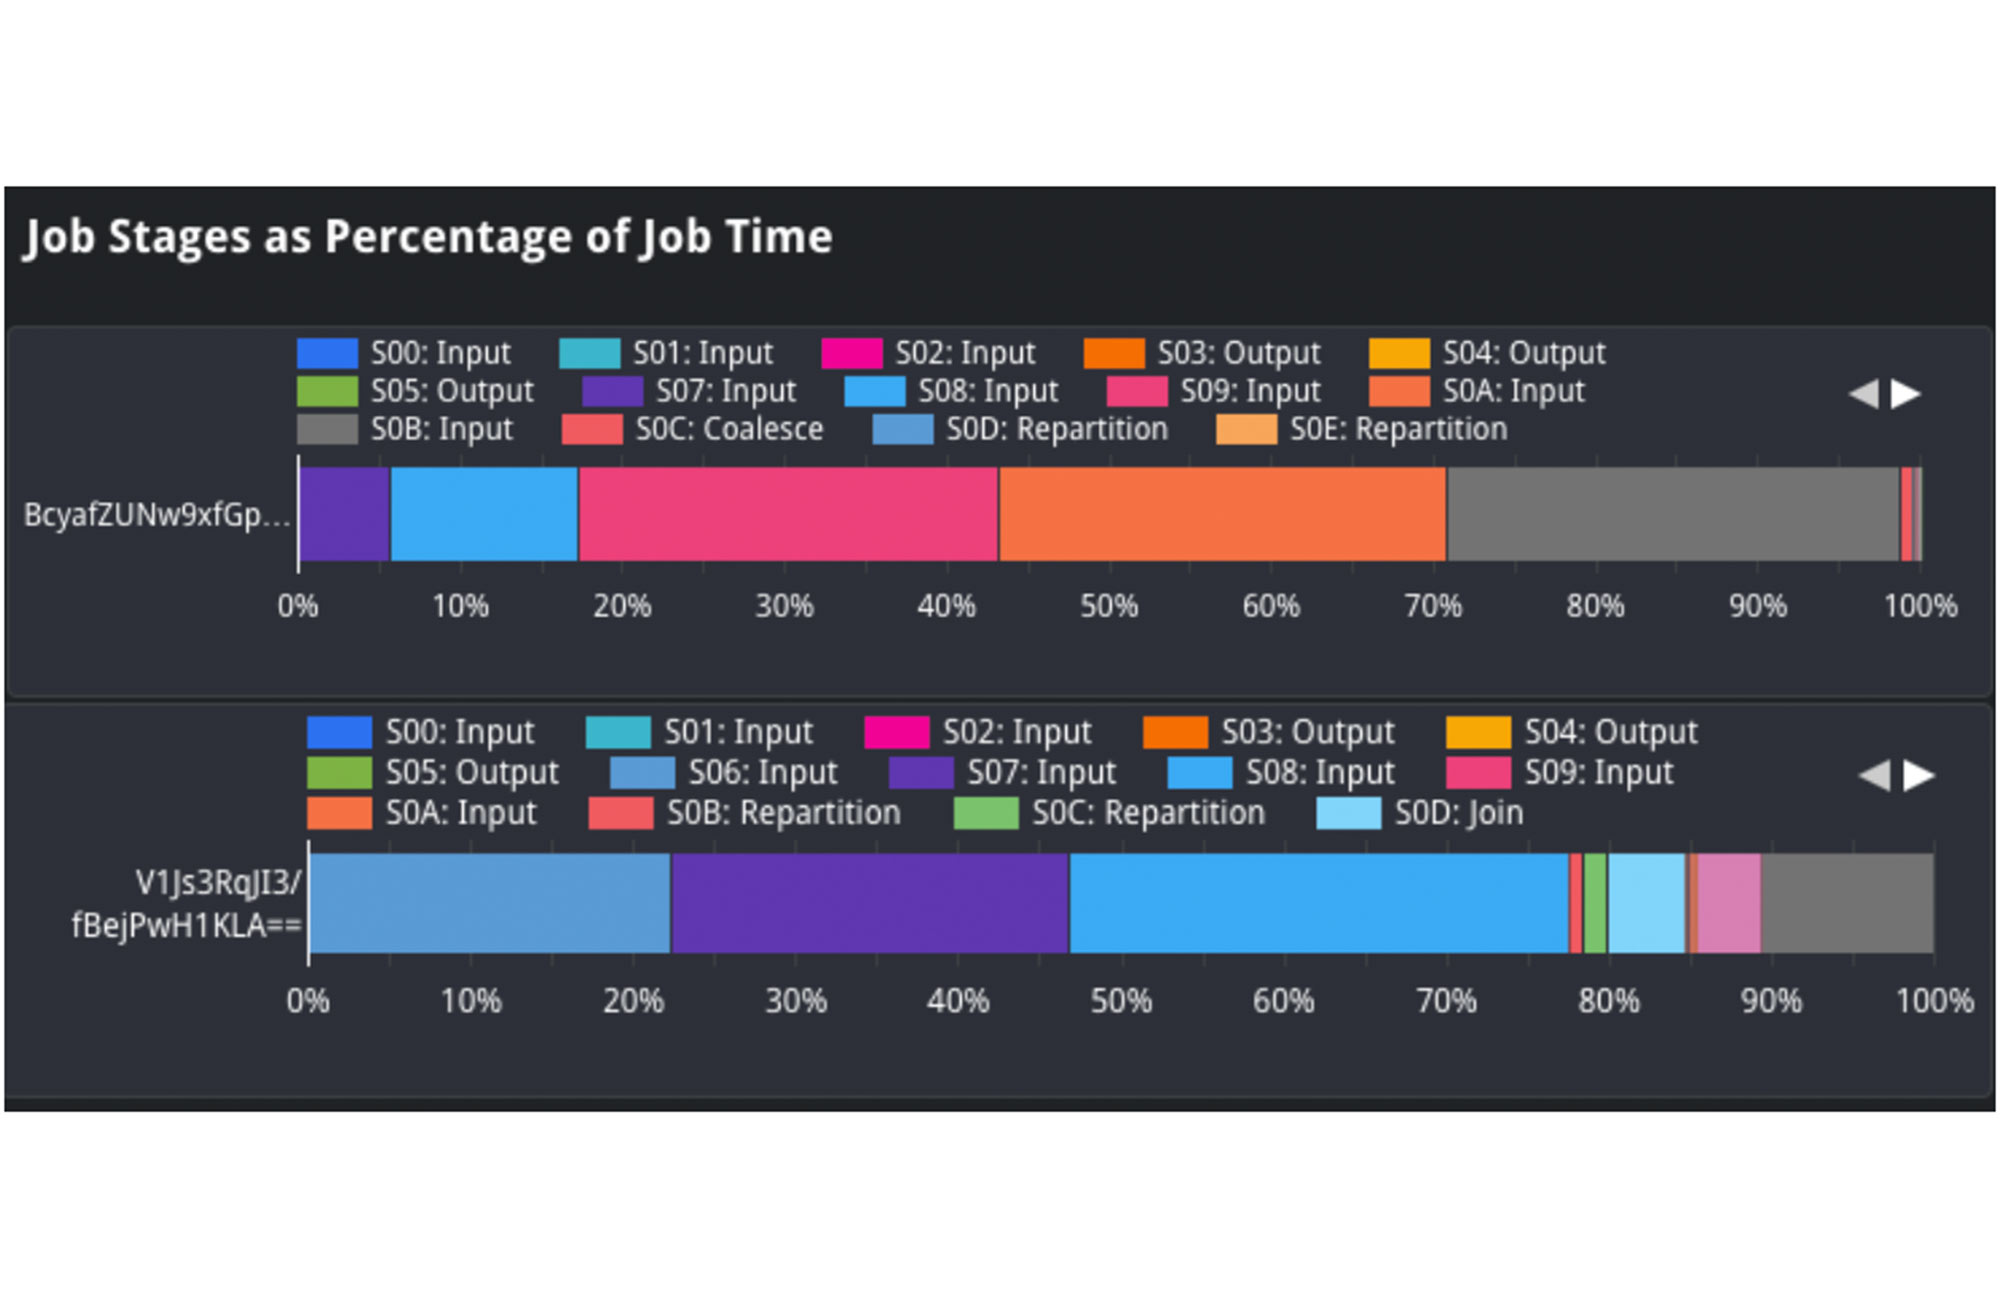

In the job stages as a percentage of job time view, we can analyze the shape of the input data and compare it between queries. For example, we can compare the "input" percentage between the slow and fast job, which indicates how much data was ingested. If we examine stage 2 input, we see it took about 25% of processing time in the job on top. However, in the job on the bottom, it took about 1-2% of processing time. This indicates that the source table ingested at stage 2 likely grew, and could explain why the job was slower.
2. We should also analyze the size of the source tables for the query. We’ll view the referenced_tables field as this will show all source tables used by the query. We will compare the size of each source data at the time of the query. If the size increased significantly, then this is likely a reason for slowness.
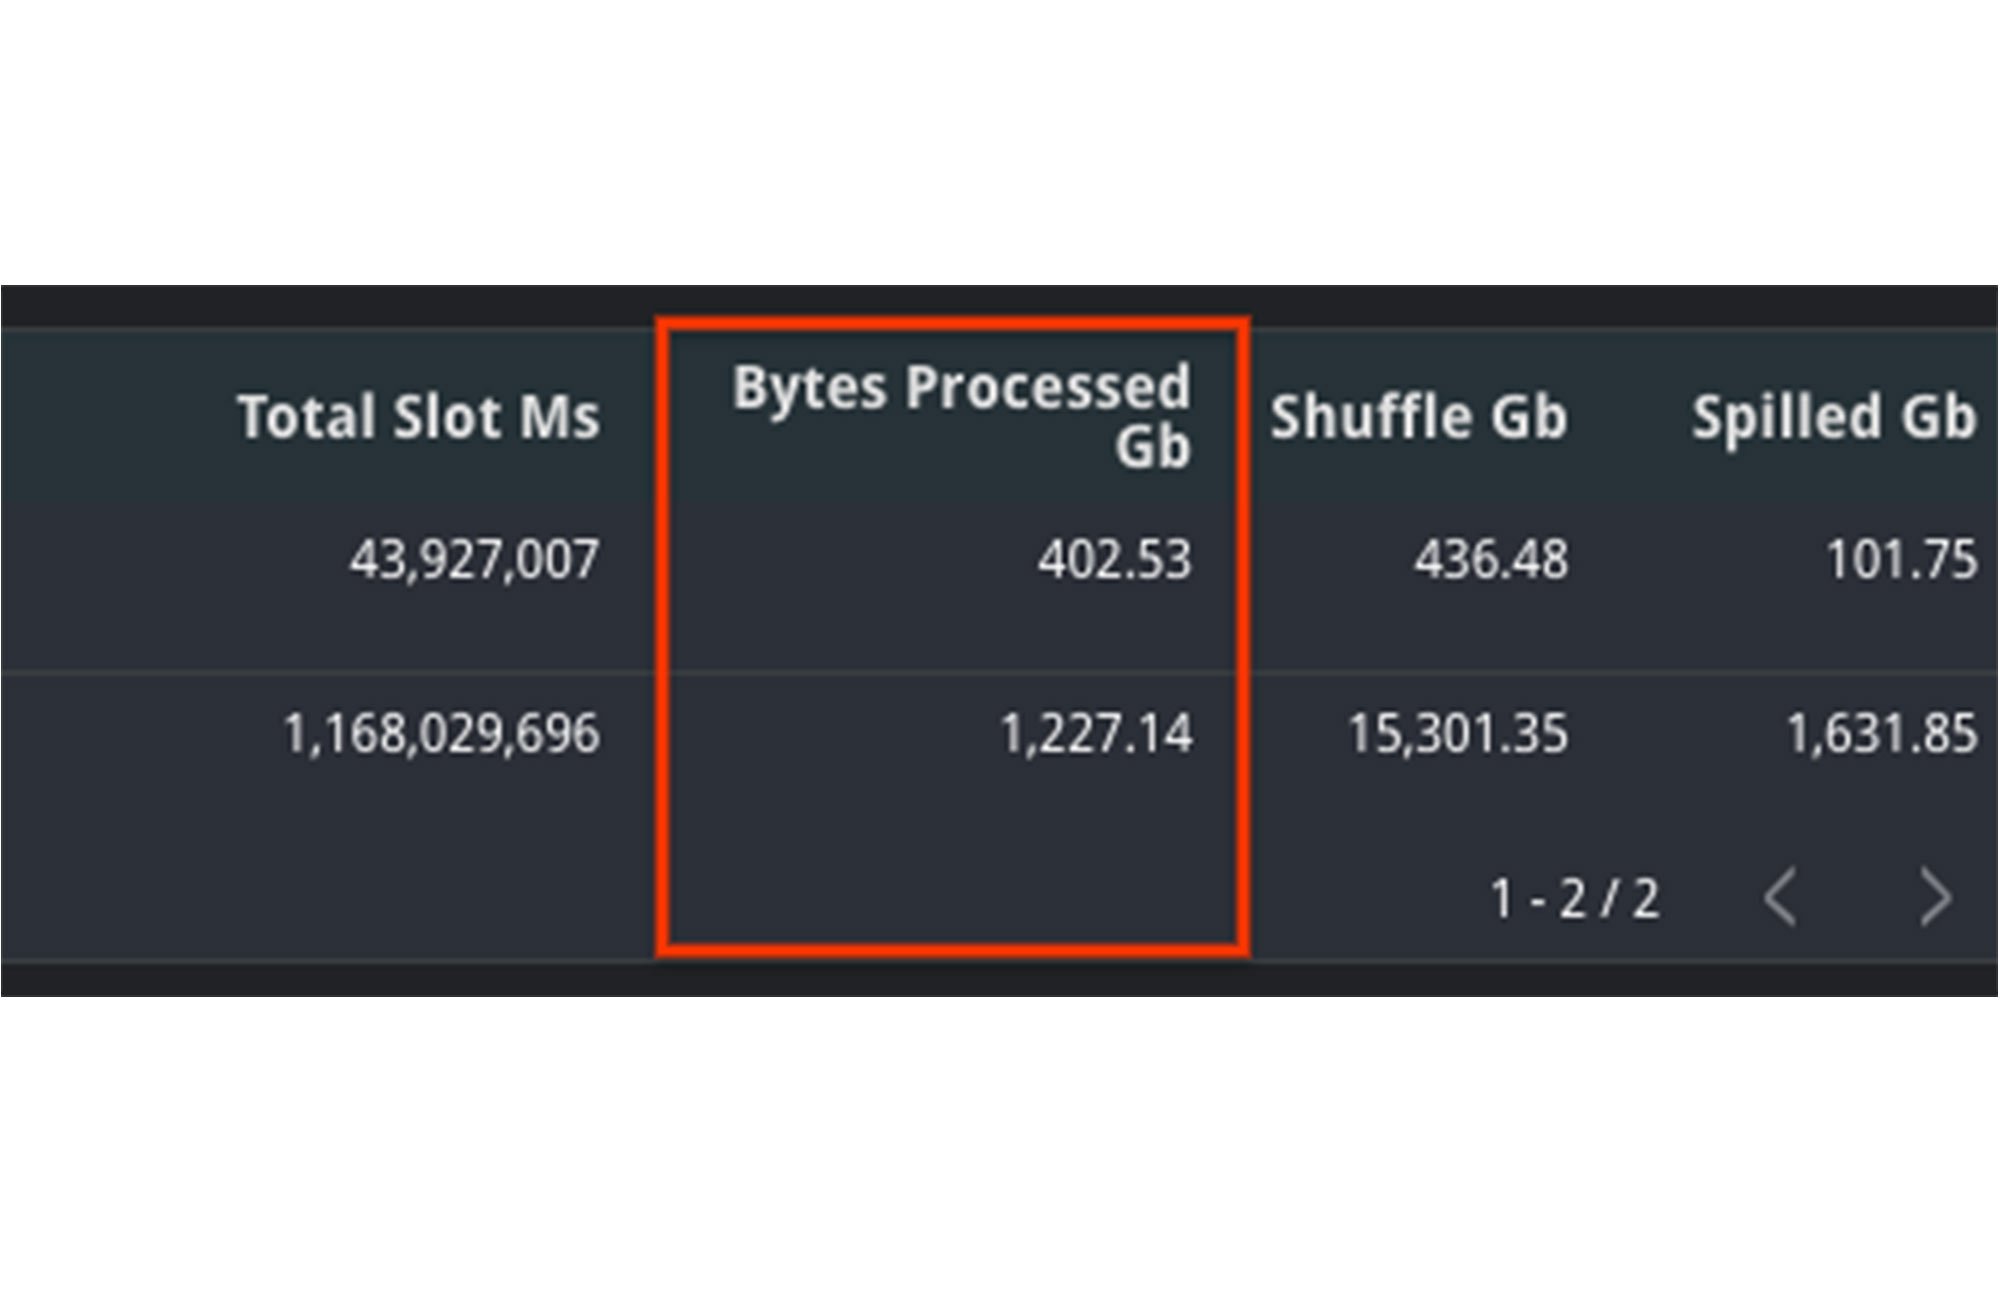

In this example, we can see that the amount of bytes processed increased significantly between jobs. This is likely the reason for slowness. We can additionally verify this with the fact that total_slot_ms increased, meaning that it had more slots available and still took longer.
Mitigation Options
1. Clustering: Depending on your query, you may be able to use clustering to help improve the performance. Clustering will help queries that use filtering and aggregation, as clustering sorts similar columns together. This will reduce the amount of data scanned, but will only show large performance improvements for tables greater than a gigabyte.
2. Minimize input data: In order to mitigate this, try to find out if there is any way to optimize the query text to read only the required data. Some options to do this include filtering early, such as adding WHERE statements in the beginning of the query to filter out unnecessary records or modify the SELECT statement to only include the needed columns, rather than a SELECT *.
3. Denormalize your data: if your data involves parent-child or other hierarchical relationships, try to use nested and repeated fields in your schema. This allows BigQuery to parallelize execution and complete faster.3. Increased Shuffle Memory
Background
While jobs use slots for the compute resources, they also use shuffle memory to keep track of the job’s state to transition data between execution stages as the query progresses. This shared state ultimately allows for parallel processing and optimizations of your query. Your shuffle memory is correlated to the amount of slots available in a reservation.
Because shuffle is an in-memory operation, there is only a finite amount of memory available for each stage of the query. If there is too much data being processed at any point in time, such as a large join, or if there is a high data skew between joins, it’s possible that a stage can become too intensive and exceed its shuffle memory quota. At this point, shuffle bytes will spill to disk, which causes queries to slow down.
Monitoring
To diagnose this, you should look at two different metrics: both the shuffle memory consumed by the job as well as the slots used. Your shuffle memory quota is tied to your slot capacity, so a stable amount of slots alongside an increase in the amount of shuffle spilled to disk would indicate that this could be the root cause.
Compare the aggregate shuffle_output_bytes_spilled_to_disk from the TIMELINE view. An increase in bytes spilled to disk suggests that the jobs are stuck, rather than running fast enough to complete on time.
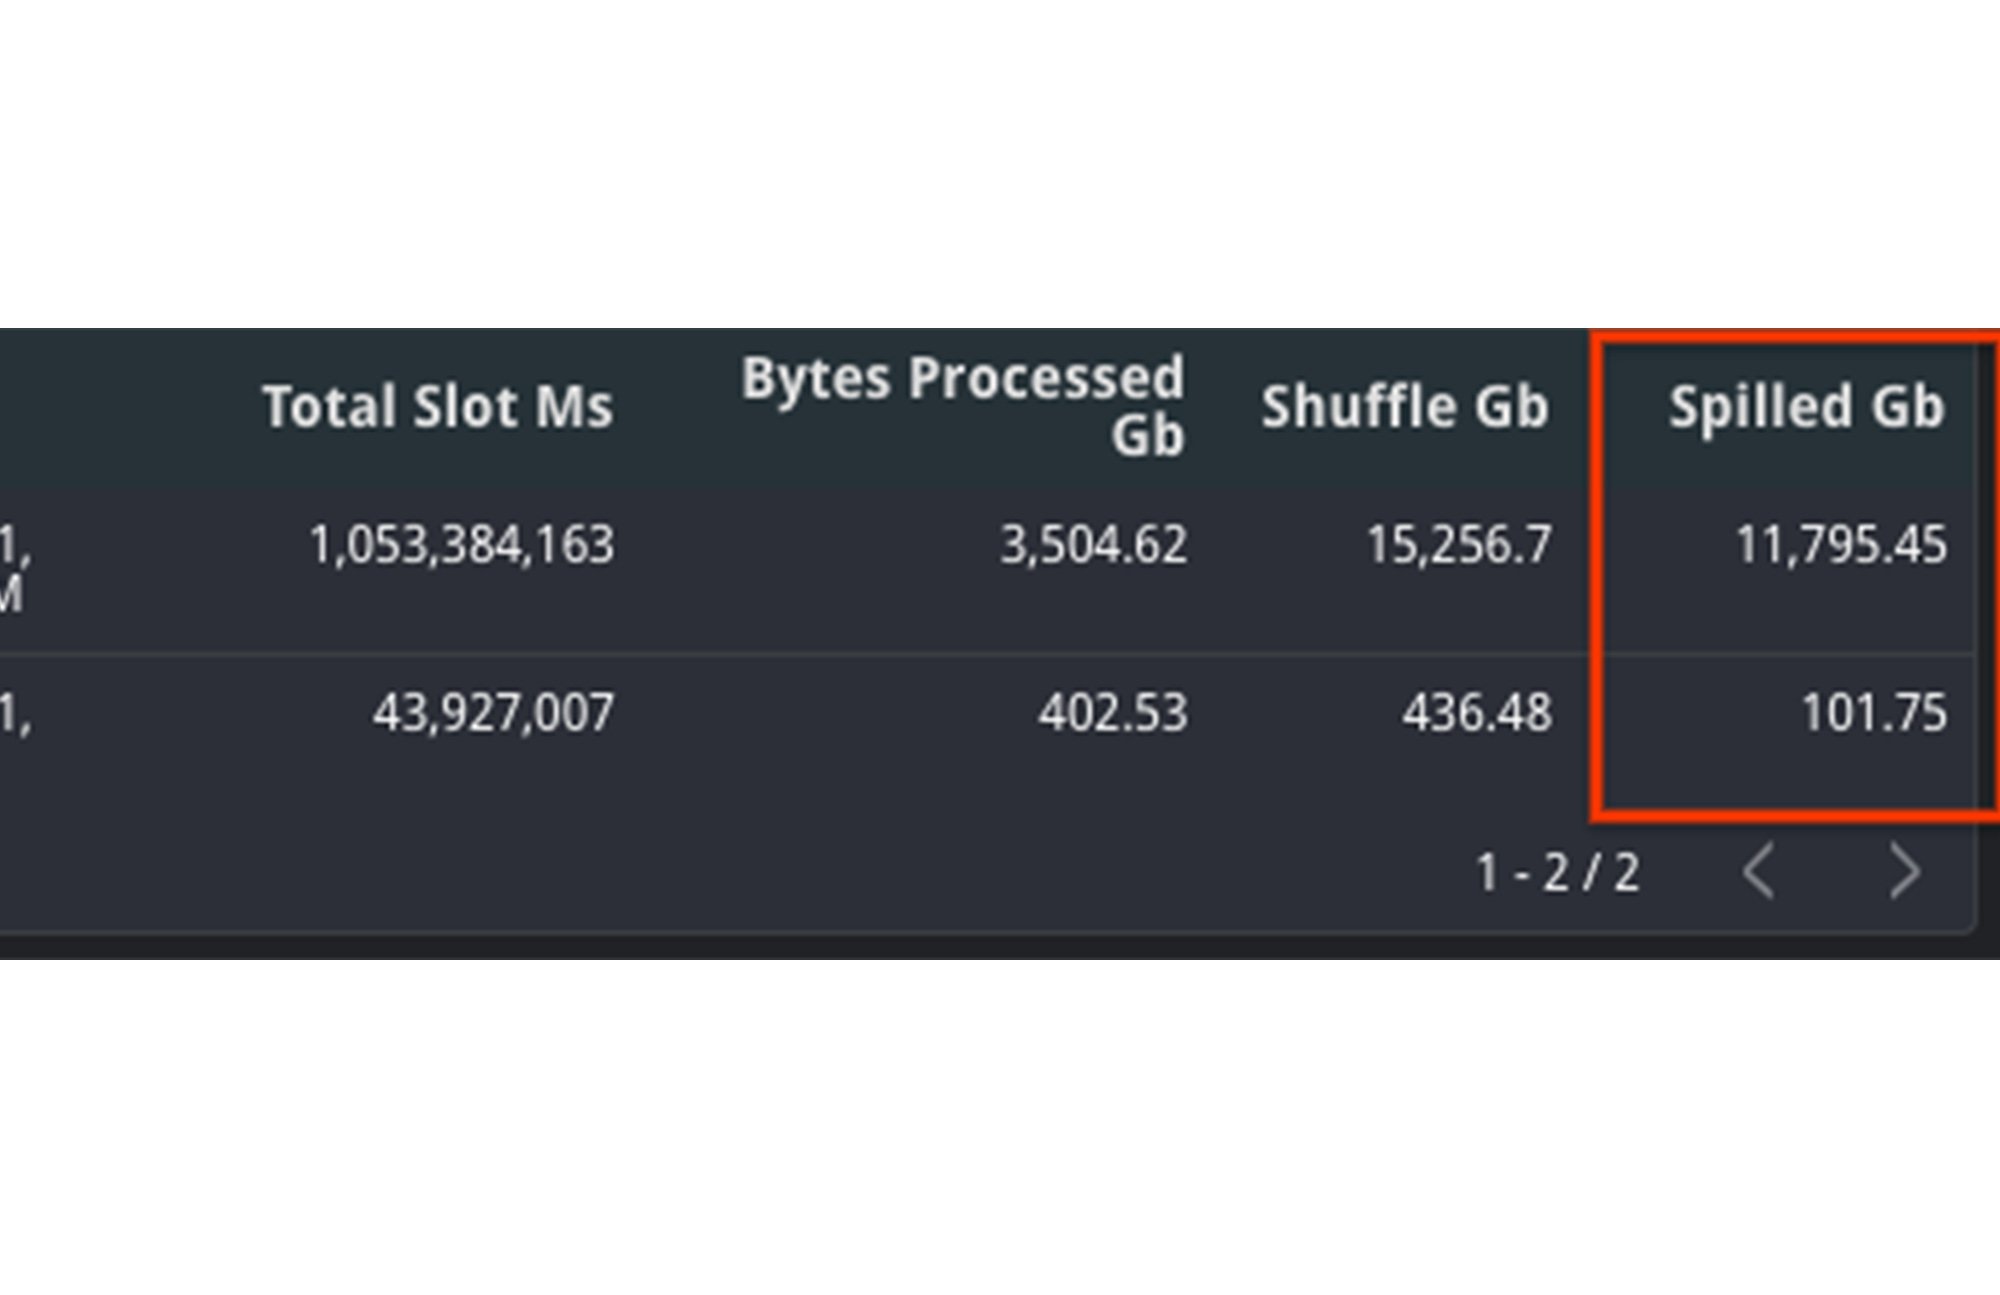

In this example, you can see that the amount of data spilled to disk is significantly higher for the slow query. Additionally, the total slots have increased as well, meaning that it had more resources available and still took longer to complete.
Mitigation Options
An increase of bytes spilled to disk means that BigQuery is having trouble maintaining state between query execution stages. Because of this, you should try to optimize the query plan itself so that less bytes are passed between stages.
1. Filter data early: Reduce the amount of data ingested by the query by filtering early with WHERE clauses and before joining tables. Additionally, ensure that you are not using SELECT *, and are only selecting the necessary columns.
2. Use partitioned tables over sharded tables: If you’re using sharded tables, try to use partitioned tables instead. Sharded tables require BigQuery to maintain a copy of the schema and metadata, in addition to maintaining state, which can decrease performance.
3. Increase slots: Because the amount of shuffle memory is correlated to the amount of slots, increasing the amount of slots can help alleviate the amount of memory spilled to disk. As mentioned in the Slot Contention mitigation steps, you can do so via purchasing a new commitment or reallocating more slots to this particular reservation.
4. Rewrite the query: Because the job cannot maintain the state of data between stages, your other option is to rewrite the query to improve performance. This might mean trying to optimize against SQL anti-patterns by reducing the number of subqueries or eliminating CROSS JOINs. Additionally, you can consider breaking the query up into numerous chained queries and storing the output data between queries into temporary tables.
4. Priority Mode
Background
In BigQuery, queries can execute in either one of two methods of priority: interactive or batch. By default, BigQuery executes jobs in interactive mode, meaning that it executes as soon as resources are available.
Monitoring
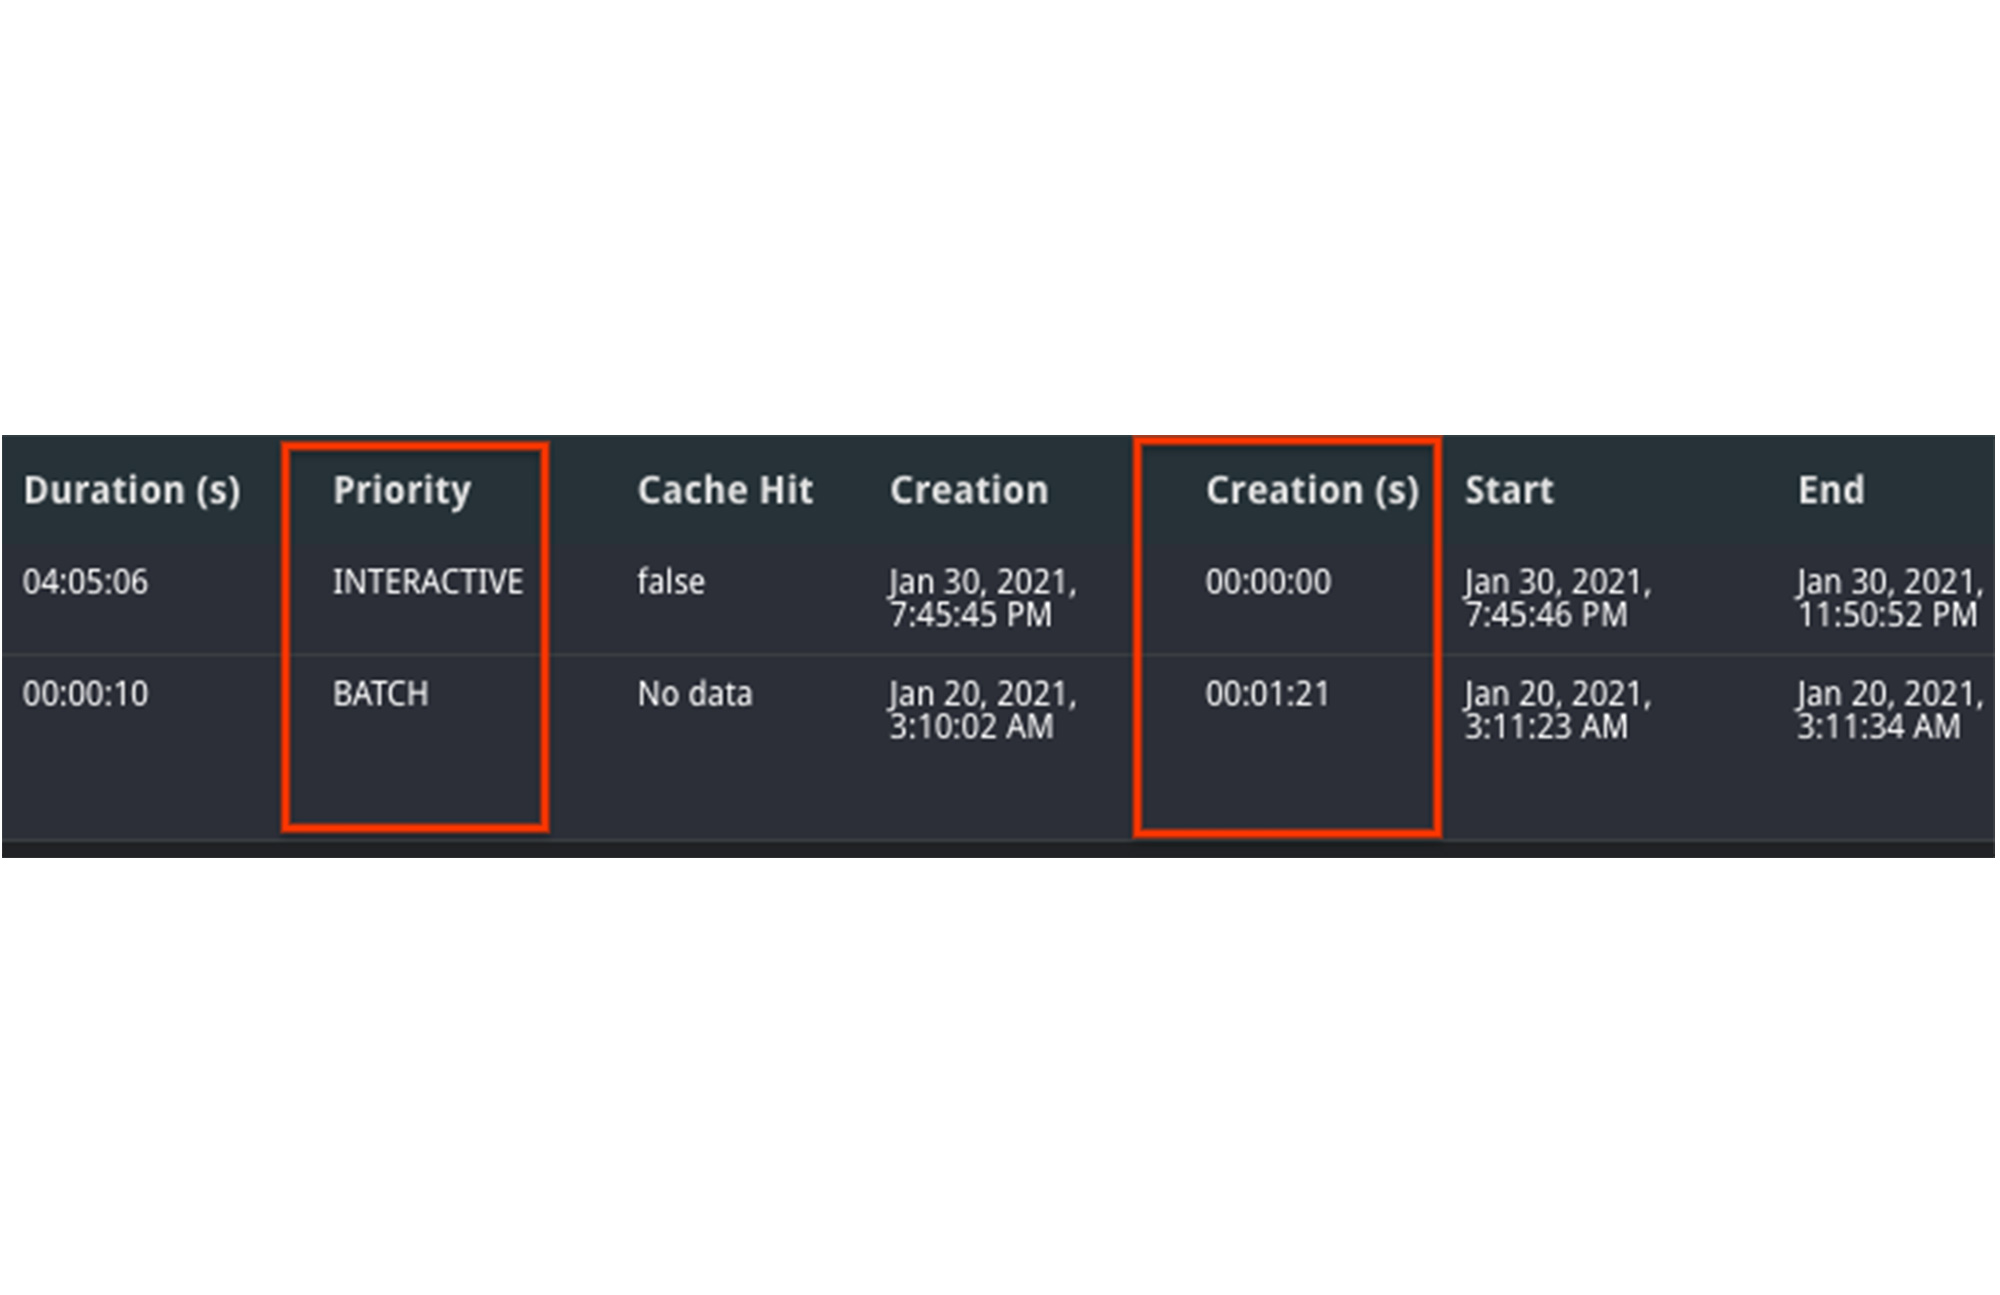

1. You can find your mode by inspecting the priority column of the job. A job may run slower as a batch job than as an interactive job.
2. If both jobs were run in batch mode, compare the state over time. It’s possible that one job was queuing in the PENDING state for a long time, meaning that there weren’t resources available to run at creation time. You can verify this by looking at the Creation (s) time in the table, as this displays how long it was queued before starting.
1. Understand the relative priorities and SLOs for the jobs. If your organization has less critical jobs, try to run them in batch mode, so that you can let more critical jobs finish first. The batch jobs may queue up and wait to run until interactive jobs finish and/or idle slots are available.
2. Identify the concurrency quota difference between batch and interactive jobs. Batch and interactive jobs have different concurrency quotas. By default, projects are limited to 100 concurrent interactive queries. You can contact your sales team or support to look into raising this limit, if necessary. Batch jobs will also be queued, as necessary, to ensure that interactive jobs finish before the 6-hour timeout window.
3. Similar to the mitigations presented in slot contention, you can consider either purchasing more slots for the reservation or rescheduling your job at off-peak hours when there is less demand for resources.
As you can see, there are many ways to troubleshoot your query jobs based on the data from INFORMATION_SCHEMA. Try it out yourself here with any two job IDs.

