Best practices of Dataproc Persistent History Server
Anu Venkataraman
Strategic Cloud Engineer
Blake DuBois
Data Architect, Google Cloud
Try Google Cloud
Start building on Google Cloud with $300 in free credits and 20+ always free products.
Free trialWhen running Apache Hadoop and Spark, it is important to tune the configs, perform cluster planning, and right-size compute. Thorough benchmarking is required to make sure the utilization and performance are optimized. In Dataproc, you can run Spark jobs in a semi-long-running cluster or ephemeral Cloud Dataproc on Google Compute Engine (DPGCE) cluster or via Dataproc Serverless Spark. Dataproc Serverless for Spark runs a workload on an ephemeral cluster. An ephemeral cluster means the cluster’s lifecycle is tied to the job. A cluster is started, used to run the job, and then destroyed after completion. Ephemeral clusters are easier to configure, since they run a single workload or a few workloads in a sequence. You can leverage Dataproc Workflow Templates to orchestrate this. Ephemeral clusters can be sized to match the job’s requirements. This job-scoped cluster model is effective for batch processing. You can create an ephemeral cluster and configure it to run specific Hive workloads, Apache Pig scripts, Presto queries, etc., and then delete the cluster when the job is completed.
Ephemeral clusters have some compelling advantages:
They reduce unnecessary storage and service costs from idle clusters and worker machines.
Every set of jobs runs on a job-scoped ephemeral cluster with job-scoped cluster specifications, image version, and operating system.
Since each job gets a dedicated cluster, the performance of one job does not impact other jobs.
Persistent History Server (PHS)
The challenge with ephemeral clusters and Dataproc Serverless for Spark is that you will lose the application logs when the cluster machines are deleted after the job. Persistent History Server (PHS) enables access to the completed Hadoop and Spark application details for the jobs executed on different ephemeral clusters or serverless Spark. It can list running and completed applications. PHS keeps the history (event logs) of all completed applications and its runtime information in the GCS bucket, and it allows you to review metrics and monitor the application at a later time. PHS is nothing but a standalone cluster. It reads the Spark events from GCS, then parses and presents application details, scheduler stages, and task level details, as well as environment and executor information, in the Spark UI. These metrics are helpful for improving the performance of the application. Both the application event logs and the YARN container logs of the ephemeral clusters are collected in the GCS bucket. These log files are important for engaging Google Cloud Technical Support to troubleshoot and explore. If PHS is not set up, you have to re-run the workload, which adds to support cycle time. If you have set up PHS, you can provide the logs directly to Technical Support.
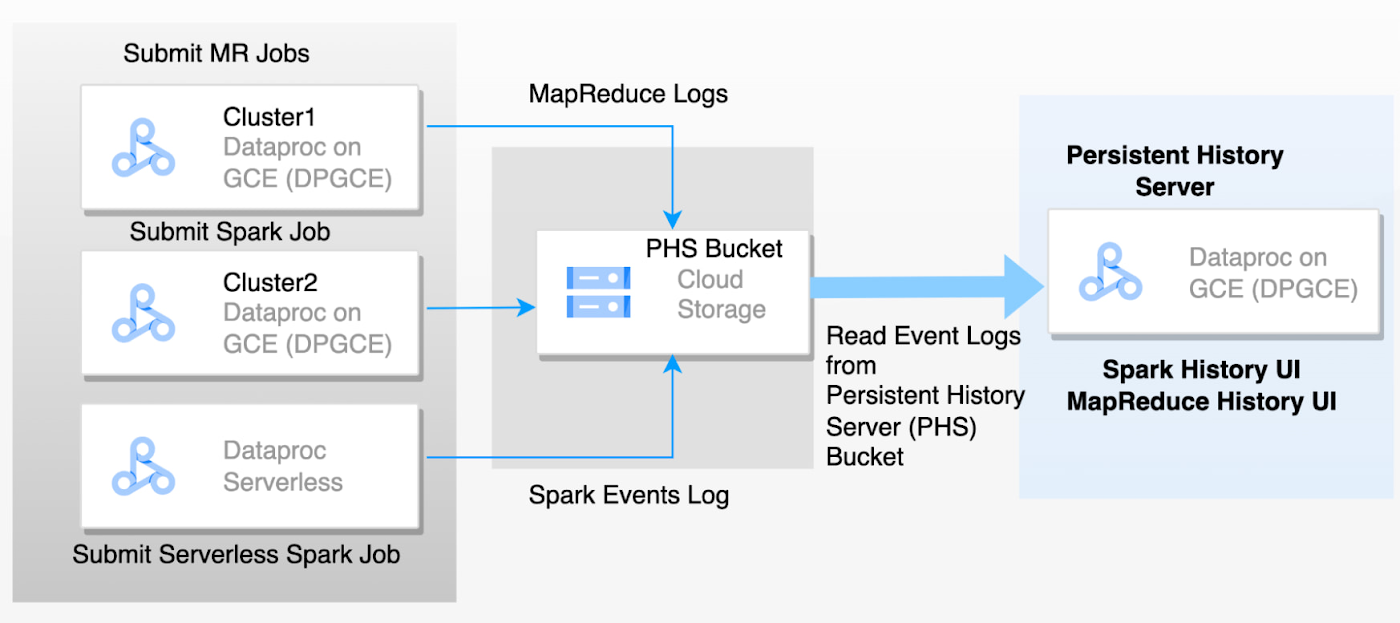
The following diagram depicts the flow of events logged from ephemeral clusters to the PHS server:
In this blog, we will focus on Dataproc PHS best practices. To set up PHS to access web interfaces of MapReduce and Spark job history files, please refer to Dataproc documentation.
PHS Best Practices
Cluster Planning and Maintenance
It's common to have a single PHS for a given GCP project. If needed, you can create two or more PHSs pointing to different GCS buckets in a project. This allows you to isolate and monitor specific business applications that run multiple ephemeral jobs and require a dedicated PHS.
For disaster recovery, you can quickly spin up a new PHS in another region in the event of a zonal or regional failure.
If you require High Availability (HA), you can spin up two or more PHS instances across zones or regions. All instances can be backed by the dual-regional or multi-regional GCS bucket.
You can run PHS on a single-node Dataproc cluster, as it is not running large-scale parallel processing jobs. For the PHS machine type:
N2 are the most cost-effective and performant machines for Dataproc. We also recommend 500-1000GB pd-standard disks.
For <1000 apps and if there are apps with 50K-100K tasks, we suggest n2-highmem-8.
For <1000 apps and there are apps with 50K-100K tasks, we suggest n2-highmem-8.
For >10000, we suggest n2-highmem16.
We recommend you benchmark with your Spark applications in the testing environment before configuring PHS in production. Once in production, we recommend monitoring your GCE backed PHS instance for memory and CPU utilization and tweaking machine shape as required.
In the event of significant performance degradation within the Spark UI due to a large amount of applications or large jobs generating large event logs, you can recreate the PHS with increased machine size with higher memory.
As Dataproc releases new sub-minor versions on a bi-weekly cadence or greater, we recommend recreating your PHS instance so it has access to the latest Dataproc binaries and OS security patches.
As PHS services (e.g. Spark UI, MapReduce History Server) are backwards compatible, it’s suggested to create a Dataproc 2.0+ based PHS cluster for all instances.
Logs Storage
Configure
spark:spark.history.fs.logDirectoryto specify where to store event log history written by ephemeral clusters or serverless Spark. You need to create the GCS bucket in advance.Event logs are critical for PHS servers. As the event logs are stored in a GCS bucket, it is recommended to use a multi-Region GCS bucket for high availability. Objects inside the multi-region bucket are stored redundantly in at least two separate geographic places separated by at least 100 miles.
Configuration
PHS is stateless and it constructs the Spark UI of the applications by reading the application’s event logs from the
GCS bucket. SPARK_DAEMON_MEMORYis the memory to allocate to the history server and has a default of 3840m. If too many users are trying to access the Spark UI and access job application details, or if there are long-running Spark jobs (iterated through several stages with 50K or 100K tasks), the heap size is probably too small. Since there is no way to limit the number of tasks stored on the heap, try increasing the heap size to 8g or 16g until you find a number that works for your scenario.If you’ve increased the heap size and still see performance issues, you can configure
spark.history.retainedApplicationsand lower the number of retained applications in the PHS.Configure
mapred:mapreduce.jobhistory.read-only.dir-patternto access MapReduce job history logs written by ephemeral clusters.By default,
spark:spark.history.fs.gs.outputstream.typeis set to BASIC. The job cluster will send data to GCS after job completion. Set this to FLUSHABLE_COMPOSITE to copy data to GCS at regular intervals while the job is running.Configure
spark:spark.history.fs.gs.outputstream.sync.min.interval.msto control the frequency at which the job cluster transfers data to GCS.To enable the executor logs in PHS, specify the custom Spark executor log URL for supporting external log service. Configure the following properties:
Lifecycle Management of Logs
Using GCS Object Lifecycle Management, configure a 30d lifecycle policy to periodically clean up the MapReduce job history logs and Spark event logs from the GCS bucket. This will improve the performance of the PHS UI considerably.
Note: Before doing the cleanup, you can back up the logs to a separate GCS bucket for long-term storage. |
PHS Setup Sample Codes
The following code block creates a Persistent History server with the best practices suggested above.
The following code block creates an ephemeral cluster that logs events to the GCS bucket.
With the Persistent History server, you can monitor and analyze all completed applications. You will also be able to use the logs and metrics to optimize performance and to troubleshoot issues related to strangled tasks, scheduler delays, and out of memory errors.