How Wayfair says yes with BigQuery—without breaking the bank

Emily Pearson
Associate Director, Data Access and Visualization Platforms, Wayfair
Ethan Dickinson
Director, Analytics Infrastructure, Wayfair
Editor’s note: Home-goods and furniture giant Wayfair first partnered up with Google Cloud to transform and scale its storefront—work that proved its value many times over during the unprecedented surge in ecommerce traffic during 2020. Today, we hear how BigQuery’s performance and cost optimization have transformed the company’s internal analytics to create an environment of "yes".
At Wayfair, we have several unique challenges relating to the scale of our product catalog, our global delivery network, and our position in a multi-sided marketplace that supports both our customers and suppliers. To give you a sense of our scale we have a team of more than 3,000 engineers with tens of millions of customers. We supply more than 20 Million items using more than 16,000 supplier partners.
Serving those constituents generates a lot of analytics work. Wayfair runs over a billion 'analytic' database queries a year, from both humans and systems, against multi-petabyte datasets. Scaling our previous environment to meet these challenges required us to maintain dozens of copies of data for different use cases and manage complex data synchronization routines to move trillions of records each day, resulting in long development times and high support costs for our analytics projects.
Centralizing our data using Cloud Storage and BigQuery enabled us to break down existing silos and build unified pipelines for our batch and real-time operations. BigQuery shines by letting us decouple our compute and storage resources and flexibly ingest structured data in streaming and batch modes. We also benefit from the same decoupling for more complicated machine learning (ML) workflows in Dataproc and Cloud Storage. In particular, BigQuery is extremely low maintenance. From ML and easy data integrations to the integrated query cache, many out-of-the-box features have proven valuable for multiple use cases.
Beyond storage and compute, Google Cloud offers multiple tools to maximize the value of our data. For example, we can easily connect Data Studio to BigQuery for lightning-fast dashboarding of enterprise KPI reporting. When we need to dive deeper into a metric, Looker provides an interface and semantic model that empowers more business users to answer important questions — without understanding SQL or our vast dataset and table structure.
The combination of all of Google Cloud’s tools enables every Wayfairian the opportunity to self-serve their data visualization and analysis needs. We are able to support all of the requirements of our internal and external users, from descriptive analytics to alerting and ML, in a platform that blends Google’s proprietary technology with open-source standards.
we have seen a greater than 90% reduction in the number of analytic queries in production that take more than one minute to run
As a result, we have seen a greater than 90% reduction in the number of analytic queries in production that take more than one minute to run, which delights our users and increases adoption of our analytics tools across the business.
Higher performance means saying “Yes” more often
We went into the BigQuery experience expecting very strong performance on large, aggregate queries and excellent scalability — the kind of performance that could enable consistent 5-15 minute processing queries and 5-10 second response times for large analytics queries.
We weren’t disappointed — we saw slightly better than linear performance profiles as record counts went up from millions to trillions for a flat resource allocation. BigQuery had the expected high performance for aggregate queries. This made our large data processing pipelines predictable and straightforward to maintain and optimize.
Below is a plot of gigabytes processed by a query against query run time in seconds; outliers are filtered and the axes are pruned to ranges where we had a large sample size. This focuses on longer-duration queries. As an example of the linear performance, a 2 terabyte query averages 5 minutes — 2.5min/terabyte — and an 18 terabyte query (9 times as much data) averages 25s — only 1.4min/terabyte. This is despite the fact that complex queries [sorting and analytic functions are particularly problematic] are more common with large data sizes. We do see increasing variability at large sizes as slot limits and other resource constraints come into play, but these factors are controllable and ultimately a business optimization decision.
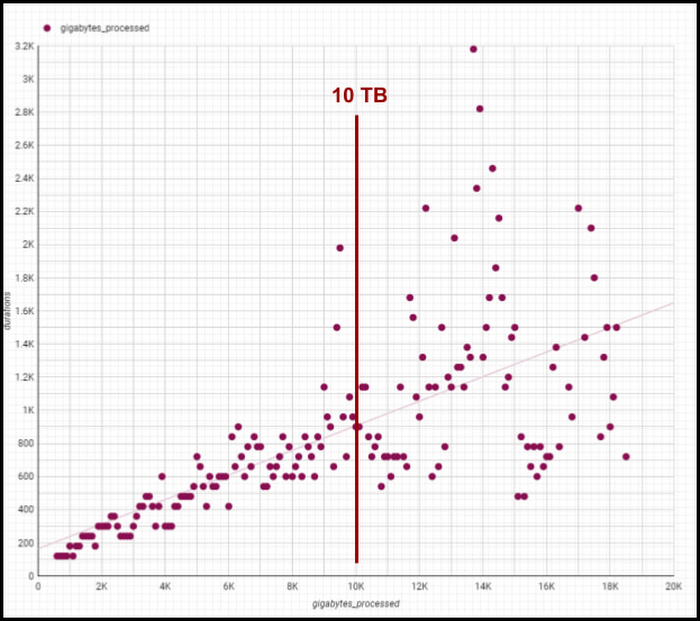
Though individual values vary greatly depending on query complexity [analytic functions/sorting can be computationally expensive], the overall trend line is below 1-1 for bytes versus duration, meaning our BigQuery query runtimes are increasing slower than our data volumes. We are still seeing sub 1:1 threshold runtimes, and we’re already at 100 PB of total data with single queries running on 50PB or more. Going strong!
One unexpected and pleasant surprise has been high performance for smaller queries, such as those required for development, interactive analytics, and internal applications we use for forecasting, segmentation, and other latency-sensitive data workflows. BigQuery’s resource management systems have provided smoother degradation and parallelism profiles than we initially expected for a multi-tenant platform.
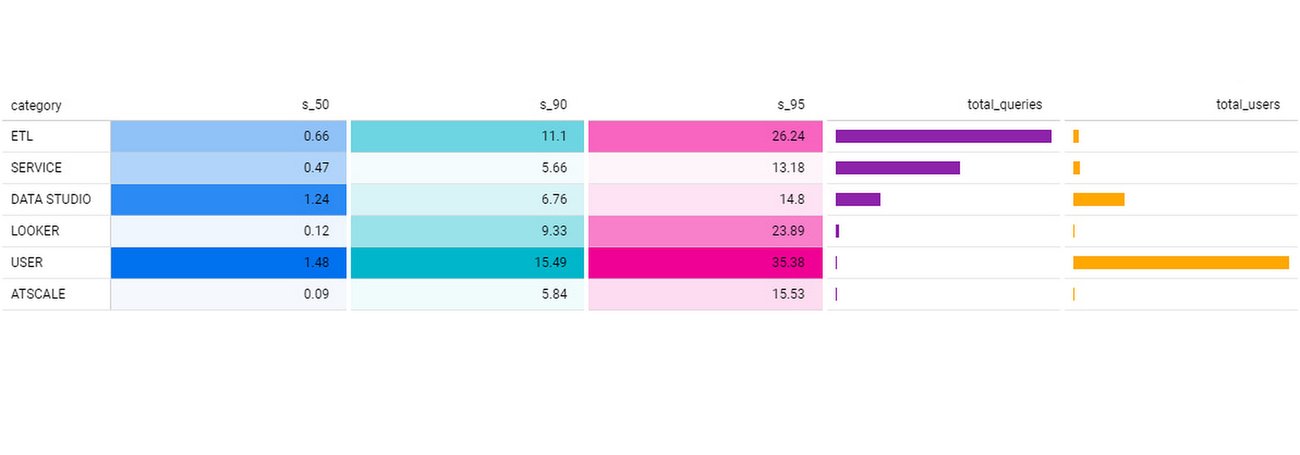
We regularly see sub-second p50 query performance for interactive use cases, with p90 performance coming in under 10 seconds for Looker, Data Studio, and AtScale — meeting the threshold we set to avoid analysts losing focus during a business investigation. The chart below shows p50, p90, and p95 timing for core workloads, as well as the number of queries in each bucket and the number of unique users. [Looker and Atscale will use small numbers of service accounts for a large number of users].
This has enabled two important shifts in the way our customers experience analytics services:
Delivering better user productivity. People no longer have long wait times to get results for a basic query delivering an improved overall user experience.
Scaling our data transformation. BigQuery has proven, effective data transformation that allows us to embrace the industry shift away towards ELT (extract, load, transform) to transform raw data right within the database.
We no longer have to ask ourselves, "Can we meet the SLA for this data processing task?" The new conversation is, "Of course, we can meet it. What’s the associated cost based on how many resources we assign?" We can make cost and resource trade-offs clear to our users and say "yes" more often to requirements that have measurable business value.
Supporting cost vs. performance decisions
Democratized access to internal analytics is a powerful decision-making tool. With BigQuery’s robust tooling, the decision about how to best allocate computational resources is in the hands of the analytics groups closest to the business decision being made. If they want to spend a sprint optimizing a dashboard, they can show exactly how much money it will save. If they choose not to optimize a report, they can offset the decision with concrete cost savings and other realized value.
Wayfair teams also benefit from visibility into their committed costs by abstracting away the details of the underlying services, including BigQuery slots, the virtual CPUs used to execute SQL queries.
Take a look at this example view consumed by our teams (the metrics for these dashboards are from the BigQuery INFORMATION_SCHEMA (jobs and reservations tables):
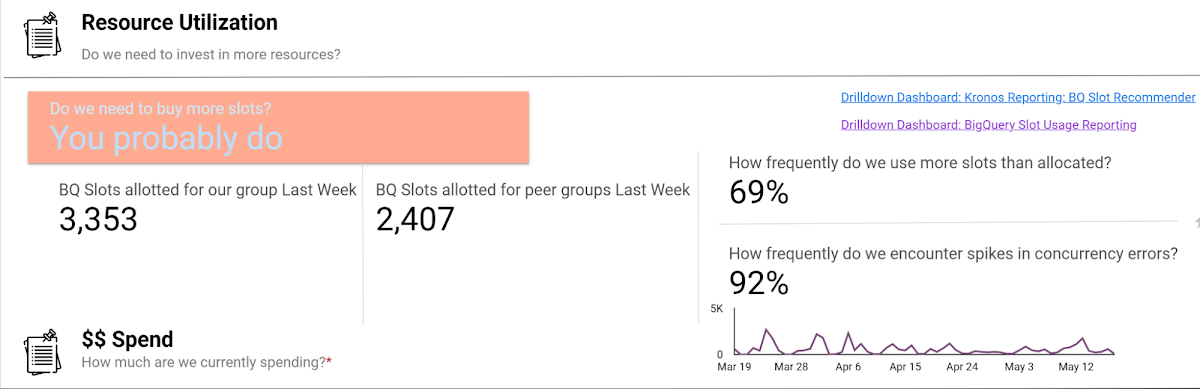
Suppose an organization wants to purchase capacity for a period of time. In that case, we provide an average cost for a slot during that time and charge them based on their slot usage for queries, multiplied by the average price.
Teams can see whether their consumption matches their reservations with a consistent, high-level number. We apply the same approach to tools like Dataproc by aggregating up the costs of component services and providing an organizational cost for those services.
How we use performance signals to improve user efficiency
Instead of overcorrecting for occasional performance fluctuations by allocating excessive resources, we try to align incentives so that people make the right choices for the business. Showback doesn’t work in a vacuum — it requires context and integrated insights. Teams need to show the cost of running a dashboard as well as the ROI is in terms of end user engagement and what peer dashboards with equivalent source datasets might cost.
We want to give users the freedom to do things the way they want and need to while also educating them on achieving their goals and using best practices to reduce their costs and improve their performance. The goal is never for all dashboards to load "less than x seconds" — we believe that any dashboard can load in x seconds when it is properly designed and resourced.
For instance, BigQuery allocates slots for a new workload quickly and efficiently, and queries that are optimized and have dedicated resources consistently complete quickly. When users experience a slowdown, it’s typically because they are sharing resources or inefficiently using their resources. Variable performance is a useful signal to help users discover opportunities to optimize queries and work more productively. We value these signals as we like to focus on the aggregate experience of all users interacting with the tool, not individual interaction.
A natural way to improve user efficiency is to reward ideal behaviors and discourage those that do not align with our analytics strategy. Some examples include splitting out high-demand reporting from ad-hoc exploration to reduce concurrency errors or encouraging people to use materialized tables instead of writing complex custom SQL. For instance, a dedicated reporting project might only include an organization’s Data Studio dashboard if it directly references a table or meets other optimization requirements. Using this approach, we give our users a high degree of freedom and experimentation at the entry-level while providing a well-documented path to scale.
Visibility into query performance improves business performance
The detailed tracking information we get from Google Cloud products is critical — Google’s robust analytics performance has enabled us to scale Data Studio to over 15,000 Wayfarians. Of course, a larger user base always comes with concerns that less sophisticated users may not appropriately optimize their queries or make the best use of the infrastructure.
Evaluating the different Data Studio dashboards helps us identify opportunities to use better query optimization practices, such as reducing custom queries, connecting directly to permanent tables, or using the BI Engine to improve dashboard performance. Recently, our team built new billing projects specific for Data Studio reporting. We can scale up a reservation dedicated to reporting about a major sales event in minutes.
Beyond everyday reporting, holidays and sales events may require higher, guaranteed performance. BigQuery’s flexible capacity commitments allow us to decide at a business level whether an urgent need requires us to reprioritize resources immediately or whether we have the time to optimize queries and rebuild dashboards to be performant. These new billing projects let us evaluate if teams need to scale up resourcing, what areas they can optimize in BigQuery, or if a new reservation is needed to resource that team separately.
Recommendations for achieving high performance at low cost
Are you wondering how to allocate BigQuery slots? Teams must see direct, immediate return on their investment in performance and optimization.
Our first rule of thumb is to align resource utilization with ownership as closely as possible. This makes it easier for teams to secure dedicated resources, even if they start out small. We’re comfortable doing this because BigQuery dynamically reassigns capacity between the targeted reservation and other consumers in milliseconds. We always get the total usage of our slots — there is no wasted capacity even when we break assignments down granularly.
Once a team has a reservation, we provide reporting that consumes various BigQuery information schema views, such as query logs and reservation information, and processes it into aggregated reporting. We look for metrics like the average slots available to a query at a point in time, overall query performance, and how long queries took to execute to pinpoint the overall health of a reservation against our business objectives. Flex slots also let us experiment easily with additional capacity, and BigQuery’s performance is so consistent that we can use straightforward models to estimate return on additional slot investment.
Other key cost optimization tips we have found helpful at Wayfair include:
Optimize for worst-case performance. Given BigQuery’s ability to share slots, we expect teams will often see much better performance, but we find that thinking it’s more effective when teams think about the most pessimistic case when resourcing their jobs.
Take advantage of BI Engine reservations. We like to think critically about the data and workload. BI Engine reservations are excellent for workloads that query lots of small dimension tables or a few larger tables loaded into memory. In cases like that, such as with OLAP tools using pre-computed aggregates, we’ve seen BI engine investments drive a 25% reduction in average query time—excellent ROI.
Leverage Looker for large, longitudinal datasets. Since Looker supports a wide range of use cases, we see a broader range of performance — p50 is still under a second, but p95 can get as high as a minute. For these cases, we recommend modeling user patterns [first of month, first day of week] and dynamically allocating more slots for these periods while deprioritizing batch workloads in the key windows.
Lean in heavily on the BQ cache for broad-based reporting. To avoid a Monday morning reporting lag, We use the BigQuery cache to avoid Monday morning report loading lags. Up to 30% of our Data Studio queries hit the BQ cache, ensuring our Data Studio p95 consistently stays under 10 seconds.
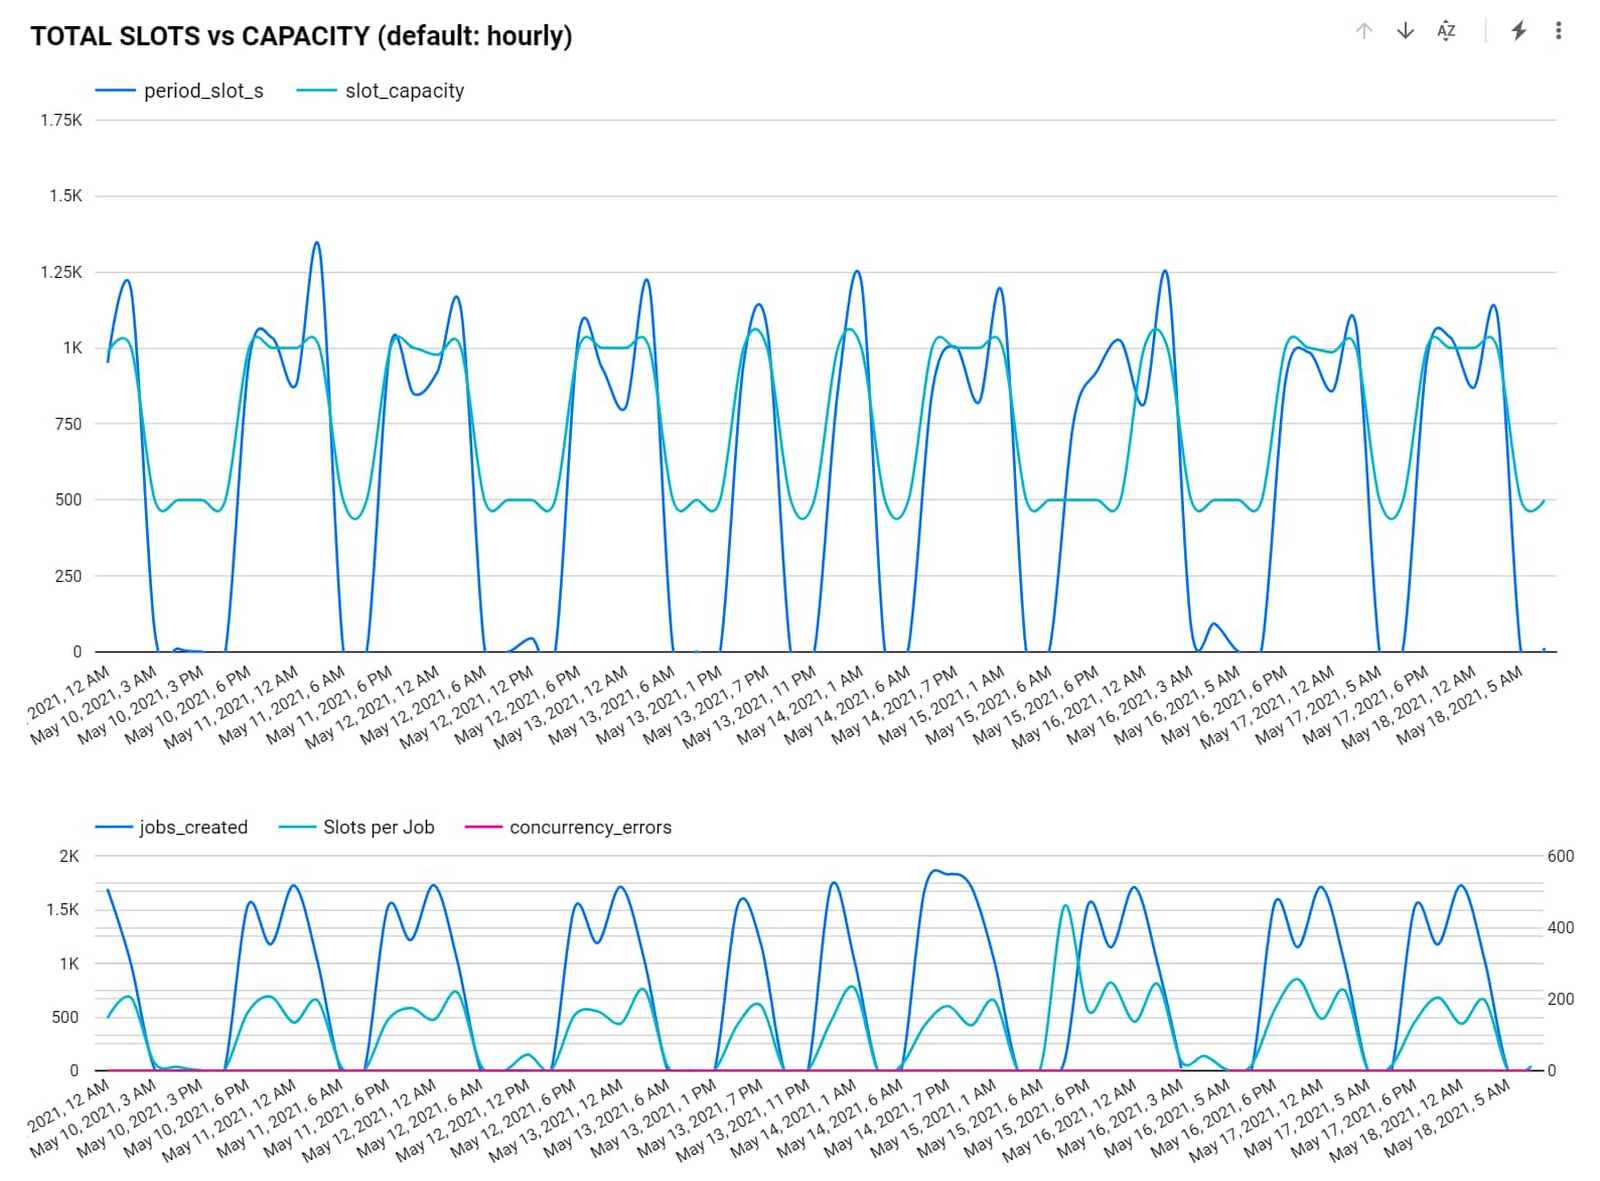
Use slots-per-job to improve experience. In our reporting, we find that the most valuable view is slots-per-job. We look for dips in slots available for jobs as this situation often correlates strongly with poor user experiences. For example, our reporting showed us that Looker has the highest volumes of queries and users on Mondays and during each month’s first two business days. We used this information to scale up slots to support these periods of highest demand, delivering on performance SLAs to support business users.
Get a global picture of usage. We manage slots in a central tool. Teams input their requirements into a calendar to indicate when they want higher or lower capacity to inform our flex slot purchases and annual commitments. It might seem like dozens of relatively inconsistent workloads at the team level, but the picture changes when you look at demand across a week (or our entire business). Understanding global usage makes it easy for us to model baseline capacity recommendations for serving year slots versus flexible demands.
Reaping the rewards of BigQuery
From our first initial undertaking with Google Cloud to transform our storefront, we had a lot of confidence in the underlying technology offerings and the teams that ran them and their ability to meet our unique requirements. But our experience using BigQuery for internal analytics at Wayfair has exceeded our already high expectations.
BigQuery’s fast, dynamic allocation of resources and ability to transform data in place are important to our mission of maintaining consistently high performance for our users while closely managing costs. Moreover, our visibility into query and dashboard performance through BigQuery’s DSP views and other performance metrics have helped us make clearer connections between performance goals and the costs required to meet them — and guide our analysts across the company towards attaining high performance on every project.