What's new with BigQuery ML: Unsupervised anomaly detection for time series and non-time series data
Polong Lin
Developer Advocate
Jiashang Liu
Software Engineer, BigQuery ML
When it comes to anomaly detection, one of the key challenges that many organizations face is that it can be difficult to know how to define what an anomaly is. How do you define and anticipate unusual network intrusions, manufacturing defects, or insurance fraud? If you have labeled data with known anomalies, then you can choose from a variety of supervised machine learning model types that are already supported in BigQuery ML. But what can you do if you don't know what kind of anomaly to expect, and you don't have labeled data? Unlike typical predictive techniques that leverage supervised learning, organizations may need to be able to detect anomalies in the absence of labeled data.
Today we are announcing the public preview of new anomaly detection capabilities in BigQuery ML that leverage unsupervised machine learning to help you detect anomalies without needing labeled data. Depending on whether or not the training data is time series, users can now detect anomalies in training data or on new input data using a new ML.DETECT_ANOMALIES function (documentation), with the following models:
Autoencoder model, now in Public Preview (documentation)
K-means model, already GA (documentation)
ARIMA_PLUS time series model, already GA (documentation)
How does anomaly detection with ML.DETECT_ANOMALIES work?
To detect anomalies in non-time-series data, you can use:
K-means clustering models: When you use
ML.DETECT_ANOMALIESwith a k-means model, anomalies are identified based on the value of each input data point's normalized distance to its nearest cluster. If that distance exceeds a threshold determined by the contamination value provided by the user, the data point is identified as an anomaly.Autoencoder models: When you use
ML.DETECT_ANOMALIESwith an autoencoder model, anomalies are identified based on the reconstruction error for each data point. If the error exceeds a threshold determined by the contamination value, it is identified as an anomaly.
To detect anomalies in time-series data, you can use:
ARIMA_PLUS time series models: When you use
ML.DETECT_ANOMALIESwith an ARIMA_PLUS model, anomalies are identified based on the confidence interval for that timestamp. If the probability that the data point at that timestamp occurs outside of the prediction interval exceeds a probability threshold provided by the user, the datapoint is identified as an anomaly.
Below we show code examples of anomaly detection in BigQuery ML for each of the above scenarios.
Anomaly detection with a k-means clustering model
You can now detect anomalies using k-means clustering models, by running ML.DETECT_ANOMALIES to detect anomalies in the training data or in new input data. Begin by creating a k-means clustering model:
With the k-means clustering model trained, you can now run ML.DETECT_ANOMALIES to detect anomalies in the training data or in new input data.
To detect anomalies in the training data, use
ML.DETECT_ANOMALIES with the same data used during training: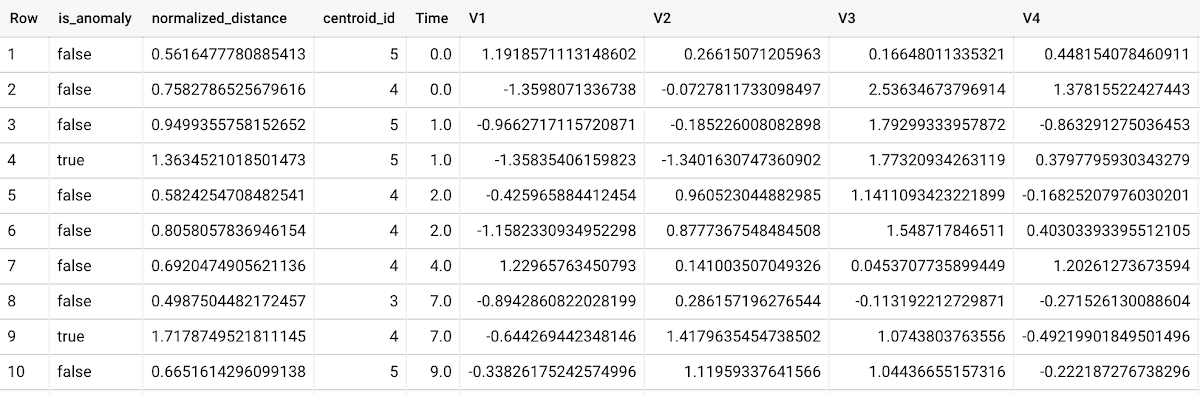
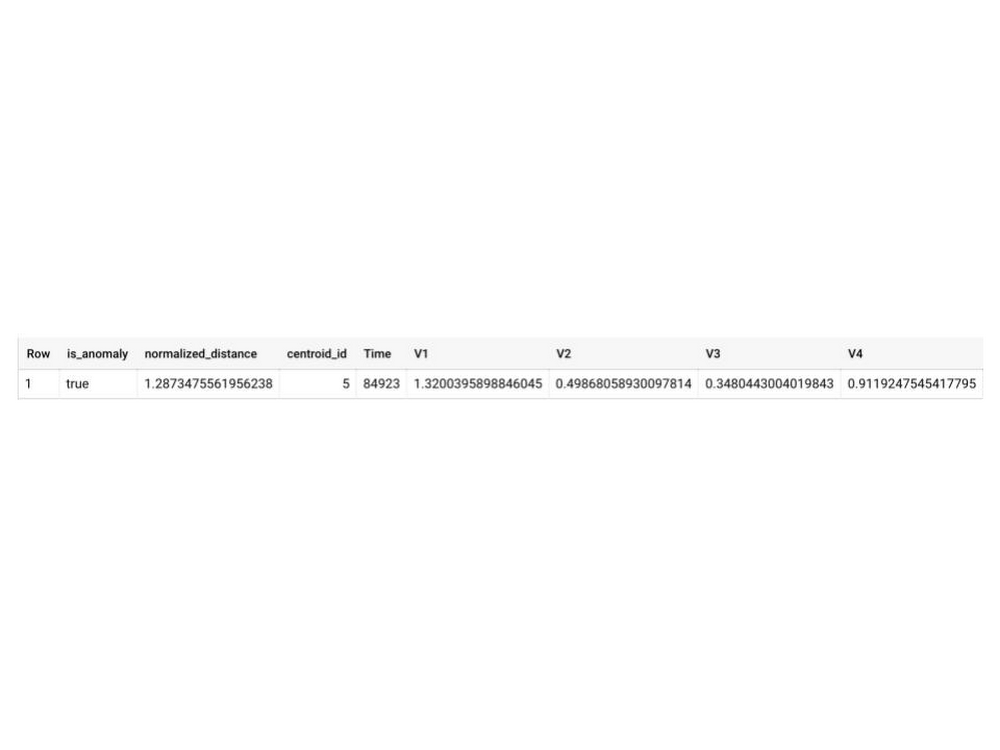
To detect anomalies in new data, use ML.DETECT_ANOMALIES and provide new data as input:
How does anomaly detection work for k-means clustering models?
Anomalies are identified based on the value of each input data point's normalized distance to its nearest cluster, which, if exceeds a threshold determined by the contamination value, is identified as an anomaly. How does this work exactly? With a k-means model and data as inputs, ML.DETECT_ANOMALIES first computes the absolute distance for each input data point to all cluster centroids in the model, then normalizes each distance by the respective cluster radius (which is defined as the standard deviation of the absolute distances of all points in this cluster to the centroid). For each data point, ML.DETECT_ANOMALIES returns the nearest centroid_id based on normalized_distance, as seen in the screenshot above. The contamination value, specified by the user, determines the threshold of whether a data point is considered an anomaly. For example, a contamination value of 0.1 means that the top 10% of descending normalized distance from the training data will be used as the cut-off threshold. If the normalized distance for a datapoint exceeds the threshold, then it is identified as an anomaly. Setting an appropriate contamination will be highly dependent on the requirements of the user or business.
For more information on anomaly detection with k-means clustering, please see the documentation here.
Anomaly detection with an autoencoder model
You can now detect anomalies using autoencoder models, by running ML.DETECT_ANOMALIES to detect anomalies in the training data or in new input data.
Begin by creating an autoencoder model:
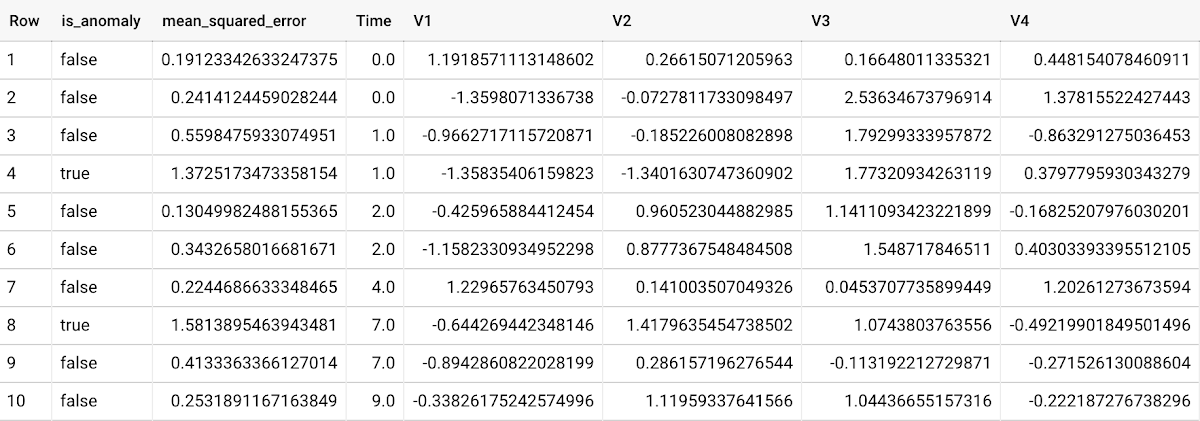
To detect anomalies in the training data, use ML.DETECT_ANOMALIES with the same data used during training:
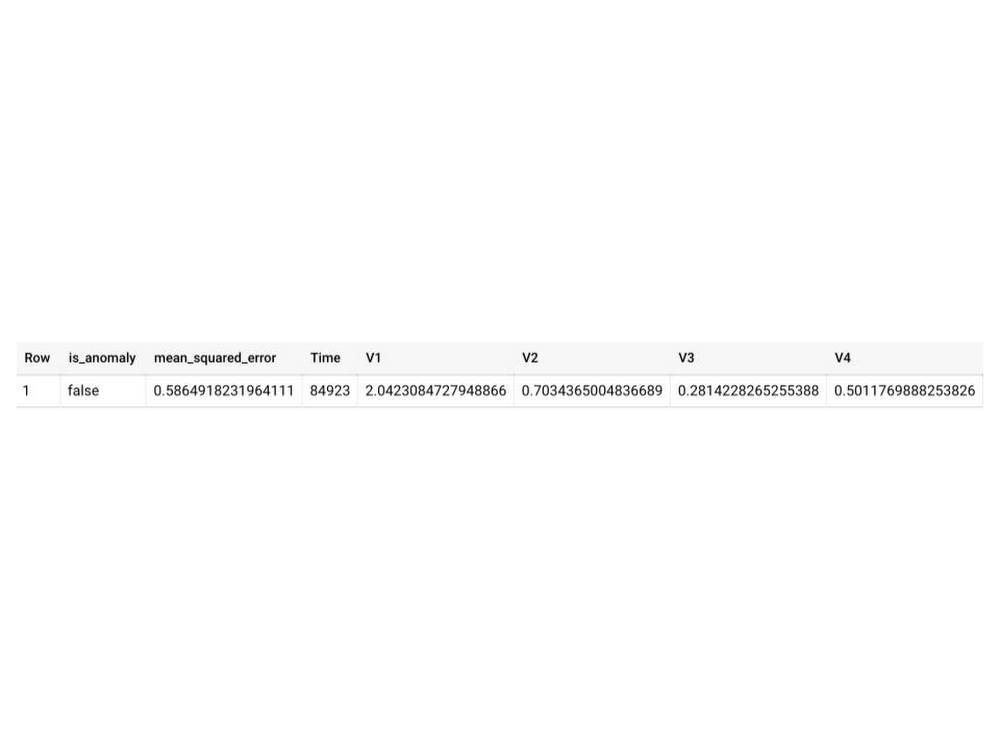
To detect anomalies in new data, use ML.DETECT_ANOMALIES and provide new data as input:
How does anomaly detection work for autoencoder models?
Anomalies are identified based on the value of each input data point's reconstructed error, which, if exceeds a threshold determined by the contamination value, is identified as an anomaly. How does this work exactly? With an autoencoder model and data as inputs, ML.DETECT_ANOMALIES first computes the mean_squared_error for each data point between its original values and its reconstructed values. The contamination value, specified by the user, determines the threshold of whether a data point is considered an anomaly. For example, a contamination value of 0.1 means that the top 10% of descending error from the training data will be used as the cut-off threshold. Setting an appropriate contamination will be highly dependent on the requirements of the user or business.
For more information on anomaly detection with autoencoder models, please see the documentation here.
Anomaly detection with an ARIMA_PLUS time-series model
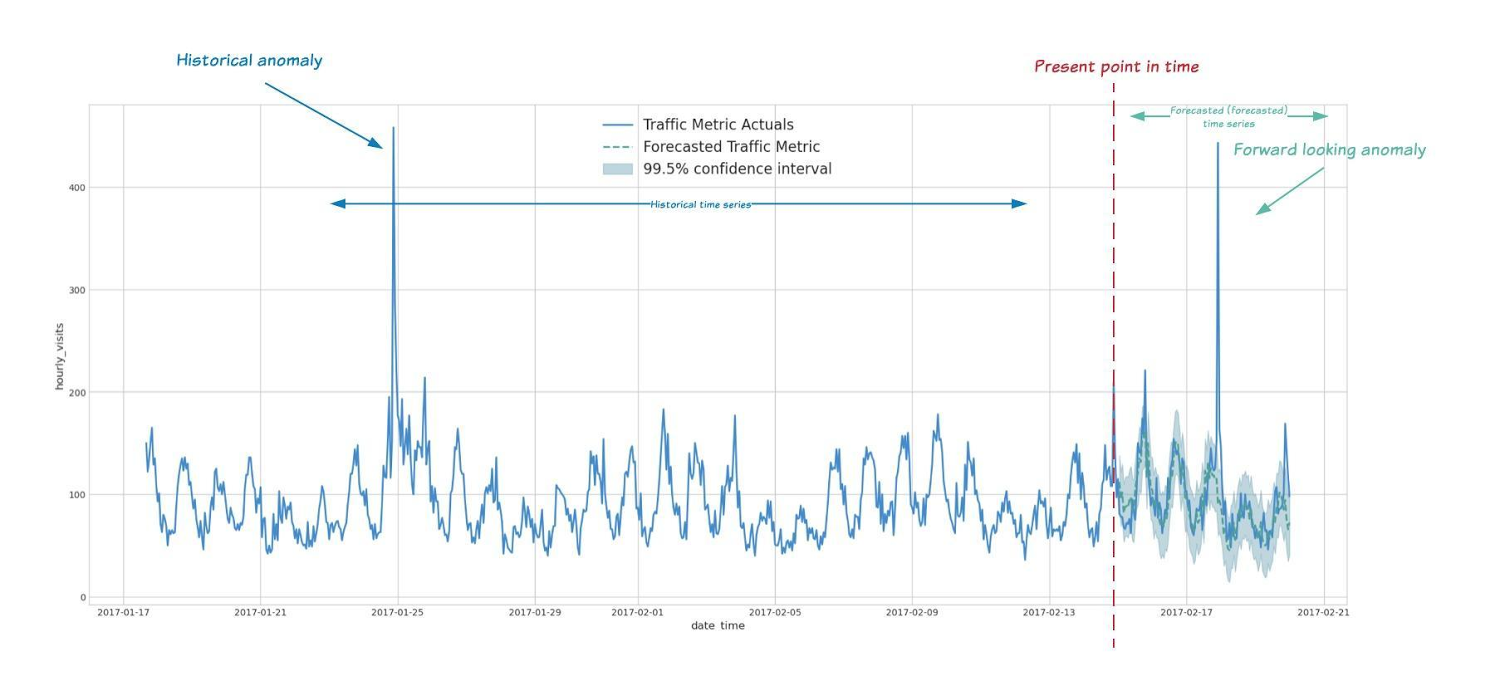
With ML.DETECT_ANOMALIES, you can now detect anomalies using ARIMA_PLUS time series models in the (historical) training data or in new input data. Here are some examples of when might you want to detect anomalies with time-series data:
Detecting anomalies in historical data:
Cleaning up data for forecasting and modeling purposes, e.g. preprocessing historical time series before using them to train an ML model.
When you have a large number of retail demand time series (thousands of products across hundreds of stores or zip codes), you may want to quickly identify which stores and product categories had anomalous sales patterns, and then perform a deeper analysis of why that was the case.
Forward looking anomaly detection:
Detecting consumer behavior and pricing anomalies as early as possible: e.g. if traffic to a specific product page suddenly and unexpectedly spikes, it might be because of an error in the pricing process that leads to an unusually low price.
When you have a large number of retail demand time series (thousands of products across hundreds of stores or zip codes), you would like to identify which stores and product categories had anomalous sales patterns based on your forecasts, so you can quickly respond to any unexpected spikes or dips.
How do you detect anomalies using ARIMA_PLUS? Begin by creating an ARIMA_PLUS time series model:
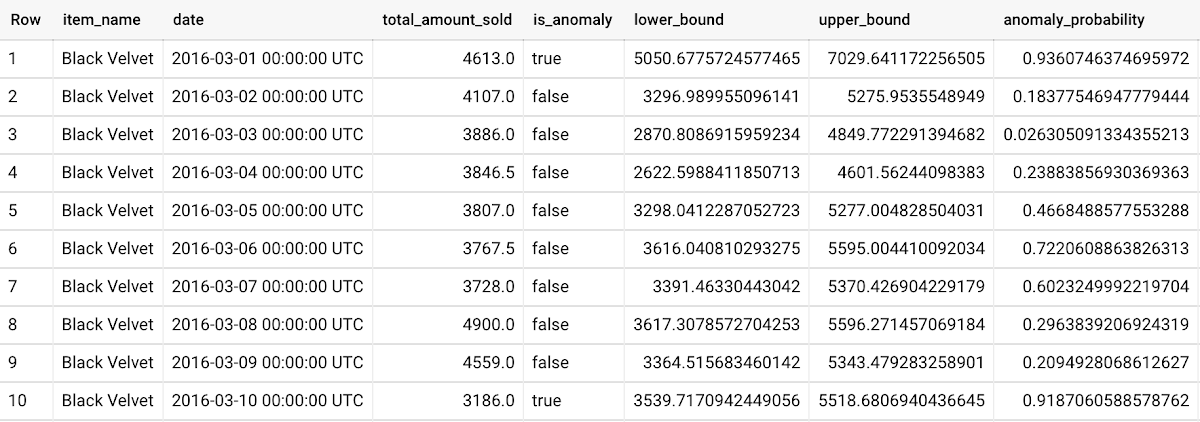
To detect anomalies in the training data, use ML.DETECT_ANOMALIES with the model obtained above:
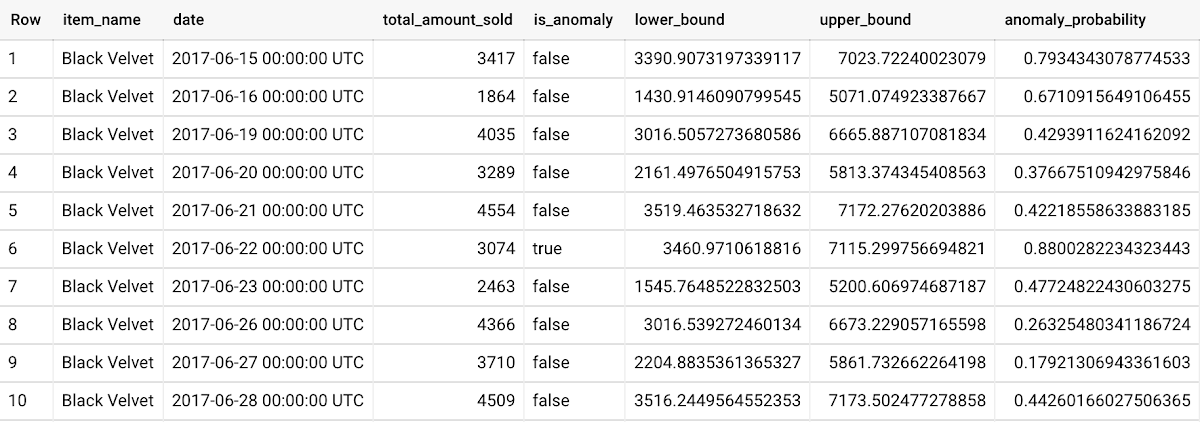
To detect anomalies in new data, use ML.DETECT_ANOMALIES and provide new data as input:
For more information on anomaly detection with ARIMA_PLUS time series models, please see the documentation here.
Thanks to the BigQuery ML team, especially Abhinav Khushraj, Abhishek Kashyap, Amir Hormati, Jerry Ye, Xi Cheng, Skander Hannachi, Steve Walker, and Stephanie Wang.
