Monitoring your Compute Engine footprint with Cloud Functions and Stackdriver
Charles Baer
Product Manager, Google Cloud
Compute Engine instances running on Google Cloud Platform (GCP) can scale up and down quickly as needed by your business. As your fleet of instances grows, you’ll want to ensure that you have enough Compute Engine quota for growth over time and that you understand your resource usage and costs. At scale, gaining a single view across projects and products requires comprehensive monitoring, and you’ll want to be able to track and manage all your cloud resources.
It’s also worth keeping in mind that several of our GCP managed services, such as Cloud Dataflow, Cloud Dataproc, Google Kubernetes Engine, and managed instance groups, all provide autoscaling. That means they scale Compute Engine instances up or down based on the processing load and therefore aren’t static in number. As the number of your GCP projects grows, identifying the current instance count and tracking the count over time gets harder. In this post, we’ll show you how to set up custom monitoring metrics in Stackdriver so you can have a continual view into your instances at any given time.
Compute Engine instances automatically report many different metrics to Stackdriver Monitoring, GCP’s integrated monitoring solution, including instance uptime, CPU utilization and memory utilization. Stackdriver Monitoring also provides an agent that provides more detailed CPU, memory and disk metrics. You can use these metrics to indirectly calculate an accurate number of your virtual machines. For example, you could calculate the number of running instances by counting the uptime metric, as shown here:
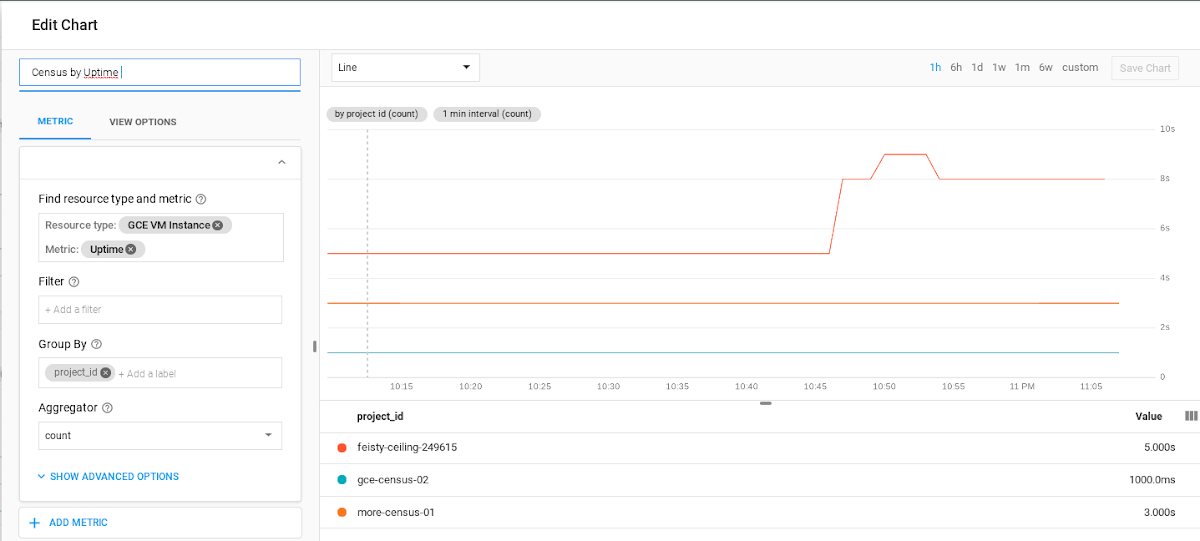

This approach, while easy to implement, has several parameters to keep in mind. For example, this approach requires that all the projects are within the same Stackdriver Workspace and it only captures instances that are in a RUNNING state (not TERMINATED). If these requirements don’t apply to your GCP environment, then you can easily build a dashboard using an existing metric.
However, if you need to implement the counting approach, Stackdriver Monitoring provides a way to record the instance count via custom monitoring metrics. Custom monitoring metrics are metrics that you write and use like any other metric in Stackdriver, including for alerting and dashboards. Let’s take a look at how you can use these custom metrics to monitor the total number of Compute Engine instances in your GCP environment.
Getting and reporting instance metrics
There are three steps to find the current number of Compute Engine instances in your environment and then write this number as a custom monitoring metric to Stackdriver Monitoring:
Get a list of the VMs for all your projects. First, use the projects.list method in the Cloud Resource Manager API to get a list of projects to include. Once you have the list, use the instances.list method in the Compute Engine API to get a list of all the VMs in each project.
Write the list of VMs to Stackdriver Monitoring as a custom metric. You can also use custom labels.
Build a dashboard in Stackdriver Monitoring. You can build a dashboard with the custom metrics and group by your custom labels.
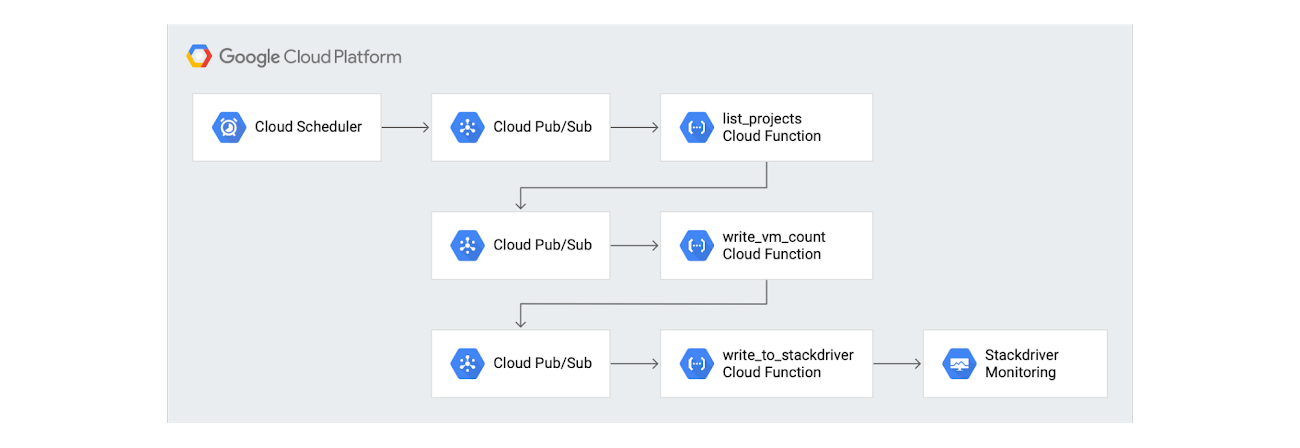
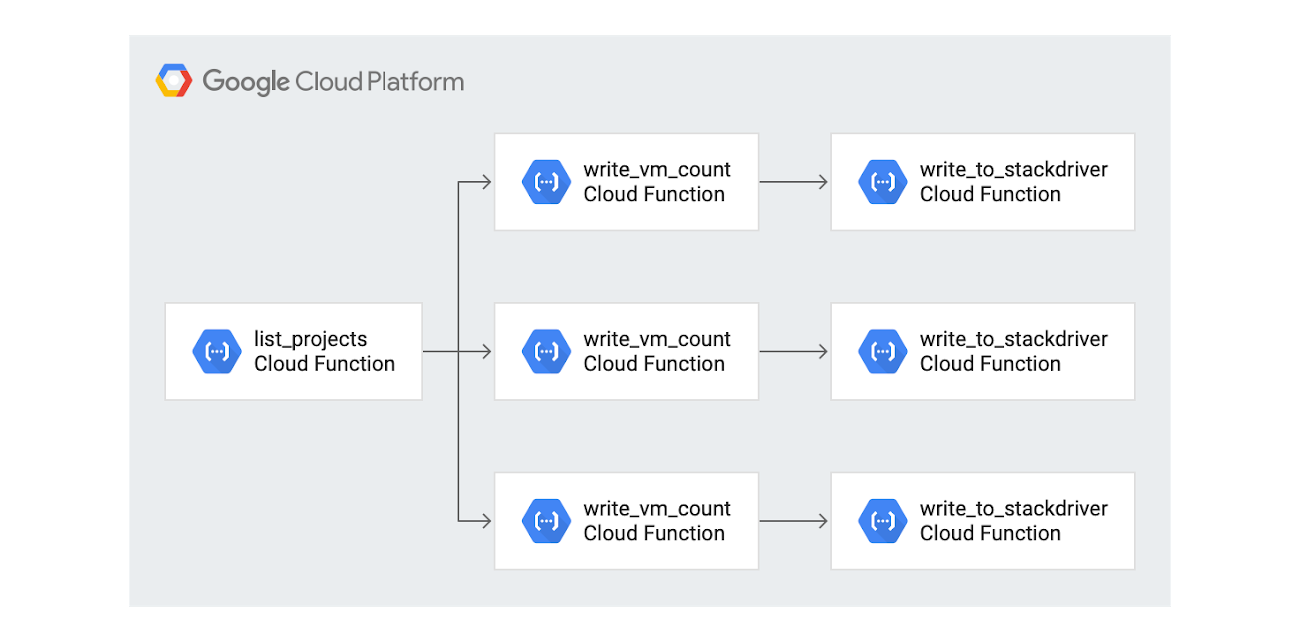
Here’s what this looks like in practice. The following reference architecture describes a serverless, event-based architecture to get a list of Compute Engine instances for all projects within an organization and then write those metrics to Stackdriver Monitoring.

Cloud Scheduler
Using a custom monitoring metric means that you need to regularly write metric values to Stackdriver Monitoring. Using Cloud Scheduler, you can initiate the process of gathering the compute instance count and writing the custom monitoring metric every 10 minutes. Cloud Scheduler sends a Cloud Pub/Sub message, which then triggers the first Cloud Function to gather a list of projects.
Cloud Functions
Cloud Functions is a good option as an orchestrator because it’s serverless, well-integrated into the GCP platform and scales up and down as required by the load. Cloud Functions enable an event-driven, asynchronous design pattern, which helps to both scale over time and decouple the functionality across different Cloud Functions. To make it even easier, you can use the NodeJS client libraries for Cloud Resource Manager, Compute Engine, Cloud Pub/Sub and Stackdriver Monitoring. Using the client libraries allows you to work directly with native objects rather than the details of the API calls.
The reference architecture divides the processing into three Cloud Functions:
list_projects—Triggered by the Cloud Scheduler. Gathers a list of all projects using the projects.list method on the Cloud Resource Manager API and writes each of the project IDs to a separate Cloud Pub/Sub. This means that the write_vm_count function will be executed once for each project.
write_vm_count—Triggered by the each Cloud Pub/Sub message with a separate project ID. Uses the instances.list method in the Compute Engine API to get a list of all the VMs in each project. Write the results as another Cloud Pub/Sub message to trigger the write_to_stackdriver function.
write_to_stackdriver—Triggered by each Cloud Pub/Sub message from write_vm_count with the compute instance count. Writes a custom monitoring metric to Stackdriver Monitoring.
The diagram below captures the logical fanout in the architecture, which allows the work of gathering and reporting the instance count to happen in parallel and asynchronously. Cloud Functions and Cloud Pub/Sub make it easy to implement an asynchronous, event-driven architecture. For example, if there are three projects found in the list_projects function, then three Cloud Pub/Sub messages are sent and the write_vm_count is executed three times. The write_to_stackdriver function is also executed three times.

Stackdriver Monitoring
Stackdriver Monitoring collects metrics, events, and metadata from GCP and generates insights via dashboards, charts, and alerts. In order to store custom monitoring metrics, set up a Stackdriver Monitoring Workspace. You can create the Workspace inside the same project as the Cloud Functions, though you could also use a separate project. Workspaces provide a container for one or more GCP metrics (included with your deployment) and provide access to the Stackdriver Monitoring user interface, including the dashboards for rich visualizations. Once you begin reporting the custom monitoring metric, you can build a dashboard to track the value over time, filtering and grouping the chart by the labels on the metric.
Stackdriver Monitoring metrics
When you write the custom monitoring metrics, you must select a metric name and also supply any labels associated with your metric. These labels are used for aggregation and require thoughtful design. For an excellent explanation of the details of Stackdriver Monitoring metrics, check out Stackdriver tips and tricks: Understanding metrics and building charts.
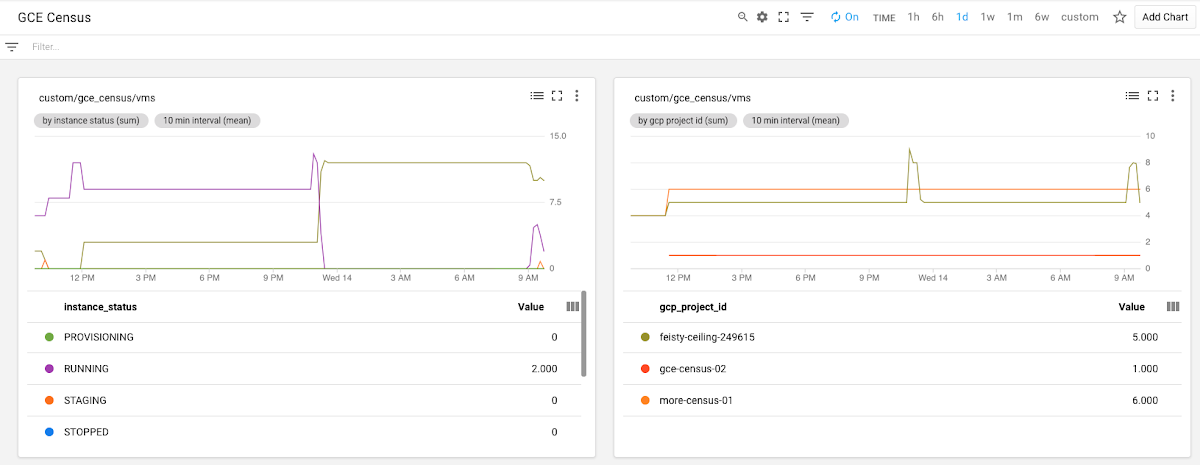
Two clear choices for labels include the gcp_project_id and Compute Engine instance instance_status labels. These labels let you group and filter the metric values by projects and by instance status. For example, if you have 55 instances across 10 projects, you could view the instance count by project to monitor how many instances are allocated in each project. You could also group by the instance status to view the instance count by status across all projects. Or, you could combine the two labels to see the number of instances by status in each project. Using labels gives you the flexibility to group the results in a way that you want.
Cloud IAM permissions
Cloud Functions supplies a default runtime Service Account that is assigned editor permissions. You can either use the default service account or create specific service accounts for each Cloud Function. Using a specific service account lets you implement the least set of privilege required for your Cloud Functions.
There are several different permissions required to list the projects and then write the custom monitoring metric.
Compute Viewer—This Cloud Identity and Access Management (IAM) permission can be granted at the organization level for the service account that your Cloud Function uses so that the projects.list method in the Cloud Resource Manager API returns all the projects in the organization. This is also required for use of of the instances.list method the Compute Engine API. If these permissions aren’t added, you will only get projects and instances to which your service account has access to list. Any missing permissions will generate errors.
Cloud Pub/Sub Publisher—This Cloud IAM permission is required in the project in which you host the Cloud Function for the service account that your Cloud Function uses. This permission enables the list_projects and write_vm_count functions to publish their messages to a Cloud Pub/Sub topic.
Monitoring Metric Writer—This Cloud IAM permission is required in the project in which you write the Stackdriver Monitoring metric for the service account that your Cloud Function uses. This permission enables the write_to_stackdriver function to publish metrics.
Sample Stackdriver custom metric dashboard
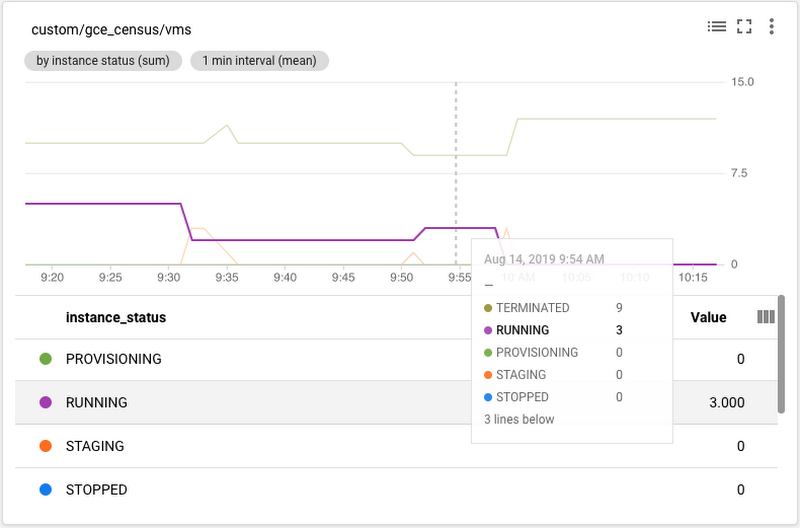
Stackdriver Monitoring dashboards can contain many charts. Writing the labels gcp_project_id and Compute Engine instance_status means that you can filter and group by both of those metrics. As an example, you can create a chart graphing the count of instances over time grouped by the label instance_status, as shown here:

You can also create a chart graphing the count of instances over time, grouped by the label gcp_project_id, like this:

Sample custom metrics alerts
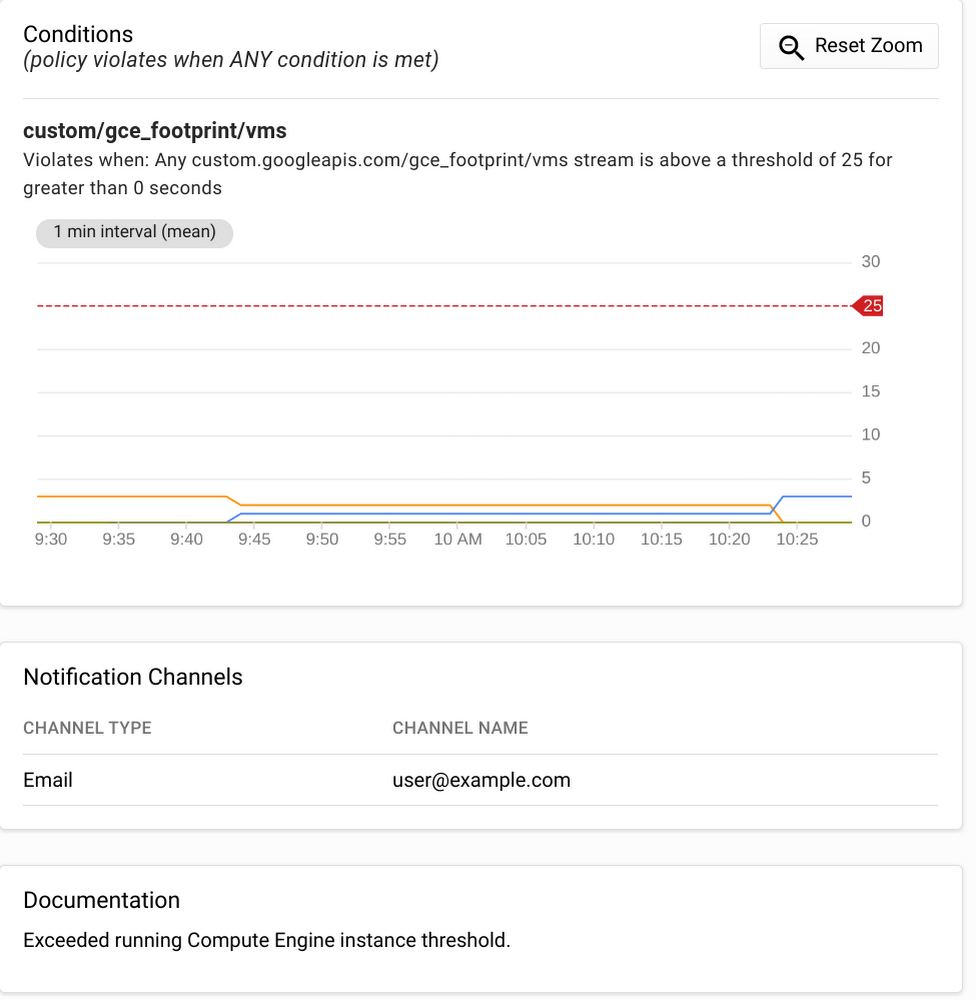
Once you have a metric in Stackdriver Monitoring, you can also use it for alerting purposes. For example, you could set up an alert to generate an email (like below) or SMS to notify you when you total running instance count exceeds a certain threshold (25, in the example below).

Monitoring your Compute Engine instance footprint provides valuable insight into your usage trends and helps you manage your instance quota. For more, head over to the Github repo and learn about Stackdriver Monitoring.
