This page shows how to configure a cluster for Google Distributed Cloud so that custom logs and metrics from user applications are sent to Cloud Logging and Cloud Monitoring and Google Cloud Managed Service for Prometheus.
For the best user application logging and monitoring experience, we strongly recommend that you use the following configuration:
Enable Google Cloud Managed Service for Prometheus by setting
enableGMPForApplicationstotruein theStackdriverobject. This configuration lets you monitor and alert on your workloads globally, using Prometheus. For instructions and additional information, see Enable Google Cloud Managed Service for Prometheus on this page.Enable Cloud Logging for user applications by setting
enableCloudLoggingForApplicationstotruein theStackdriverobject. This configuration provides logging for your workloads. For instructions and additional information, see Enable Cloud Logging for user applications on this page.
Enable Google Cloud Managed Service for Prometheus
The configuration for Google Cloud Managed Service for Prometheus is specified in a
Stackdriver object named stackdriver. For additional information, including
best practices and troubleshooting, see the
Google Cloud Managed Service for Prometheus documentation.
To configure the stackdriver object to enable Google Cloud Managed
Service for Prometheus:
Open the stackdriver object for editing:
kubectl --kubeconfig=CLUSTER_KUBECONFIG \
    --namespace kube-system edit stackdriver stackdriver
Replace
CLUSTER_KUBECONFIGwith the path of your cluster kubeconfig file.Under
spec, setenableGMPForApplicationstotrue:apiVersion: addons.gke.io/v1alpha1 kind: Stackdriver metadata: name: stackdriver namespace: kube-system spec: projectID: ... clusterName: ... clusterLocation: ... proxyConfigSecretName: ... enableGMPForApplications: true enableVPC: ... optimizedMetrics: trueSave and close the edited file.
The Google-managed Prometheus components start automatically in the cluster in the
gmp-systemnamespace.Check the Google-managed Prometheus components:
kubectl --kubeconfig=CLUSTER_KUBECONFIG --namespace gmp-system get podsThe output of this command is similar to the following:
NAME                              READY   STATUS    RESTARTS        AGE
collector-abcde                   2/2     Running   1 (5d18h ago)   5d18h
collector-fghij                   2/2     Running   1 (5d18h ago)   5d18h
collector-klmno                   2/2     Running   1 (5d18h ago)   5d18h
gmp-operator-68d49656fc-abcde     1/1     Running   0               5d18h
rule-evaluator-7c686485fc-fghij   2/2     Running   1 (5d18h ago)   5d18h
Google Cloud Managed Service for Prometheus supports rule evaluation and alerting. To set up rule evaluation, see Rule evaluation.
Run an example application
The managed service provides a manifest for an example application,
prom-example, that emits Prometheus metrics on its metrics port. The
application uses three replicas.
To deploy the application:
Create the
gmp-testnamespace for resources that you create as part of the example application:kubectl --kubeconfig=CLUSTER_KUBECONFIG create ns gmp-testApply the application manifest with the following command:
kubectl -n gmp-test apply \
    -f https://raw.githubusercontent.com/GoogleCloudPlatform/prometheus-engine/v0.4.1/examples/example-app.yaml
Configure a PodMonitoring resource
In this section, you configure a
PodMonitoring
custom resource to capture metrics data emitted by the example application and
send it to Google Cloud Managed Service for Prometheus. The PodMonitoring custom resource
uses target scraping. In this case, the collector agents scrape the /metrics
endpoint to which the sample application emits data.
A PodMonitoring custom resource scrapes targets in the namespace in which it's
deployed only. To scrape targets in multiple namespaces, deploy the same
PodMonitoring custom resource in each namespace. You can verify the
PodMonitoring resource is installed in the intended namespace by running the
following command:
kubectl --kubeconfig CLUSTER_KUBECONFIG get podmonitoring -A
For reference documentation about all the Google Cloud Managed Service for Prometheus custom resources, see the prometheus-engine/doc/api reference.
The following manifest defines a PodMonitoring resource, prom-example, in
the gmp-test namespace. The resource finds all Pods in the namespace that have the label
app with the value prom-example. The matching Pods are
scraped on a port named metrics, every 30 seconds, on the /metrics
HTTP path.
apiVersion: monitoring.googleapis.com/v1
kind: PodMonitoring
metadata:
  name: prom-example
spec:
  selector:
    matchLabels:
      app: prom-example
  endpoints:
  - port: metrics
    interval: 30s
To apply this resource, run the following command:
kubectl --kubeconfig CLUSTER_KUBECONFIG -n gmp-test apply \
    -f https://raw.githubusercontent.com/GoogleCloudPlatform/prometheus-engine/v0.4.1/examples/pod-monitoring.yaml
Google Cloud Managed Service for Prometheus is now scraping the matching Pods.
Query metrics data
The simplest way to verify that your Prometheus data is being exported is to use PromQL queries in the Metrics Explorer in the Google Cloud console.
To run a PromQL query, do the following:
In the Google Cloud console, go to the Monitoring page or click the following button:
In the navigation pane, select
 Metrics Explorer.
Use Prometheus Query Language (PromQL) to specify the data to display on the chart:
In the toolbar of the Select a metric pane, select Code Editor.
Select PromQL in the Language toggle. The language toggle is at the bottom of the Code Editor pane.
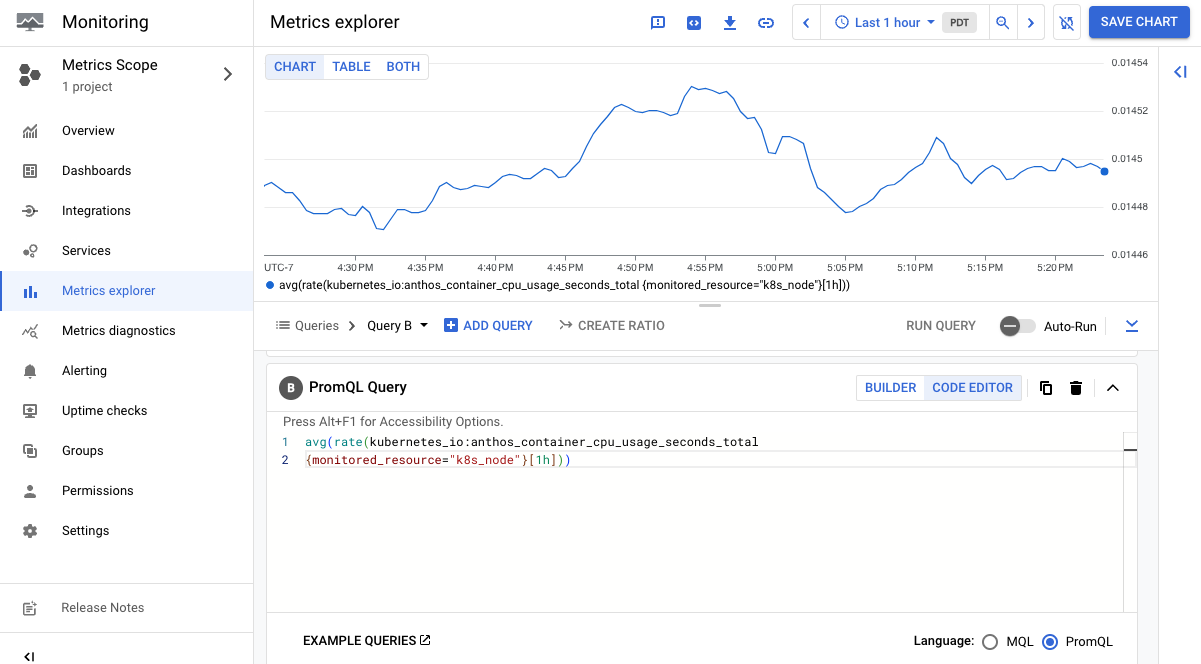
Enter your query into the query editor. For example, to chart the average number of seconds CPUs spent in each mode over the past hour, use the following query:
avg(rate(kubernetes_io:anthos_container_cpu_usage_seconds_total
{monitored_resource="k8s_node"}[1h]))
For more information about using PromQL, see PromQL in Cloud Monitoring.
The following screenshot shows a chart that displays the
anthos_container_cpu_usage_seconds_total metric:
If you collect large amounts of data, you might want to filter exported metrics to keep down costs.
Enable Cloud Logging for user applications
The configuration for Cloud Logging and Cloud Monitoring is held in a Stackdriver object named stackdriver.
Open the stackdriver object for editing:
kubectl --kubeconfig=CLUSTER_KUBECONFIG \
    --namespace kube-system edit stackdriver stackdriver
Replace
CLUSTER_KUBECONFIGwith the path of your user cluster kubeconfig file.In the
specsection, setenableCloudLoggingForApplicationstotrue:apiVersion: addons.gke.io/v1alpha1 kind: Stackdriver metadata: name: stackdriver namespace: kube-system spec: projectID: ... clusterName: ... clusterLocation: ... proxyConfigSecretName: ... enableCloudLoggingForApplications: true enableVPC: ... optimizedMetrics: trueSave and close the edited file.
Run an example application
In this section, you create an application that writes custom logs.
Save the following Deployment manifests to a file named
my-app.yaml.apiVersion: apps/v1 kind: Deployment metadata: name: "monitoring-example" namespace: "default" labels: app: "monitoring-example" spec: replicas: 1 selector: matchLabels: app: "monitoring-example" template: metadata: labels: app: "monitoring-example" spec: containers: - image: gcr.io/google-samples/prometheus-dummy-exporter:latest name: prometheus-example-exporter imagePullPolicy: Always command: - /bin/sh - -c - ./prometheus-dummy-exporter --metric-name=example_monitoring_up --metric-value=1 --port=9090 resources: requests: cpu: 100mCreate the Deployment
kubectl --kubeconfig CLUSTER_KUBECONFIG apply -f my-app.yaml
View application logs
Console
Go to the Logs Explorer in the Google Cloud console.
Click Resource. In the ALL RESOURCE TYPES menu, select Kubernetes Container.
Under CLUSTER_NAME, select the name of your user cluster.
Under NAMESPACE_NAME, select default.
Click Add and then click Run Query.
Under Query results, you can see log entries from the
monitoring-exampleDeployment. For example:{ "textPayload": "2020/11/14 01:24:24 Starting to listen on :9090\n", "insertId": "1oa4vhg3qfxidt", "resource": { "type": "k8s_container", "labels": { "pod_name": "monitoring-example-7685d96496-xqfsf", "cluster_name": ..., "namespace_name": "default", "project_id": ..., "location": "us-west1", "container_name": "prometheus-example-exporter" } }, "timestamp": "2020-11-14T01:24:24.358600252Z", "labels": { "k8s-pod/pod-template-hash": "7685d96496", "k8s-pod/app": "monitoring-example" }, "logName": "projects/.../logs/stdout", "receiveTimestamp": "2020-11-14T01:24:39.562864735Z" }
gcloud CLI
Run this command:
gcloud logging read 'resource.labels.project_id="PROJECT_ID" AND \
    resource.type="k8s_container" AND resource.labels.namespace_name="default"'
Replace
PROJECT_IDwith the ID of your project.In the output, you can see log entries from the
monitoring-exampleDeployment. For example:insertId: 1oa4vhg3qfxidt labels: k8s-pod/app: monitoring-example k8s- pod/pod-template-hash: 7685d96496 logName: projects/.../logs/stdout receiveTimestamp: '2020-11-14T01:24:39.562864735Z' resource: labels: cluster_name: ... container_name: prometheus-example-exporter location: us-west1 namespace_name: default pod_name: monitoring-example-7685d96496-xqfsf project_id: ... type: k8s_container textPayload: | 2020/11/14 01:24:24 Starting to listen on :9090 timestamp: '2020-11-14T01:24:24.358600252Z'
Filter application logs
Application log filtering can reduce application logging billing and network
traffic from the cluster to Cloud Logging. Starting with
Google Distributed Cloud release 1.15.0, when enableCloudLoggingForApplications
is set to true, you can filter application logs by the following criteria:
- Pod labels (
podLabelSelectors) - Namespaces (
namespaces) - Regular expressions for log content (
contentRegexes)
Google Distributed Cloud sends only the filter results to Cloud Logging.
Define application log filters
The configuration for Logging is specified in a Stackdriver
object named stackdriver.
Open the
stackdriverobject for editing:kubectl --kubeconfig USER_CLUSTER_KUBECONFIG --namespace kube-system \ edit stackdriver stackdriverReplace USER_CLUSTER_KUBECONFIG with the path to your user cluster kubeconfig file.
Add an
appLogFiltersection to thespec:apiVersion: addons.gke.io/v1alpha1 kind: Stackdriver metadata: name: stackdriver namespace: kube-system spec: enableCloudLoggingForApplications: true projectID: ... clusterName: ... clusterLocation: ... appLogFilter: keepLogRules: - namespaces: - prod ruleName: include-prod-logs dropLogRules: - podLabelSelectors: - disableGCPLogging=yes ruleName: drop-logsSave and close the edited file.
(Optional) If you're using
podLabelSelectors, restart thestackdriver-log-forwarderDaemonSet to effect your changes as soon as possible:kubectl --kubeconfig USER_CLUSTER_KUBECONFIG --namespace kube-system \ rollout restart daemonset stackdriver-log-forwarderNormally,
podLabelSelectorsare effective after 10 minutes. Restarting the DaemonSetstackdriver-log-forwardermakes the changes take effect more quickly.
Example: Include ERROR or WARN logs in prod namespace only
The following example illustrates an application log filter works. You define a
filter that uses a namespace (prod), a regular expression
(.*(ERROR|WARN).*), and a Pod label (disableGCPLogging=yes). Then, to verify
that the filter works, you run a Pod in the prod namespace to test these
filter conditions.
To define and test an application log filter:
Specify an application log filter in the Stackdriver object:
In the following
appLogFilterexample, onlyERRORorWARNlogs in theprodnamespace are kept. Any logs for Pods with the labeldisableGCPLogging=yesare dropped:apiVersion: addons.gke.io/v1alpha1 kind: Stackdriver metadata: name: stackdriver namespace: kube-system spec: ... appLogFilter: keepLogRules: - namespaces: - prod contentRegexes: - ".*(ERROR|WARN).*" ruleName: include-prod-logs dropLogRules: - podLabelSelectors: - disableGCPLogging=yes # kubectl label pods pod disableGCPLogging=yes ruleName: drop-logs ...Deploy a Pod in the
prodnamespace and run a script that generatesERRORandINFOlog entries:kubectl --kubeconfig USER_CLUSTER_KUBECONFIG run pod1 \ --image gcr.io/cloud-marketplace-containers/google/debian10:latest \ --namespace prod --restart Never --command -- \ /bin/sh -c "while true; do echo 'ERROR is 404\\nINFO is not 404' && sleep 1; done"The filtered logs should contain the
ERRORentries only, not theINFOentries.Add the label
disableGCPLogging=yesto the Pod:kubectl --kubeconfig USER_CLUSTER_KUBECONFIG label pods pod1 \ --namespace prod disableGCPLogging=yesThe filtered log should no longer contain any entries for the
pod1Pod.
Application log filter API definition
The definition for the application log filter is declared within the stackdriver custom resource definition.
To get the stackdriver custom resource definition, run the following command:
kubectl --kubeconfig USER_CLUSTER_KUBECONFIG get crd stackdrivers.addons.gke.io \
    --namespace kube-system -o yaml